Published by Science and Education Publishing DOI:10.12691/jfs-8-2-3
Characterizing Biometrics and Nutrient Profiles of Fillet
and Offal Components to Better Utilize Harvests of
Invasive Carp in the U.S.
Clay S. Ferguson1, David D. Kuhn1,*, Brian R. Murphy2, Sean F. O’Keefe1, Quinton E. Phelps3, Stephen A. Smith4
1Department of Food Science and Technology, Virginia Tech, Blacksburg, Virginia, USA 2
Department of Fish and Wildlife Conservation, Virginia Tech, Blacksburg, Virginia, USA 3
Department of Biology, Missouri State, Springfield, Missouri, USA 4
Virginia-Maryland College of Veterinary Medicine, Virginia Tech, Blacksburg, Virginia, USA *Corresponding author: davekuhn@vt.edu
Received May 23, 2020; Revised June 24, 2020; Accepted July 03, 2020
Abstract
The successful establishment of fisheries for invasive Asian carp (AC) would help alleviate theecological, societal, and economic bane they impose on natural U.S. waterways, all while supplementing domestic fisheries and addressing food insecurity in high-stress regions. However, fishers of AC and the post-harvest industries lack the economic resiliency needed to self-sustain operations. Providing detailed nutrient compositions and biometric yields of edible and inedible components would strengthen consumer demands and grow supplemental product-revenue streams, all supporting commercial fisheries removal of AC. To incentivize capture and utilization of silver carp (Hypophthalmichthys molitrix), the most abundant of the invasive AC, we addressed this dearth in the literature by characterizing yields and composition of silver carp fillets and offal components (edible portions: head, frame, and trimmings) (non-edible portion: viscera). Mature silver carp collected in late June from the Ohio River (Kentucky, U.S.) were separated into major components, characterized for yields, and then evaluated across length, gender, and body condition to identify trends in biometric data. Detailed nutrient parameters were then characterized for all components. Comparatively low fillet yields (< 20%) whole-weight (w/w) and high offal-component yields of heads (35.8%), frames (23.0%), and trimmings (17.1%) w/w obtained from this post-spawn sample signify ramifications of seasonal harvest and the importance of by-product utilization. Boneless fillets produced the highest proportions of crude protein (93% dry-matter basis), essential amino acids (lysine 8.0% and leucine 6.9% of crude protein), omega-3 fatty acids (18.2% of total lipids), and several important macro minerals. Still, all edible and offal components produced attractive omega-6:omega-3 (< 1.0), which is consistent with nutrient-rich marine finfish. Findings from this study provide information that can be used to increase domestic-consumptive demand and improve the economic resiliency of commercial fisheries charged with controlling the bio-invasion of AC.
Keywords
: silver carp, commercial fisheries, resource recovery, food securityCite This Article:
Clay S. Ferguson, David D. Kuhn, Brian R. Murphy, Sean F. O’Keefe,Quinton E. Phelps, and Stephen A. Smith, “Characterizing Biometrics and Nutrient Profiles of Fillet and Offal Components to Better Utilize Harvests of Invasive U.S. Carp.” Journal of Food Security, vol. 8, no. 2 (2020): 52-65. doi: 10.12691/jfs-8-2-3.
1. Introduction
The hardiness and life-history traits of Asian carp
[1,2] supported the inward expansion of early subsistence-fishing civilizations by increasing aquatic food supplies that were previously geographically restricted to ocean resources. [3] Adding context to their historic value, carp became recognized as prized commodities in ancient-day Southern Bohemia (current day Trebon of Czechia) -- one pound often fetching the bartering equivalent of nine pounds
of beef or twenty loaves of bread. [3] Although underutilized by societies receiving more-recent introductions, silver carp (Hypophthalmichthys molitrix), bighead carp (Hypophthalmichthys nobilis), black carp (Mylopharyngodon piceus), and grass carp (Ctenopharyngodon idella), hereafter referred to collectively as Asian carp (AC), represent three of the top-five globally consumed freshwater-fishes. [4] Today, wild AC populations contribute significantly to global food security, with some promising abundant, untapped resources.
and multiplied, threatening native faunal and floral biodiversity of the greater Mississippi waterways. [7,8,9]
Of the four AC, silver and bighead carp, the two planktivorous, filter-feeding species, are considered most deleterious due to the current breadth of their expansion, population densities, and competitive nature of their feeding guild on nearly all native aquatic assemblages.
[10,11,12] Despite near decades of interagency and institutional collaboration to reduce AC populations and bolster the commercial fishery, AC populations continue to spread. [12,13,14,15,16] Establishing consumptive demand for AC in the U.S. remains pivotal to propelling commercial fisheries to harvest and subsequently reduce AC populations.
North American AC fisheries could also prove critical in an era of unprecedented-human population growth. [17]
Increasing food demands have stressed global resources, heightened calls for agricultural and dietary reform, and led to protein shortages. [18] Expanding land development for agriculture requires proportional sacrifices to the ecosystem services that undeveloped lands provide.
[19,20,21] These apparent limitations on terrestrial food production have and will continue to shift food reliance to aquatic ecosystems. [22] Sustainably or not, global fish supply is expected to increase 24% by 2030; capture fisheries are expected to contribute less than 10% of that supply increase. [23] Aquaculture is tasked with meeting the bulk of rising consumer demands, yet its reliance on depleted marine resources [4] and finite terrestrial ingredients for feedstuff [24] could lessen its responsive potential. While the notion of an unwanted, easily captured, abundant-wild resource seems unrealistic in today’s circumstances, such is the potential of North American AC fisheries. In due time, growing urgencies that propel global-protein demands could, in themselves, drive the utilization of abundant U.S. AC resources. However, the timely establishment of profitable, self-sustaining fisheries is urgent to minimize ecological and economic impacts incurred by invaded or soon-to-be-invaded waters. [25]
Past studies evaluating consumer perceptions of AC
[26,27] concluded that efforts highlighting the benefits of consumption would increase general dietary acceptance and willingness to try. Responding to calls for intensified market-based research, others began evaluating nutrient profiles of whole silver and bighead carp [28] as well as the performance of value-added carp products in aquafeeds and other feedstuffs. [29,30] Their findings highlighted the competitive performance of silver carp to market standards, both in terms of suitable nutrient profiles and alluring prospective prices. Additional literature corroborated the attractive nutrient profiles in grass carp by-products [31] and silver carp fillets. [32,33]
Nonetheless, low-market value of AC disseminates unattractive ex-vessel prices, curbing fishers’ willingness to pursue AC. [34,35] Consequently, large removal efforts routinely discard AC in absence of infrastructure or funds required to conserve harvest quality through transport, processing, and storage. [36] Even when utilized, bulk harvests are rarely processed as products higher than soil amendment on EPA’s food recovery hierarchy. [37] Still today, most harvests are not sold for human consumption and thus private subsidies are needed to counteract low
returns on industry operation. [12] All evidence indicates that a potentially useful resource is being undervalued, diminishing the fisheries’ ability to control invasive AC.
AC are among a lengthy list of neglected and underutilized species (NUS), defined as organisms that receive insufficient research or policy attention to realize their potential as a food source. [38,39] NUS are commonly collected from the wild or cultured with few external inputs [40], thereby becoming more economically accessible to low-income demographics for whom food scarcity is commonplace. Interagency research and policies have opened a legal platform for the utilization of AC. [14,41] Nonetheless, shortages in market-centered research fragment the data needed to inform value potential for both the industry and consumer base and is a likely explanation to their neglect and underutilization within the U.S. Moreover, underutilized AC is likely attributable to a market-driven approach (reacting to the preferences within a market structure) for which there is no or an insignificant market demand. [42] Alternatively, a driving-market approach does not require an existing market framework since it tactfully wields beneficial product attributes to enhance a product’s competitive edge. The sudden emergence of the orange roughy (Hoplostethus atlanticus) into global markets demonstrates how a driving-market approach can construct viable markets around novel resources without preexisting market frameworks. [43] By this logic, there is potential for AC to assume their own market identity without conforming to existing market constraints. To deploy a driving-market approach, however, descriptive data that characterizes the resource with indices pertinent to prospective entrepreneurs and consumers must be provided. [43]
The composition of whole silver carp (SVCP), among other cyprinids, has been described both biochemically and biometrically [28,32]. However, if SVCP fillets gain market traction for human consumption, as is needed for fisheries to gain some level of economic resiliency, then the remaining collective or siloed offal components would remain largely undescribed. Consequently, utilization of offal components would likely diminish or fail to reach full-value potential and remain a neglected asset that could otherwise sustain removal efforts. [44] Primary offal-component yields and proximate nutrient data (moisture, ash, total lipid, crude protein) have been described for non-indigenous silver and common carp from Israeli waters. [45] Yet to our knowledge, no study has determined major or minor fillet and offal component yields alongside detailed nutrient characterization (amino acid, fatty acid, mineral profiles) of those respective components for SVCP, the most abundant species among the invasive AC in the U.S.
Characterizing nutrient profiles for components that could be reasonably siloed by processors would increase SVCP’s aptitude for multi-stream product utilization. Providing nutrient characterizations of raw SVCP components would also bypass a major limitation for inclusion in food and feed-processor supply chains. [44]
and presently operating companies in their evaluations of production baselines and appropriate economies of scale. Specifically, knowing what to expect out of fillet yields and fillet-to-offal ratios could prove valuable in product development, equipment and labor planning, and product-supply contracts. [46] Furthermore, with said information, businesses struggling to establish profit margins due to unpredictable supplies or demands may be afforded the knowledge to re-strategize end-product utilization and repurpose discarded or underutilized primary or by-products for higher-value markets.
This study examined fillet and offal component yields with respective nutrient profiles from an Ohio River SVCP population to support the utilization and removal efforts intended to reduce invasive AC populations. Specific objectives included: 1) report component yields as component by whole-weight (w/w) percentages; 2) evaluate individual fish attributes (length, condition, gender) for effects on yield trends; 3) characterize nutrient profiles of fillet and offal components; 4) contextualize the significance of bioactive compounds and other valuable nutrients found in components to consumer interests.
2. Materials and Methods
2.1. Sample Collection and Characterization
We collected SVCP in partnership with the Kentucky Department of Fish and Wildlife Resources (DFWR) and Indiana Department of Natural Resources on June 27th, 2019 from an Ohio River tributary (Clover Creek) in Cloverport, KY, USA (37°49'22.5"N / 86°37'06.5"W). Fish were captured using an aggregate deployment of boat-electrofishing and downstream ‘herding’ into gillnets stretched across the mouth of the tributary. SVCP were arbitrarily selected then measured for total length (tl, mm), weighed (w, g), and sexed via the rapid pectoral-fin gender-determination method. [47] Initial gender determinations were confirmed by a visual inspection of gonad development, when present. Sampling was terminated when representative length classes were acquired. All fish were handled and humanely euthanized using methods approved by Virginia Tech’s Institutional Animal Care and Use Committee (VT-IACUC #19-038) under the auspices of Virginia Tech’s Animal Welfare Assurance Program (#A-3208-01) and USDA-APHIS-AC Registration Certificate (#52-R-0012).
General size-structure of the original sample was shown through a length-frequency table categorized by proportional size distribution (PSD) length-bins encompassing PSD-preferred (560-739 mm), PSD-memorable (740-929 mm), and PSD-trophy (>930 mm) categories. [48]
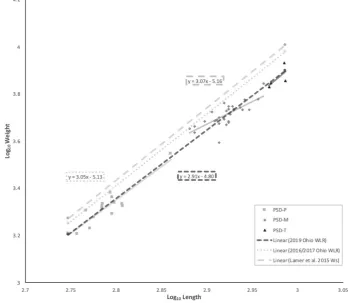
Weight-length relationship (WLR) equations (Eq. 1), commonly used to model species-growth trends and to predict the weight of an individual fish at a given length, were generated from a linear regression plot of log10weight as a function of log10length. WLRs were
assigned for the entire sample, PSD-length bins, and gender; WLR slopes outside the 2.5-3.5 range were
excluded from evaluation (Table 1). [49] The WLR trendline equation used can be expressed as:
10 10
log W = loga+b log L (1)
Where ‘a’ is the y-intercept, ‘b’ is the slope value, ‘W’ is total weight, and ‘L’ is total length.
WLR b-values are normally distributed around a slope of 3.0 for the majority of defined species, indicating that isometric or nearly isomeric growth is a general normality for fish body condition and geometry through time. [49,50]
To evaluate the normalcy of our sample, the slopes of generated WLRs were compared with slopes from other standardized sample equations obtained from scientific literature and reports. Assessing SVCP condition relative to past findings provided important context for yield and nutrient results as well for future market-based comparisons and extrapolations.
Using standardized WLRs as indices is useful for detecting clines in population body conditions. Detecting clines in body condition across populations can be influenced by a host of factors including differences in: forage availability, quality of forage, habitat variability and quality, seasonality, weather stochasticity, genetics, and life stage development. [49] Relative weight (Wr), a
body-condition index used to assess the well-being of fish or fishes of a population [51], was used to evaluate the relative body condition of SVCP categorized by gender and length in search of correlations with component yields. Specifically, Wr is the weight
of an individual fish divided by a population-wide constructed standard weight (Ws) at that individual’s
length (Eq. 3). [51] Ws was constructed for SVCP by
Lamer et al. [52], using the regression line percentile (RLP) method set on the 50th percentile. Note that with a 50th percentile RLP Ws, a Wr value of 100 indicates median
condition, not ‘good’ condition as the 75th percentile RLP was designed. [51]
( )
10 s 5.15756 3.06842( 10 ( ))
log W g = − + log tl mm (2)
Where ‘tl’ is total length.
) 0
( / 10
r s
W = W W x (3)
Where ‘W’ is total weight from fish under study.
While Wr is effective at contextualizing our sample to
median SVCP conditions in the U.S., it fails to contextualize the sample specifically to the Ohio River SVCP population. If the Ohio River population did not reflect the weight-length relationship of the Ws
equation, then comparing our sample to only Ws
would suggest the condition of our sample was abnormal for that which could be expected for Ohio SVCP, or vice versa. To avoid said biases, we compared our sample’s condition with a WLR (Eq. 4) generated by Kentucky’s DFWR, amended from Hayer, Graeb, and Bertrand [53], using data collected from 2016-2017 fall sampling of the Ohio River’s Cannelton pool, near Cloverport, KY.
10 ’ 5.13 3.05( 10 )
log W = − + log L (4)
Table 1. Body-Condition Indices Characterized Across Our Ohio River SVCP Sample, Respective PSD-Length Bins, and Gender.
Category Frequency Wr a b r2 600 (mm)w 900 (mm)v Sample N=50 82 ± 2 -4.8 2.91 0.97 1960 6380 PSD-P z 15 (30%) 83 ± 3 -4.64 2.85 0.85 -- -- PSD-M y 31 (62%) 81 ± 3 -2.51 2.13 0.67 -- -- PSD-T x 4 (8%) 77 ± 6 -5.54 3.16 0.48 -- --
P-value 0.3079
Male 32 (64%) 81 ± 3 -4.83 2.93 0.97 1987 6504 Female 18 (36%) 82 ± 2 -4.91 2.95 0.97 1960 6486 P-value 0.7323
Relative weight (Wr) ( ± 95% CI) was calculated using Lamer et al., (2015) standard weight (Ws) equation: log10Ws (g) = -5.15756 + 3.06842(log10 tl(mm)). Weight-length relationship (WLR) equations were reported where ‘a’ is the WLR y-intercept and ‘b’ is the WLR slope. P-values were significant if < 0.05.
z Proportional Stock Density-Preferred length-bin for fish measuring 560-739 mm (tl) y Proportional Stock Density-Memorable length-bin for fish measuring 740-929 mm (tl) x
Proportional Stock Density-Preferred length-bin for fish measuring > 930 mm (tl) w Predictive weight (g) for fish measuring 600 mm (tl) from respective WLRs v Predictive weight (g) for fish measuring 900 mm (tl) from respective WLRs
2.2. Fillet and Offal Component Yield
SVCP were then physically separated into six components by physiologically related parts that could reasonably be siloed in a commercial setting for primary or by-product specialization. These components included: head (dorsoventrally crosscut, posterior to the operculum and pectoral fins), whole fillet (skin and intact fillet), boneless fillet (y-bones and skin removed, red meat trimmed), frame (skeleton and fins, belly flaps removed), viscera (internal organs), and trimmings (skin, belly flaps, y-bones, red meat). Three fish filleters were trained to make precise cuts using agreed-upon meristic reference points to guide cuts and ensure consistent yield data. Each separate component was individually weighed and divided by total weight for component-yield calculations (Eq. 5).
( )
( )
%
100.
Component Yield
Wet Component g x Wet Total Body Weight g
= (5)
2.3. Nutrient Characterization
Referencing methods adapted from Bowzer and Trushenski [9], frozen bulk samples were size-reduced into approximately 5 cm cubes using an industrial meat and bone bandsaw (Hobart 5801, Troy, Ohio, USA), then pulverized while frozen using a Waring commercial blender (Waring CB-6, Winsted, CT, USA). The resulting-granulated paste was homogenized by hand before a random subsample of 200 g was transferred to a weigh-boat at a thickness not exceeding ½ an inch, probed to create sublimation facilitating pores, covered with aluminum foil to avoid splatter loss, and refrozen at -20oC. Lyophilization of each 200 g subsample for 72 hours (FreeZone 18L, Labconco, Kansas City, MO, USA) allowed for gravimetric determination of moisture content. Lyophilized samples were then shredded to powder form in a blender (Vitamix 7500, Cleveland, OH, USA) to facilitate later analysis of nutrient proximities along with complete fatty acids, amino acids, and minerals. All samples were sealed from ambient air immediately
following lyophilization and shredding to avoid undesirable rehydration or oxidation. At all intermediate stages, samples were stored at -20°C.
Ash content was determined gravimetrically after heating two g of lyophilized sample in a muffle furnace held at 550°C for 5 hours (AOAC 942.05). Total lipid extraction was performed through chloroform-methanol extraction [54] using one g of lyophilized sample. Fatty acid methyl esters (FAME) were produced following the official American Oil Chemists’ Society method for marine oil samples (AOCS Cd-1-89) using base transmethylation and acid methylation. The resulting FAME were separated using a Shimadzu GCMS-TQ8030 gas chromatograph triple quadrupole mass spectrometer (Shimadzu Scientific Instruments, Kyoto, Japan) in Q3 mode outfitted with a ZB-Wax bonded polyethylene glycol, flexible fused silica capillary wall-coated open tubular column (ZB-WAX plus 250, 60 m x 0.25 mm I.D., 0.25 μm film) (Phenomenex, Torrance, CA, USA). The injection volume was 1.0 μL, with helium as the carrier gas (linear flow velocity 40 cm/sec) and an injector temperature of 250°C. A split injection technique (1:25) was used, with a temperature program as follows: 175°C held for 5 min, increased to 225°C at 2°C/min, and held at 220°C for 10 min. Individual FAME were identified by library comparisons (NIST), calculated equivalent-chain lengths, and literature reference. [55] Non-identifiable peaks were left out of calculations and reports. Silver nitrate thin-layer chromatography was used to validate identified fatty acids. The procedure described by Christie
2.4. Data Analysis
Sample sizes were reduced strategically with progression through objectives to obtain a reasonable balance between statistical power and resource conservation. For this same reason, number of fillet and offal components were also reduced, through recombination from six-separate components (evaluated for the biometric objectives) into four-separate components for all nutrient characterization. These four recombined components consisted of heads, boneless fillets, frames (skeleton, fins, and trimmings), and viscera. A total of 50 SVCP were sampled to provide analysis of component yields and interactions of interest on these yields. From this original sample, 15 fish were arbitrarily selected for moisture and ash analysis. From these 15 samples, six fish were randomly chosen to complete more elaborate, detailed nutrient profiles. This sampling strategy is consistent and meets or exceeds sample standards of similar nutritional studies. [57]
Gender and PSD length-bin effects on Wr were
compared using two-tailed t-tests and one-way ANOVA, respectively. Tukey’s HSD test was used to identify points of significance across treatments (P-value < 0.05) when indicated by one-way ANOVA. Component yield percentages were compared with a two-tailed t-test across binary data, categorized by gender and condition. Similar to Wright [58], condition bins were defined as poor (Wr <
80) and fair (80 < Wr < 100). Component yield
percentages as a function of PSD length-bins were
evaluated with one-way AVOVAs, again, followed by a Tukey’s HSD test when appropriate. Component yields were reported as means with upper and lower-bound 95% confidence intervals. Nutrient proximities were averaged by component type and reported as mean ± 95% confidence level. The mean values were then used to calculate appropriate mass-balance combinations of offal-component parameters. Nutrient parameters were compared for significance between the four-primary components via one-way ANOVA with subsequent Tukey’s HSD tests. All statistical analysis was performed in SAS software (JMP®, Version Pro 14, SAS Institute Inc., Cary, NC, USA).
3. Results
SVCP lengths (mm) and weights (g) ranged from 560 to 970 (mean= 778) and 1608 to 8520 (mean= 4451), respectively (Table 1). Our results described almost exclusively sexually mature SVCP at post-spawn status. Nearly all SVCP displayed gonad development, though markedly reduced from prior spawning(s) and in variable development stages across individuals. Moreover, little to no visceral fat was observed in the samples. The WLR attained from the cumulative sample demonstrated negative-allometric growth log10W = -4.80 + 2.91(log10L)
(Figure 1). Overlaying the comparative WLR trendlines (Eq. 2 and 4) suggests our sample was in inferior relative condition with conditional divergence increasing with SVCP length. (Figure 1).
Table 2. Silver Carp Component-Yield Percentages [mean; lower 95% Cl, upper 95% CI] Reported for Whole Sample (n=50) and Partitioned by PSD-Bins, Gender, and Relative Weight (Wr).
Category Head Frame Viscera Fillet (whole) Fillet (boneless) Trimmings
All samples 35.8 23.0 7.2 26.0 13.4 17.1 (34.9, 36.7) (22.3, 23.7) (6.8, 7.6) (24.9, 27.1) (12.6, 14.2) (16.2, 18.0)
PSD-P 33.4
b 23.4 6.8 28.9 a 15.1 a 19.4 a (32.5, 34.2) (22.0, 24.7) (6.2, 7.4) (27.0, 30.7) (14.1, 16.1) (18.2, 20.7) PSD-M 37.2
a 22.8 7.6 24.3 b 12.5 b 15.8 b (36.1, 38.3) (22.0, 23.7) (7.0, 8.1) (23.2, 25.4) (11.5, 13.5) (14.7, 16.9) PSD-T 34.7
ab 23.2 6.3 28.0 ab 13.5 ab 18.6 ab (31.9, 37.5) (19.7, 26.6) (5.3, 7.4) (23.6, 32.5) (9.6, 17.3) (15.2, 22.1)
P-value 0.0002 0.8104 0.1204 0.0003 0.0134 0.0008
Male 35.8 22.7 6.7
b 26.4 13.7 17.4 (34.7, 36.9) (21.8, 23.7) (6.4, 7.0) (25.1, 27.7) (12.7, 14.7) (16.2, 18.6) Female 35.9 23.6 8.2
a 25.2 12.8 16.7 (34.3, 37.5) (22.6, 24.5) (7.3, 9.0) (23.2, 27.2) (11.4, 14.2) (15.8, 18.8)
P-value 0.8830 0.2233 0.0054 0.3133 0.3331 0.4737
Poor Wr (< 80) 36.6 23.2 7.1 25.9 13.1 16.7 (35.3, 37.9) (22.0, 24.4) (6.5, 7.8) (24.3, 27.5) (11.9, 14.3) (15.3, 18.1) Fair Wr (> 80) 35.2 22.9 7.3 26.1 13.6 17.5
(34.0, 36.4) (22.0, 23.7) (6.7, 7.9) (24.6, 27.6) (12.5, 14.7) (16.2, 18.7) P-value 0.1254 0.7177 0.7304 0.8738 0.5404 0.4140
The average Wr corroborated this observation with a
value of 82, well below the median RLP. The highest-conditioned SVCP (Wr 94) fell short of the Ws 50th
percentile determined collectively from sampling SVCP populations in the lower to mid-Mississippi River drainage. [52] In general, Wr tended to decrease with
increasing PSD length-bins, although not significantly (Table 1). The 2016-2017 Ohio River WLR paralleled the
Ws closely, suggesting the 2016-2017 Ohio population
reflected the median, population-wide SVCP body condition (Figure 1). Gender had no detectable effect on body condition. However, several component-yield percentages were significantly affected by total fish length and gender. Head, whole fillet, boneless fillet, and trimming yields varied significantly across PSD-length bins (Table 2). For example, head yield from PSD-M length fish was significantly greater than PSD-P fish (Table 2). Sample size (n=4) was too small to indicate
whether this trend continued into trophy length fish. Generally, shorter fish compensated for lower head yields through significantly higher fillet and trimming yields.
Shorter fish also tended towards better body condition; thus, body condition and length are thought to interact with component yield trends. Although not significant, head yields tended to decrease in fairer conditioned fish and was compensated through distal body tissues, including marginal increases in fillet and trimming yields (Figure 2). Gender had little effect on component yields with the exception of viscera, where the average female wielded significantly more viscera than the average male. The sum of all component weights subtracted from total fish weight was assumed to account for the loss of fluids (mean = 3.5%), including blood and visceral fluid (Figure 2). Belly-flap yields were calculated at an average of 4.5% by subtracting the difference in whole fillet and boneless fillet (y-bones, red meat, and skins) from trimmings for each SVCP.
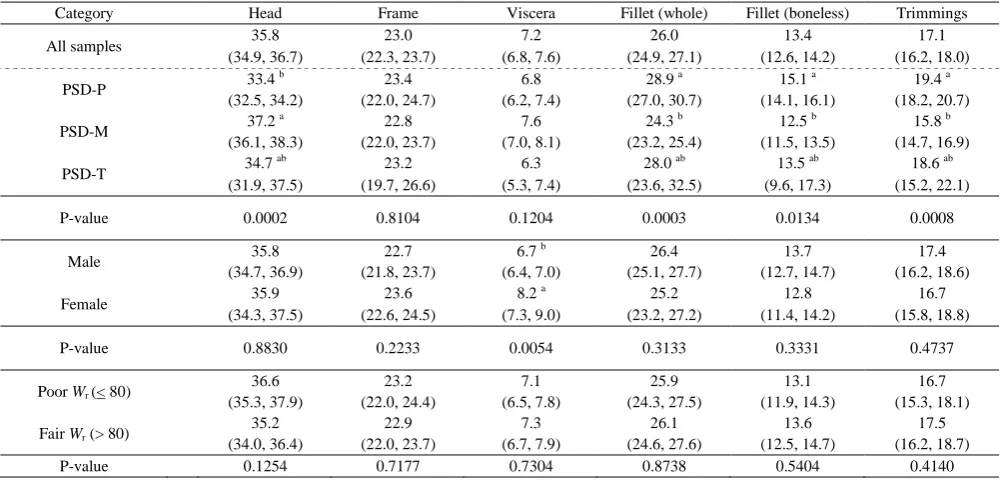
Table 3. Nutrient Proximates and Fatty Acid Compositional Summary of Fillet and Offal Components [mean ± 95% Cl] with Mass-Balance Offal Recombination [calculated mean] for Our Ohio River Silver Carp Sample
Composition [%] P-value Head Frame Viscera Boneless Fillet Total Offal Head + Frames Moisture < 0.0001 73.32 ± 0.51 c 76.75 ± 0.51 b 74.07 ± 1.45 c 82.67 ± 0.89 a 75.04 75.13
dry matter basis
Total ash <0.0001 41.97 ± 1.41 a 22.11 ± 1.69 c 32.52 ± 4.32 b 6.44 ± 0.25 d 31.57 31.48 Crude protein < 0.0001 50.25 ± 2.08 c 67.77 ± 8.73 b 55.58 ± 7.13 c 93.28 ± 1.69 a 59.17 59.51 Total fat 0.0261 5.08 ± 1.85 ab 4.97 ± 3.15 ab 11.88 ± 6.16 a 4.19 ± 0.82 b 5.62 5.02
SFA 0.0002 53.38 ± 5.04 ab 50.00 ± 6.99 bc 65.10 ± 6.16 a 41.00 ± 5.52 c 52.76 51.59 MUFA 0.8727 28.20 ± 5.87 29.00 ± 6.85 26.71 ± 7.12 25.25 ± 7.05 28.46 51.59 PUFA 0.0026 15.44 ± 6.67 ab 17.78 ± 9.23 ab 5.27± 4.74 b 30.02 ± 9.22 a 15.69 16.68 ω6 0.0029 6.07 ± 2.70 ab 7.42 ± 3.62 ab 2.22 ± 1.97 b 11.82 ± 3.55 a 6.39 6.78 ω3 0.0026 9.37 ± 4.00 ab 10.36 ± 5.62 ab 3.05 ± 2.78 b 18.20 ± 5.76 a 9.30 9.89 ω6/ω3 0.3460 0.64 ± 0.07 0.78 ± 0.11 0.80 ± 0.26 0.66 ± 0.07 0.72 0.71
One-way ANOVA performed for each nutrient parameter followed by a Tukey HSD test indicated significance and point of differentiation, respectively. Post-hoc descriptive lettering of ‘a’, ‘b’, ‘c’, or ‘d’ indicates decreasing parameter values, in that order. P-values were significant if < 0.05.
Table 4. Fatty Acid Composition of Fillet and Offal Components [mean ± 95% Cl] with Mass-Balanced Offal Recombination [calculated mean] for Our Ohio River Silver Carp Sample
Fatty Acids [%] P-value Head Frame Viscera Boneless Fillet Total Offal Head + Frames 14:0 0.0013 8.85 ± 2.31 ab 8.10 ± 2.86 ab 12.57 ± 2.13 a 4.38 ± 2.11 b 8.81 8.45 Suberic 0.0274 0.22 ± 0.10 ab 0.23 ± 0.12 ab 0.41 ± 0.14 a 0.13 ± 0.12 b 0.24 0.23 14:1ω5 0.0887 0.10 ± 0.07 0.10 ± 0.04 0.04 ± 0.06 0.16 ± 0.05 0.09 0.10 ISO 15:0 <0.0001 0.80 ± 0.12 ab 0.74 ± 0.25 b 1.13 ± 0.15 a 0.35 ± 0.17 c 0.80 0.77 AI 15:0 0.1889 0.36 ± 0.15 0.39 ± 0.10 0.43 ± 0.05 0.27 ± 0.09 0.38 0.38 15:0 0.0009 2.24 ± 0.48 ab 1.73 ± 0.48 bc 2.75 ± 0.51 a 1.18 ± 0.46 c 2.04 1.97 Azelate 0.4454 0.43 ± 0.29 0.55 ± 0.33 0.62 ± 0.21 0.31 ± 0.27 0.50 0.49 ISO 16:0 0.0687 0.20 ± 0.13 0.20 ± 0.05 0.30 ± 0.13 0.08± 0.09 0.21 0.20 16:0 0.0054 30.98 ± 3.53 ab 28.37 ± 5.07 ab 37.31 ± 5.75 a 23.85 ± 3.70 b 30.27 29.60 16:1ω9 0.0543 0.64 ± 0.21 0.43 ± 0.15 0.31 ± 0.15 0.32 ± 0.17 0.51 0.53 16:1ω7 0.0948 9.75 ± 2.46 9.05 ± 2.71 10.39 ± 1.68 6.09± 2.54 9.47 9.38 16:1ω5 0.3053 0.26 ± 0.12 0.53 ± 0.46 0.45 ± 0.34 0.14 ± 0.13 0.41 0.40 ISO 17:0 0.2072 0.78 ± 0.24 0.78 ± 0.31 0.94 ± 0.41 0.45 ± 0.26 0.79 0.78 AI 17:0 0.2177 0.13 ± 0.16 0.27 ± 0.03 0.26 ± 0.14 0.16 ± 0.11 0.21 0.20 Phytanic 0.6735 2.21 ± 0.70 2.23 ± 1.07 1.90 ± 1.03 3.01 ± 1.98 2.19 2.22 17:0 0.0200 1.28 ± 0.19 ab 1.13 ± 0.21 ab 1.62 ± 0.38 a 0.89 ± 0.36 b 1.24 1.20 18:0 0.7023 7.46 ± 1.81 7.73 ± 1.73 7.51 ± 2.11 8.79 ± 1.32 7.59 7.60 18:1ω9 0.6721 12.75 ± 3.12 13.65 ± 4.22 10.29 ± 4.83 13.10 ± 3.72 12.97 13.23 18:1ω7 0.6192 3.81 ± 0.21 4.08 ± 0.58 4.25 ± 0.87 4.47 ± 1.06 3.98 3.95 18:1ω5 0.9552 0.17 ± 0.27 0.10 ± 0.19 0.20 ± 0.41 0.14 ± 0.21 0.14 0.13 18:2ω6 0.0074 1.92 ± 0.50 ab 1.88 ± 0.65 ab 1.00 ± 0.24 b 2.31 ± 0.41 a 1.82 1.90 19:0 0.0641 0.11 ± 0.10 0.25 ± 0.11 0.11 ± 0.09 0.28 ± 0.13 0.18 0.18 18:3ω3 0.0384 2.35 ± 0.63 ab 2.20 ± 0.90 ab 1.18 ± 0.26 b 2.80 ± 0.92 a 2.18 2.27 18:4ω3 0.2073 0.50 ± 0.16 0.44 ± 0.30 0.19 ± 0.15 0.58 ± 0.36 0.44 0.47 20:0 0.5236 0.19 ± 0.13 0.30 ± 0.19 0.18 ± 0.16 0.32 ± 0.14 0.24 0.25 20:1ω9 0.7645 0.72 ± 0.44 1.07 ± 0.52 0.77 ± 0.58 0.83 ± 0.42 0.89 0.90 20:2ω6 0.0010 0.04 ± 0.09 bc 0.20 ± 0.14 ab tr c 0.29 ± 0.09 a 0.11 0.12 20:3ω6 0.0027 0.07 ± 0.09 ab 0.20 ± 0.10 a tr b 0.22 ± 0.10 a 0.13 0.14 20:4ω6 0.0059 2.68 ± 1.70 ab 3.24 ± 1.89 ab 0.74 ± 1.03 b 5.70 ± 1.99 a 2.78 2.98 ND 0.0097 0.13 ± 0.09 ab 0.22 ± 0.14 a tr b 0.28 ± 0.13 a 0.16 0.18 20:4ω3 0.0091 0.55 ± 0.16 ab 0.64 ± 0.34 ab 0.18 ± 0.24 b 0.93 ± 0.30 a 0.56 0.60 20:5ω3 0.0018 2.31 ± 1.40 b 2.87 ± 1.80 ab 0.61 ± 0.75 b 5.42 ± 1.64 a 2.43 2.61 22:4ω6 0.0896 0.20 ± 0.19 0.40 ± 0.24 0.16 ± 0.32 0.58 ± 0.19 0.29 0.31 22:5ω6 0.0032 1.15 ± 0.64 b 1.48 ± 0.85 ab 0.32 ± 0.52 b 2.71 ± 0.98 a 1.24 1.32 22:5ω3 0.0194 0.70 ± 0.42 ab 0.90 ± 0.64 ab 0.20 ± 0.49 b 1.53 ± 0.62 a 0.75 0.81 22:6ω3 0.0010 2.95 ± 1.55 b 3.31 ± 1.95 b 0.68 ± 1.06 b 6.93 ± 2.33 a 2.93 3.14
Table 5. Essential (EAA), Non-Essential (NEAA) Amino Acid, Macro Mineral, and Trace Mineral Profiles Analyzed by Component Type [mean ± 95% Cl] and Mass-Balanced Offal Recombination [calculated mean] for Our Ohio River Silver Carp Sample
Amino Acids [%] Head Frame Viscera Boneless Fillet Total Offal Head + Frame
Essential
Threonine 2.11 ± 0.21 c 2.84 ± 0.17 b 1.90 ± 0.27 c 3.68 ± 0.10 a 2.44 2.50 Valine 2.19 ± 0.25 c 2.90 ± 0.20 b 1.95 ± 0.26 c 4.44 ± 0.08 a 2.51 2.57 Methionine 1.33 ± 0.15 c 1.88 ± 0.11 b 1.02 ± 0.14 d 2.47 ± 0.06 a 1.57 1.62 Isoleucine 1.90 ± 0.25 c 2.55 ± 0.24 b 1.53 ± 0.17 c 4.28 ± 0.11 a 2.18 2.24 Leucine 3.14 ± 0.38 c 4.14 ± 0.37 b 2.39 ± 0.29 d 6.90 ± 0.15 a 3.56 3.67 Phenylalanine 1.96 ± 0.23 b 2.57 ± 0.15 b 1.73 ± 0.29 c 3.58 ± 0.10 a 2.23 2.28 Lysine 3.61 ± 0.45 c 5.04 ± 0.35 b 2.28 ± 0.38 d 8.03 ± 0.19 a 4.18 4.37 Histidine 0.94 ± 0.11 c 1.31 ± 0.15 b 0.65 ± 0.07 d 2.37 ± 0.09 a 1.09 1.14 Tryptophan 0.28 ± 0.03 c 0.50 ± 0.06 b 0.25 ± 0.03 c 1.05 ± 0.01 a 0.38 0.40
Non-Essential
Taurine 0.41 ± 0.07 b 0.38 ± 0.05 b 0.19 ± 0.01 c 0.63 ± 0.07 a 0.38 0.39 Hydroxyproline 3.07 ± 0.28 a 4.03 ± 0.97 a 3.04 ± 0.65 a 0.62 ± 0.11 b 3.53 3.58 Aspartic Acid 4.63 ± 0.49 c 6.22 ± 0.31 b 3.66 ± 0.50 d 8.29 ± 0.15 a 5.31 5.47 Serine 1.89 ± 0.14 c 2.40 ± 0.12 b 1.49 ± 0.21 d 2.72 ± 0.09 a 2.10 2.16 Glutamic Acid 7.37 ± 0.81 c 10.15 ± 0.58 b 5.58 ± 0.90 d 13.36 ± 0.43 a 8.56 8.84 Proline 5.07 ± 0.4 b 6.96 ± 1.36 a 4.89 ± 1.0 b 3.35 ± 0.10 b 5.97 6.07 Lanthionine np b tr b 0.07 ± 0.01 a tr b 0.01 0.01 Glycine 8.89 ± 0.74 b 12.21 ± 2.59 a 8.71 ± 1.74 b 4.77 ± 0.20 c 10.48 10.64 Alanine 4.72 ± 0.39 b 6.59 ± 0.91 a 4.40 ± 0.80 b 5.13 ± 0.11 b 5.59 5.71 Cysteine 0.38 ± 0.05 c 0.52 ± 0.03 b 0.37 ± 0.05 c 0.85 ± 0.02 a 0.45 0.45 Tyrosine 1.19 ± 0.14 b 1.40 ± 0.27 b 1.01 ± 0.14 b 2.72 ± 0.25 a 1.28 1.30 Hydroxylysine 0.42 ± 0.03 a 0.49 ± 0.11 a 0.43 ± 0.07 a 0.09 ± 0 b 0.45 0.46 Ornithine 0.10 ± 0.02 b 0.20 ± 0.03 a 0.12 ± 0.03 b 0.19 ± 0.02 a 0.15 0.15 Arginine 4.35 ± 0.39 b 6.02 ± 0.67 a 3.73 ± 0.72 b 5.44 ± 0.15 a 5.10 5.23
Minerals [%]
Sulfur 1.08 ± 0.03 a 0.72 ± 0.04 b 0.63 ± 0.06 c 0.43 ± 0.03 d 0.87 0.89 Phosphorous 1.15 ± 0.12 c 3.23 ± 0.84 b 0.44 ± 0.05 c 7.57 ± 0.57 a 2.09 2.25 Potassium 2.01 ± 0.09 a 0.85 ± 0.05 b 0.58 ± 0.04 c 0.35 ± 0.03 d 1.33 1.40 Magnesium 0.13 ± 0.01 c 0.16 ± 0.02 bc 0.18 ± 0.03 b 0.27 ± 0.02 a 0.15 0.15 Calcium 0.25 ± 0.28 c 6.18 ± 1.97 b 0.42 ± 0.12 c 16.17 ± 1.26 a 3.13 3.38 Sodium 0.38 ± 0.14 b 0.52 ± 0.09 b 0.90 ± 0.09 a 0.83 ± 0.06 a 0.49 0.45
[mg/100g]
Iron 9.64 ± 2.35 b 19.93 ± 7.88 b 1321.67 ± 146.97 a 9.37 ± 2.13 b 128.28 15.08 Manganese 0.71 ± 0.37 c 7.27 ± 1.38 bc 102.92 ± 11.16 a 14.04 ± 3.81 b 12.73 4.18 Copper 0.22 ± 0.06 b 0.36 ± 0.12 b 2.14 ± 0.16 a 0.28 ± 0.09 b 0.45 0.29 Zinc 2.79 ± 0.17 c 6.51 ± 0.63 b 9.04 ± 1.43 a 7.36 ± 1.09 ab 5.13 4.76 One-way ANOVA performed for each nutrient parameter followed by a Tukey HSD test indicated significance and point of differentiation, respectively. Post-hoc descriptive lettering of ‘a’, ‘b’, ‘c’, or ‘d’ indicates decreasing parameter values, in that order. P-values were significant if < 0.05. ‘np’ indicates a parameter not present; ‘tr’ refers to trace amounts.
Proximate and detailed nutrient parameters varied significantly across the recombined-four SVCP components (Table 3, Table 4, and Table 5). Moisture content was comparatively high in boneless fillets (82.7%) over offal components. The remaining nutrient parameters were calculated on a dry weight basis (lyophilized components). At nearly 42%, ash content was expectantly highest in heads, with the densest bone structure, but was also high in viscera. High-apparent inorganic content in the viscera was echoed by mineral component results which produced significant trace-mineral concentrations, particularly that of iron (Fe) (1321 ± 147 mg/100g), manganese (Mn) (103 ± 11 mg/100g), and copper (Cu) (2.14 ± 0.16 mg/100g) when compared with the other three components. In fact, visceral Fe composition averaged 66 times more concentrate than frames, the next highest proportionate Fe-yielding component. Visceral Mn and Cu concentrations averaged seven-fold that of the next highest component, fillets. Macro mineral
decrease across components with less somatic tissue but were found at moderate proportions even within viscera. Glutamic acid and glycine were proportionally high in all offal components. Frames were highest in glycine proportions (12.21 ± 2.59%) and second highest in glutamic acid (10.15 ± 0.15%). Frames and fillets were also moderately high in NEAA alanine and arginine. Recombined offal mass-balance calculations showed that the exclusion of viscera from head and frame components increased concentrations of all amino acids that had mentionable initial values.
Fillets produced the best proportions of preferred fatty acids but were leanest among all components. Although highly variable, total lipid (TL) content was at highest proportions in viscera (11.88 ± 6.16%) and deposited more consistently around 5% in both frames and heads, < 5% TL in fillets (Table 3). Saturated fatty acids (SFA) made up over 50% of all fat detected in total offal and over 40% in fillets. The sum of fatty acids 14:0, 16:0, and 18:1 comprised 50.6% of TL detected (Table 4). Unsaturated fatty acids (UFA) and SFA were found nearly 1:1 in heads and frames; meanwhile fillets averaged more concentrate levels of UFA than SFA. Polyunsaturated fatty acid (PUFA) levels in fillets averaged nearly twice that found in both heads and frames and six times the PUFA reported from viscera. Moreover, fillets averaged 18.20 ± 5.76 % omega-3 (ω3) fatty acids and 11.82 ± 3.55 % omega-6 (ω6) fatty acids. All components yielded higher percentages of ω3 than ω6 (ω6:ω3 < 1.0). Heads and fillets produced the lowest ω6:ω3 ratio compared to the other components. Excluding viscera from total offal substantially increased monounsaturated fatty acid (MUFA) levels but had little effect on SFA or PUFA. Docosahexaenoic acid (DHA, 22:6ω3) comprised on average nearly 7% fillet lipid, twice that of frames, the component with the second highest proportion of DHA (Table 4). Eicosapentaenoic acid (EPA, 20:5ω3) comprised on average nearly 5.5% fillet lipid, approximately twice that of heads and frames. Docosapentaenoic acid (DPA, 22:5) was found in higher ω6 forms than ω3 and was reported for both in the order of highest to lowest proportions: fillets, frames, heads, and viscera (Table 4).
4. Discussion
Characterizing component yields and chemical composition of SVCP fillets and offal components will help industry stakeholders (e.g. fishermen, processors, retail) tailor their operating procedures by providing a vantage point for a driving-market approach. [43]
Mobilizing nutritional benefits of both primary and by-products could generate additional/improved revenue streams and heighten consumer demand. In its infancy, a diversified stream of income could better support AC fisheries, leading to more consistent, demand-driven removal and utilization efforts of invasive SVCP, potentially other AC.
Assessing our sample’s body condition, relative to comparable studies, was important for understanding whether the biometrics and nutrient compositions reported here were based on a population generally reflective of
other SVCP populations. Given our post-spawn sample was in poorer relative condition than both the median Ws
and the 2016-2017 Ohio River WLR, it is important to consider whether spawning was the responsible factor behind body-condition differences. The period between the final spawn and mid-fall could afford mature SVCP the time needed to recover energy deposits lost through the spawning process(es) and return to expected positive-allometric weight-length relationships. Alternatively, river flows near the Cannelton pool were travelling twice the cubic feet per second (CFS) in June 2019 (228,521 CFS) compared to averages between June 2016 and 2017 (101,497 CFS) [59], posing a potential reduction in planktonic-forage availability and subsequent impacts on body condition. However, the spring months prior to the 2019 June flow report were within ± 50,000 CFS of June 2016-2017 records which suggests near normalcy. Given this, it is unlikely that high June turbidity in Ohio River tributaries occurred for an ample duration prior to sampling to induce capital-spawning, a phenomenon where starvation leads fish to catabolize energy deposits for gamete development. [60] While these findings suggest the biometric and nutrient data could reflect a normal post-spawn Ohio River SVCP population, we recommend future studies evaluate seasonality and other environmental factors for their effects on component yields and nutritional-component profiles. Findings could prove valuable to the AC fisheries that will presumably operate year-round.
Component yield results highlight the importance of utilizing offal from both sustainability and economic viewpoints. When summed, average head, frame, and viscera component yields accounted for 66% of total SVCP biomass (w/w). With trimmings added to offal and fluid loss accounted for, total offal biomass increased to an average of 82% w/w. When combined, both frames and trimmings comprised over 40% of average SVCP biomass and make good prospects for human-consumptive primary or by-products, given their considerable remnants of muscular tissue. Whole fillet yields (26% w/w) were lower than comparable literature references for silver and common carp (Cyprinus carpio) from a variety of countries and aquatic ecosystems. [61] Common carp fillet yields are reported from 27.7% [62] to 45.2% [63] and SVCP fillet yields range from 34.6% [45] to 52.7%. [64]
Unfortunately, sample sizes used to derive many of these results were often small (e.g. one to six fish) and body condition indices were largely undescribed. Therefore, chances are high that yields reported for both species are not representative of the true population’s average. Wild river or lake populations naturally tend to produce lower fillet yields [62] relative to cultured populations. [45] This general trend may partially explain the comparatively low fillet yields reported here. If unused or only utilized at low food recovery levels, the majority of SVCP biomass would fail to realize value potential nor its potential to address food insecurities. [37]
Edible yield is a variant term strongly affected by culture and circumstance and is rarely defined in literature.
For the purpose of this study, which places emphasis on the domestic U.S. market, edible yield can most appropriately be described as the tissue that can be reasonably (economically) removed from bones or processed in a way that renders bones undetectable to the consumer. Pertaining to the later description, fillet screen-presses, mechanical equipment used to extract boneless meat from fish fillets, have been used by to exclude y-bones present in AC. We acknowledge that the screen-press method, among other techniques, could expectedly report higher edible yields than those reported here, which were generated from manual filleting.
Skill and experience of the filleter can influence yield data, as was evident in this study. Filleters were trained to cut boneless fillet yields by removing the y-bones from fillets. As they gained experience, boneless fillet yield increased linearly from an average of 10% to 15% w/w. This correlation between fillet experience and yield efficiency is well documented for laborers in the fish-processing industry. [65] Though not significant, cumulative sample averages limited yields for boneless fillets (13.4% w/w) below the 15% w/w average yield determined from the final-ten SVCP processed. The maximum boneless fillet yield was reported at over 18% and could feasibly be attained or surpassed regularly by experienced processors for fish of similar or greater body condition. Innovations in manual or automated-fillet processing pose great potential for maximizing edible yield of AC. [65] However, regardless of 10% or 20% yield, boneless fillets represented a small fraction of SVCP biomass and would be facile, from a business operating standpoint, to garner all primary-product attention, especially considering low market values. [12]
Belly flaps represented mentionable volumes of boneless tissue (4.5% w/w) and were easily filleted dorso-ventrally from the upper ribs towards pectoral fins and collars. Extracting belly flaps supplemented edible yield by 33% on average, although this percentage is subject to change when SVCP body condition varies through seasons.
Several component yields were affected by carp length and gender. Viscera was the only component significantly affected by gender and likely resulted from dimorphic-energy allocation to gamete development between sexes. For example, male tilapia (Oreochromis niloticus) are commonly preferred in aquaculture because they allocate larger proportions of metabolic energy to growth, whereas female tilapia reallocate more energy to reproduction. [66]
On the contrary, since SVCP fillet and offal component yields were not affected by gender, it cannot be inferred that an increase in energy allocation to gametes by female SVCP sacrifices edible yield. Head yields diminished significantly in shorter SVCP (PSD-P) compared with PSD-M length SVCP. Shorter SVCP tended to reallocate this mass difference into components with high proportions of somatic tissues, such as fillets and trimmings. Shorter SVCP were in better average condition than longer SVCP and altogether, this indicates some degree of interaction between condition and length on component yields. For example, African carp (Labeo coubie) body condition was documented as having significant impacts on fillet yields. [67] Conservation strategies often aim to support dwindling gamefish populations by protecting older, longer fish because they
are frequently more fecund, thereby contributing more to the biomass of their reproductive stock. [68] Deductively, gamete development tends to be more taxing on somatic energy storages for more highly fecund individuals. Given that our sample was taken from a post-spawn population, this principle is a viable explanation for decreasing condition with increasing SVCP length. Somatic energy deposits (glycogen, cholesterol, protein in plasma, and adipose tissues) are utilized in preparation, maintenance, and recovery of spawning fish. [60,69] Therefore, fish allocating more stored energy for reproduction should reflect reductions in components with high-somatic-tissue proportions (fillet yields) and increases in components with less relative somatic-tissue proportions (head yields). As was observed in our sample, head yields are reasonably expected to decrease while fillet and trimming yields increase in better-conditioned SVCP populations. Future comparisons evaluating component yields across a wider spectrum of body conditions would shed light on this observed effect. Comparisons of WLRs from fall 2016/2017 Ohio River populations and the population wide Ws 50% median RLP provided by Lamer et al. [52]
(Figure 1), demonstrate that the majority of U.S. SVCP populations are in better condition than this sample. Therefore, yields reported here are likely near minimum for SVCP fillets and trimmings, near maximum for heads.
All proximate nutrient parameters, when mass is averaged across components, fell within reasonable ranges of those reported for whole SVCP by Bowzer et al. [28], with the exception of total lipids. At 5.42% lipid dry basis, our sample averaged nearly 4.5 times leaner than SVCP sampled during the Summer from the Illinois River [28]
and is likely a function of poor-relative body condition. In addition to low levels, total lipids and individual fatty acids were highly variable between the sample set. As such, no lipid trend was identified between SVCP in fair body condition (Wr > 80) or poor body condition (Wr < 80);
perhaps additionally because no carp’s body condition met the 50th median RLP set by the Ws reported in Lamer et al. [52] Neumann and Murphy [70] found that crappie (Pomoxis annularis) do not begin depositing somatic or visceral lipids until they reach a Wr threshold around the
mid 70s for a Ws set on a 75% RLP. Although our Wr
sample mean was 82, this was determined from a median 50th RLP. If a 75th RLP Ws existed for SVCP, this sample
would have likely averaged below the mid 70s Wr
threshold. Furthermore, it is likely that at the time of our sampling, most SVCP were catabolizing fatty acids and proteins to obtain the metabolic energy needed to survive and recover from the spawn. Additionally, population density increases and resulting forage competition cannot be ruled out for contributing to reduced total lipid. Moisture content was high (82.67%) in fillets and contributed to a reduced capacity for the storage of lipids as well as proteins and minerals. [71] Viscera contained low, often trace amounts of PUFA and high concentrations of SFA (especially 14:0 and 16:0) relative to the other components, indicating that SVCP had a higher affinity for depositing unsaturated fatty acids in tissues than SFA. This note is supported by Shul’man [72]
temperatures. Cumulative component PUFA as a % of total lipids averaged 17% in mass-balance calculations and was strongly influenced by fillets (30% PUFA). Revered fatty acids EPA and DHA comprised the majority of PUFA in all components; 18:3ω3 and 20:4ω6 were also found at considerable percentages of total PUFA concentrations. Heads and frames on average yielded healthy levels of PUFA. Omega-6:omega-3 ratios were reported at preferable levels (<1:1) in all components. [73]
As such, consuming SVCP fillets could be the source of a low-to-moderate fat fish with corrective ω6:ω3 nutritional potential. Although total lipid volumes in SVCP fillets (~132mg/100g fillet tissue) were quite low and similar to that reported in lean burbot (Lota lota) fillets [74], cumulative SVCP PUFA % of TL were higher than that reported in marine oils extracted from menhaden (Brevoortia tyrannus). [75] In seasons of peak SVCP body condition, such as fall is for many species [76,77], it would be interesting to see how lipid reserves change with respect to condition and if omega-3 or PUFA ratios remain consistent. Evaluating fillet and offal nutrient profiles as functions of seasonality and body condition could reveal when SVCP are healthiest as a food source. Furthermore, such a study would reveal when or if consuming SVCP can provide levels of PUFA routinely acquired from eating oily-marine fish.
Dietary proteins provide the building blocks for bioactive compounds such as enzymes that operate and coordinate nearly all metabolic pathways in the body. [78]
A balanced intake of EAA and NEAA is important to cell integrity. Deficiencies in EAA or exceedance in NEAA have been linked to reduced life spans in mouse trials. [79]
While boneless fillets yielded markedly high crude-protein composition (~93%), frames (including trimmings, skins, and bellies) represented the largest volume source of protein. Removing fillets from offal would significantly reduce protein levels of offal, potentially affecting its performance in feedstuffs. Exclusion of viscera from offal would offer slight improvements in crude protein and should be considered on a product-specific basis for its effect on amino acids of interest (Table 4). Moreover, viscera utilization should be considered because of concentrate levels of trace minerals not found in the other SVCP components. At an average of 1.3 g/100g dry basis, Fe levels were quite high and are expectantly sourced predominantly from the liver, spleen, and kidney. [80]
Visceral Mn concentrations were also high (mean = 103 mg/100g) relative to the other trace minerals (Cu and Zn) and were expectantly sourced predominantly from gills and gonads. [81] Exclusion or inclusion of viscera can dramatically affect the trace mineral profile of offal. Concerning AC consumption safety, SVCP are low-trophic filter feeders and are considered less prone to bioaccumulate toxins compared with fishes feeding at higher trophic levels. [82] As a result, SVCP should be one of the safer freshwater fish sourced from Midwestern rivers and lakes. Nevertheless, silver carp and bighead carp can accumulate pollutants and toxins in edible tissues when exposed to contaminated waters, especially with increasing age [82,83], and should be continually assessed across different river reaches and populations to better inform consumers of potential health risks.
Although all EAA were present in fillet and offal components, tryptophan and methionine were found in lowest concentrations and could be limiting in offal with the removal of fillets for consumptive markets. Lysine and leucine, commonly found at high concentrations in cold water and marine fish, respectively [84], were the highest by percentage amino acids reported in all SVCP components. Surprisingly, EAA profiles aligned more closely with marine fish than freshwater fish on several accounts. For example, lysine and leucine levels for two freshwater filter-feeding carp native to South Asia, Catla catla and Labeo rohita, were reported at dissimilar ratios to our SVCP, which more closely matched Sardinella longiceps, an oily baitfish from the Indian Ocean. [84]
NEAA concentrations of glycine and glutamic acid measured from our SVCP, however, were similar to the two aforementioned South Asian filter-feeding carp. As a functional property of considerable lysine and leucine levels, consuming SVCP could maintain or improve immune health and muscular synthesis, respectively. [84]
As a functional property of considerable glycine and glutamic acid levels, consuming SVCP could ensure proper transamination during amino acid metabolism and “metabolic regulation, preventing tissue injury, enhancing anti-antioxidant activity, promoting protein synthesis and wound healing, and improving immunity and treatment of metabolic disorders in obesity, diabetes, cardiovascular disease, ischemia-reperfusion injuries, cancer, and various inflammatory diseases.” [85] Assuming nutrient proportions remain consistent, any increase in a cumulative nutrient value (crude protein, total lipid, ash deposits) will increase ingestion of the respective nutrient parameters reported in this study and bolster the bioactive functioning capacity of the nutrient compounds.
consumer concerns, galvanizing the driving-market approach to increase demand and subsequent removal of invasive carp. Considering the breadth of their expansion and abundance in U.S. waterways, our findings suggest SVCP fillets and by-products have high potential to supplement domestic fish supply and enrich the nourishment of U.S. consumers who generally suffer from unhealthy tendencies in their protein and lipid intake.
5. Conclusions
Invasive AC of the U.S. are among the highest-threating invasive species due to the severity of risks they pose on native-aquatic ecosystems and those dependent on them for resources. This study sought to strengthen the economic stability of commercial AC fisheries, charged with mitigating the AC invasion, by producing industry-relevant data that characterizes the most abundant AC and SVCP. Characterizing biometric yields and nutrient compositions of SVCP components informs and incentivizes emerging AC industries to strategize and make better use of SVCP whose capture is mostly unused or recovered only partially in terms of biomass or end-use potential. Locating supplemental-revenue streams would add resiliency to the commercial AC fishing economy, a major limitation to the success of AC control. Equally important, improving utilization of all viable SVCP components makes better use of an abundant and valuable food source for nearby regions suffering from food insecurities or malnutrition. Our findings suggest the edible yield of SVCP is relatively low, especially following summer spawning(s); thus biomass-dominating offal components demand heightened attention from processors and product developers. More research should be conducted characterizing seasonal effects on fillet and offal-components since findings could impact the timing of removal strategies. SVCP fillets, like many moderate-fatty fish, are great sources of health-revered fatty acids and as such, offer corrective potential for the well-documented imbalance in omega-6:omega-3 of American diets. While, SVCP are also highly nutritious sources for essential and non-essential amino acids and minerals needed for healthy bodily function, continued monitoring of somatic tissue contaminants is crucial to inform reliant consumers on healthy volumes of intake. All considered, the information provided here should be used to increase domestic supply, demand, and subsequent removal of SVCP.
Acknowledgements
Virginia Tech’s Water INTERface Interdisciplinary Graduate Education Programs, College of Agriculture and Life Sciences, and College of Natural Resources and Environment partially supported this study. Special recognition goes out to the Kentucky Department of Fish and Wildlife Resources, Indiana Department of Natural Resources, Missouri State’s Hae Kim and Ethan Rutledge, Virginia Tech’s Jordan Wicks, Dr. Hengjian Wang, and Roman Rustia for their unconditional assistance with this study.
Conflicts of Interest
There are no conflicts of interest to report.
Availability of Data and Material
Raw data have been uploaded to Virginia Tech’s VTechData data repository and are available upon request to the corresponding author (https://data.lib.vt.edu/). Such data will be made publicly available once the article has been accepted for publication.
References
[1] Fuller, P.L., Nico, L.G., Williams, J.D., “Nonindigenous fishes introduced into inland waters of the United States”,
American Fisheries Society, Special Publication 27, Bethesda, MD. 1999.
[2] Kolar, C.S., Chapman, D.C., Courtenay, Jr. W.R., Housel, C.M., Williams, J.D., Jennings, D.P., “Bighead carps- a biological synopsis and environmental risk assessment”, American Fisheries Society. Special Publication 33. Bethesda, MD. August 2007.
[3] Fagan, B., Fishing: How the sea fed civilization, Yale University Press, London, UK, 2017.
[4] FAO, “The state of the world fisheries and aquaculture 2018-meeting the sustainable development goals”, The United Nations, Rome, Italy. 2018. [Online]. Available:
http://www.fao.org/documents/card/en/c/I9540EN/.
[5] Freeze, M., Henderson, S., “Distribution and status of bighead carp and silver carp in Arkansas”, North American Journal of Fisheries Management, 2(2): 197-200. April 1982.
[6] Shelton, W.L., Smitherman, R.O., Exotic fishes in warm-water aquaculture, Distribution, biology, and management of exotic fishes. The Johns Hopkins University Press, Baltimore, MD, 1984. 262-301.
[7] Koel, T.M., Irons, K.S., Ratcliff, E., “Asian carp invasion of the upper Mississippi River system”, USGS, La Crosse, Wisconsin, November 2000. [Online]. Available:
https://www.umesc.usgs.gov/reports_publications/psrs/psr_2000_ 05.html.
[8] Williamson, C.J., Garvey, J.E., “Growth, fecundity, and diets of newly established silver carp in the middle Mississippi River”,
Transactions of the American Fisheries Society, 134(6). 1423-1430. November 2005.
[9] Chick, J.H., Gibson-Reinemer, D.K., Soeken-Gittinger, L., Casper, A.F., “Invasive silver carp is empirically linked to declines of native sport fish in the upper Mississippi river system”, Biological Invasions, 22. 723-734. November 2019.
[10] Zhang et al., “Forecasting the impacts of silver and bighead carp on the Lake Erie food web”, Transactions of the American Fisheries Society, 145(1). 136-162. January 2016.
[11] Irons, K.S., Sass, G.G., McClelland, M.A., Stafford, J.D., “Reduced condition factor of two native fish species coincident with invasion of non-native Asian carps in the Illinois River, U.S.A. Is this evidence for competition and reduced fitness?”,
Journal of Fish Biology, 71.258-273. 2007.
[12] ACRCC, “Asian carp action plan for fiscal year 2020”. 2020. [Online]. Available: http://www.asiancarp.us/Documents/2020-Action-Plan.pdf.
[13] Conover, G., Simmonds, R., Whalen, M. (ed), “Management and control plan for bighead, black, grass, and silver carps in the United States”, Asian Carp Working Group, Aquatic Nuisance Species Task Force, Washington, D.C. November 2007. [Online]. Available:
https://www.anstaskforce.gov/Documents/Carps_Management_Pl an.pdf.
[14] Charlebois, P., Parks, S., TePas, K., Peterson, M., “Asian carp marketing summit”, Lewis and Clark Community College, Grafton, Illinois. September 2010. [Online]. Available:

![Table 3. Nutrient Proximates and Fatty Acid Compositional Summary of Fillet and Offal Components [mean ± 95% Cl] with Mass-Balance Offal Recombination [calculated mean] for Our Ohio River Silver Carp Sample](https://thumb-us.123doks.com/thumbv2/123dok_us/877091.2081369/7.595.60.550.313.735/nutrient-proximates-compositional-summary-components-balance-recombination-calculated.webp)
![Table 5. Essential (EAA), Non-Essential (NEAA) Amino Acid, Macro Mineral, and Trace Mineral Profiles Analyzed by Component Type [mean ± 95% Cl] and Mass-Balanced Offal Recombination [calculated mean] for Our Ohio River Silver Carp Sample](https://thumb-us.123doks.com/thumbv2/123dok_us/877091.2081369/8.595.52.551.87.527/essential-essential-profiles-analyzed-component-balanced-recombination-calculated.webp)
