ARTIGO ORIGINAL
ABSTRACT
Introduction: The association between multimorbidity and disease severity is not well established. The objectives were to characterise multimorbidity and determine disease severity (trough Charlson), as well as to verify if there is an association between the number and type of disease and the Charlson index.
Material and Methods: A cross-sectional study based on exported data from the Portuguese National Health Service hospitalisations database, during the year 2015. The study included 22 chronic health conditions: 15 predicted in the Charlson index and seven frequent conditions (hypertension, obesity, dyslipidaemia, osteoarthritis, osteoporosis, anxiety and depression). The analysis was performed through the generalised linear model, considering binary logistic regression. In the analysis, the IBM SPSS version 24.0 tool was used.
Results: The study analysed 800 376 hospitalisations, from which 42% correspond to males. The average age of the sample was 59.8 years, being higher in men (62.3 years). The mean number of problems per person was 1.6, greater in men (1.8). Disease severity was also higher in males. The worst prognosis was associated with six or more conditions per person. The largest predictor of disease severity was the number of problems, followed by dementia and diabetes.
Discussion: The results seem to confirm the gender difference regarding morbidity pattern. The number of conditions per person was the greatest predictor of disease severity, particularly the presence of six or more conditions per person.
Conclusion: The major limitation was the use of the same medical conditions to measure multimorbidity and disease severity. Other studies and analysis models should explore the complexity of the multimorbidity phenomenon.
Keywords: Comorbidity; Multimorbidity; Portugal; Severity of Illness Index RESUMO
Introdução: A associação entre multimorbilidade e gravidade da doença não está bem estabelecida. Os objetivos foram caracterizar a multimorbilidade e determinar a gravidade da doença, bem como verificar se existe associação entre o número e natureza dos diag-nósticos e o índice de Charlson.
Material e Métodos: Estudo transversal realizado através de dados exportados da base de dados de internamentos, durante o ano de 2015. O estudo incluiu 22 doenças crónicas: 15 previstas no índice de Charlson e sete condições médicas frequentes (hipertensão, obesidade, dislipidemia, osteoartrose, osteoporose, ansiedade e depressão). A análise foi realizada através do modelo linear genera-lizado, regressão logística binária. Na análise, utilizou-se a ferramenta IBM SPSS versão 24.0.
Resultados: Foram analisadas 800 376 hospitalizações, das quais 42% correspondem a homens. A idade média da amostra foi de 59,8 anos, sendo maior nos homens (62,3 anos). O número médio de problemas por pessoa foi de 1,6, sendo superior nos homens (1,8). A gravidade da doença também foi maior nos homens. O pior prognóstico esteve associado a seis ou mais condições por pes-soa. O maior preditor de gravidade da doença foi o número de problemas, seguido da demência e diabetes.
Discussão: Os resultados parecem confirmar a diferença entre sexos quanto ao padrão de morbilidade. O número de condições por pessoa foi o maior preditor de gravidade da doença, particularmente a presença de seis ou mais condições por pessoa.
Conclusão: A principal limitação identificada foi o uso das mesmas condições médicas para medir a multimorbilidade e a gravidade da doença. Outros estudos e modelos de análise devem explorar a complexidade do fenómeno da multimorbilidade.
Palavras-chave: Comorbilidade; Índice de Gravidade de Doença; Multimorbilidade; Portugal
Multimorbidity and Disease Severity Measured by the
Charlson Index in Portuguese Hospitalised Patients
During the Year 2015: A Cross-Sectional Study
Multimorbilidade e Gravidade da Doença Medida pelo
Índice de Charlson em Doentes Hospitalizados Durante o
Ano de 2015: Estudo Transversal
1. Unidade de Cuidados de Saúde Primários dos Olivais. Agrupamento de Centros de Saúde de Lisboa Central. Lisboa. Portugal. 2. Departamento de Medicina Geral e Familiar. Faculdade de Medicina. Universidade de Lisboa. Lisboa. Portugal.
3. Departamento de Saúde Ambiental. Faculdade de Medicina. Universidade de Lisboa. Lisboa. Portugal. 4. Laboratório de Biomatemática. Faculdade de Medicina. Universidade de Lisboa. Lisboa. Portugal.
5. Departamento de Saúde Pública. Escola Nacional de Saúde Pública. Universidade NOVA de Lisboa. Lisboa. Portugal.
Autor correspondente: Paula Broeiro-Gonçalves. [email protected]
Recebido: 25 de setembro de 2017 - Aceite: 01 de outubro de 2018 | Copyright © Ordem dos Médicos 2019
Paula BROEIRO-GONÇALVES1,2, Paulo NOGUEIRA3,4, Pedro AGUIAR5
Acta Med Port 2019 Jan;32(1):38-46 ▪ https://doi.org/10.20344/amp.9728
INTRODUCTION
Multimorbidity and comorbidity refer to the ‘co-occur-rence of two or more medical conditions within a patient, ad-ditional to an index disease’.1 Those defending the concept of multimorbidity tend to focus their attention on primary healthcare in which the identification of an index disorder may not always become obvious or useful.1-4
ARTIGO ORIGINAL the list of candidate conditions, ranging from 43.7% [(two or
more conditions (MM2+)], 27.4% (MM3+), 14.7% (MM4+), 6.7% (MM5+) to 2.8% [six or more conditions (MM6+)].9 The fact that the estimated prevalence of multimorbidity is affected by the length of the list of candidate conditions is worth mentioning4,6 as, for instance, when four to seven conditions were considered, an underestimated prevalence has been found, while a lower variability has been found when 12 or more conditions were used.6 In addition, a low number of conditions (five) has led to a lower prevalence of multimorbidity (0.3% at the age of 32.5 and 3.5% at the age of 75), regardless of the sample size.6
In a Portuguese study, carried out in primary healthcare settings and involving adult population, nine out of 10 par-ticipants (87.0%) presented with at least one chronic con-dition, with a general average of 3.4 (3.6 in male, 3.3 in female patients).11 Multimorbidity measured as MM2+ was presented by 72.7% of the patients, while a 57.2% rate was found when MM3+ was used.11 A significant association (p < 0.05) has been found between multimorbidity and male gender, patient’s age, living in rural areas, living alone, low-er socioeconomic status (education and income),11 in line with other studies showing an association between multi-morbidity and poorer socioeconomic status.11-13
Interchangeability between both concepts has currently been found, even though the Charlson index is still used due to the fact that it gives a sense of severity to comorbid-ity alongside an index condition, defining the total burden of conditions with an impact on the patient.1
Different indices have been developed based on the number and severity of illness, leading to an aggregate score. Multimorbidity scores have been used in monitoring and in comparisons between groups of patients or health-care providers.14 The Charlson index was developed based on the relative risk of mortality and is used for the measure-ment of severity/intensity of illness, by using comorbidities with different impact on patient’s outcome (e.g., weighting of six for metastatic solid tumour, two for diabetes with com-plications).15,16 The Charlson index allows for the assess-ment of comorbidity (for instance, a score of three of more corresponds to severe comorbidity) and mortality predic-tion (e.g., score of five or more is predictive of death within three years, in 85% of the patients).15 Good discrimination of short and long-term survival, predicting mortality with a high discriminant power has been found with the use of the Charlson index, both in primary and in secondary health-care.1718,19 With the advances in medicine and an increasing survival rate, conditions such as coronary artery disease, diabetes with no complications or cerebrovascular disease were not associated with mortality leading their weighting within the Charlson index to be questioned.16 Nevertheless, it remains as a tool for the measurement of severity of ill-ness, useful in the outcome assessment.16,20
The Charlson index has been widely used in studies of outcome assessment as it allows for valid comparisons and risk adjustment.21,22 Risk adjustment is a complex construct involving patient’s socio-demographic factors (patient’s
age, for instance), clinical stability or comorbidity severity and was developed as an indicator of the severity of ill-ness.13,22 An increasing interest has been found on the use of databases for morbidity assessment and the Charlson index applied to administrative data classified according to the ICD-9 system.21-23 The Charlson index has been used for the assessment of the severity of illness in different epidemiological studies.14,18-19,24 Administrative databases are used in epidemiological research in order to provide for supplementary information to primary studies as these correspond to real-life data, representing large groups of patients, with no selection bias.21
Considering the validity of the Charlson index as an outcome instrument for the assessment of the severity of illness,20 the knowledge on whether or not an association between multimorbidity and severity of illness is crucial, considering conditions and age groups.
This study was aimed at the characterisation of multi-morbidity in hospitalised patients admitted to public hospi-tals and the assessment of the severity of illness throughout the transition from early to late adulthood with the use of the Charlson index, as well as analysing any association between the index and the length of the list of candidate conditions and their nature.
MATERIAL AND METHODS
This was a cross-sectional and descriptive study with an analytical component of data exported from the Portuguese national clinical Grupos de Diagnósticos Homogéneos (GDH) database.
The GDH database is a classification system of patients admitted to acute care hospitals according to clinically co-herent groups of patients and with similar resource con-sumption profiles. These allow for the operative definition of which hospital products are provided to each patient ac-cording to patient’s demands and the patient’s pathology in which admission was based on, corresponding to the iden-tification of conditions by hospital admission episode and by patient.
Only adult patients (aged 18 or over) admitted at least once to a public hospital throughout 2015 were included as study population.
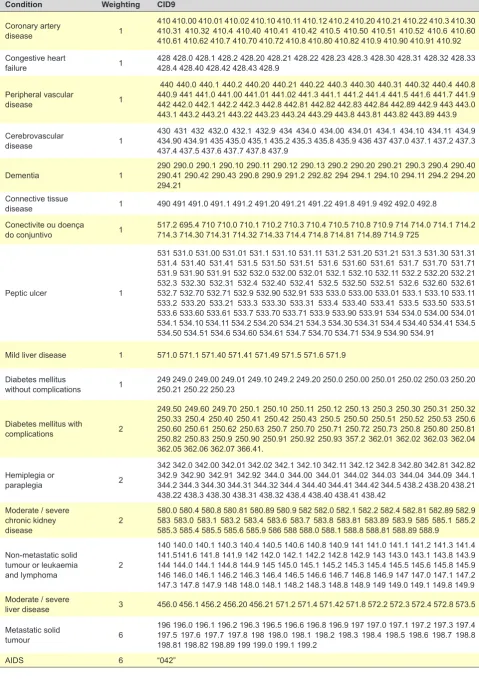
ARTIGO ORIGINAL Table 1Condition – Conditions and ICD-9 coding correspondenceWeighting CID9
Coronary artery
disease 1
410 410.00 410.01 410.02 410.10 410.11 410.12 410.2 410.20 410.21 410.22 410.3 410.30 410.31 410.32 410.4 410.40 410.41 410.42 410.5 410.50 410.51 410.52 410.6 410.60 410.61 410.62 410.7 410.70 410.72 410.8 410.80 410.82 410.9 410.90 410.91 410.92 Congestive heart
failure 1 428 428.0 428.1 428.2 428.20 428.21 428.22 428.23 428.3 428.30 428.31 428.32 428.33 428.4 428.40 428.42 428.43 428.9
Peripheral vascular
disease 1
440 440.0 440.1 440.2 440.20 440.21 440.22 440.3 440.30 440.31 440.32 440.4 440.8 440.9 441 441.0 441.00 441.01 441.02 441.3 441.1 441.2 441.4 441.5 441.6 441.7 441.9 442 442.0 442.1 442.2 442.3 442.8 442.81 442.82 442.83 442.84 442.89 442.9 443 443.0 443.1 443.2 443.21 443.22 443.23 443.24 443.29 443.8 443.81 443.82 443.89 443.9
Cerebrovascular
disease 1
430 431 432 432.0 432.1 432.9 434 434.0 434.00 434.01 434.1 434.10 434.11 434.9 434.90 434.91 435 435.0 435.1 435.2 435.3 435.8 435.9 436 437 437.0 437.1 437.2 437.3 437.4 437.5 437.6 437.7 437.8 437.9
Dementia 1 290 290.0 290.1 290.10 290.11 290.12 290.13 290.2 290.20 290.21 290.3 290.4 290.40 290.41 290.42 290.43 290.8 290.9 291.2 292.82 294 294.1 294.10 294.11 294.2 294.20 294.21
Connective tissue
disease 1 490 491 491.0 491.1 491.2 491.20 491.21 491.22 491.8 491.9 492 492.0 492.8 Conectivite ou doença
do conjuntivo 1 517.2 695.4 710 710.0 710.1 710.2 710.3 710.4 710.5 710.8 710.9 714 714.0 714.1 714.2 714.3 714.30 714.31 714.32 714.33 714.4 714.8 714.81 714.89 714.9 725
Peptic ulcer 1
531 531.0 531.00 531.01 531.1 531.10 531.11 531.2 531.20 531.21 531.3 531.30 531.31 531.4 531.40 531.41 531.5 531.50 531.51 531.6 531.60 531.61 531.7 531.70 531.71 531.9 531.90 531.91 532 532.0 532.00 532.01 532.1 532.10 532.11 532.2 532.20 532.21 532.3 532.30 532.31 532.4 532.40 532.41 532.5 532.50 532.51 532.6 532.60 532.61 532.7 532.70 532.71 532.9 532.90 532.91 533 533.0 533.00 533.01 533.1 533.10 533.11 533.2 533.20 533.21 533.3 533.30 533.31 533.4 533.40 533.41 533.5 533.50 533.51 533.6 533.60 533.61 533.7 533.70 533.71 533.9 533.90 533.91 534 534.0 534.00 534.01 534.1 534.10 534.11 534.2 534.20 534.21 534.3 534.30 534.31 534.4 534.40 534.41 534.5 534.50 534.51 534.6 534.60 534.61 534.7 534.70 534.71 534.9 534.90 534.91
Mild liver disease 1 571.0 571.1 571.40 571.41 571.49 571.5 571.6 571.9
Diabetes mellitus
without complications 1 249 249.0 249.00 249.01 249.10 249.2 249.20 250.0 250.00 250.01 250.02 250.03 250.20 250.21 250.22 250.23
Diabetes mellitus with
complications 2
249.50 249.60 249.70 250.1 250.10 250.11 250.12 250.13 250.3 250.30 250.31 250.32 250.33 250.4 250.40 250.41 250.42 250.43 250.5 250.50 250.51 250.52 250.53 250.6 250.60 250.61 250.62 250.63 250.7 250.70 250.71 250.72 250.73 250.8 250.80 250.81 250.82 250.83 250.9 250.90 250.91 250.92 250.93 357.2 362.01 362.02 362.03 362.04 362.05 362.06 362.07 366.41.
Hemiplegia or
paraplegia 2
342 342.0 342.00 342.01 342.02 342.1 342.10 342.11 342.12 342.8 342.80 342.81 342.82 342.9 342.90 342.91 342.92 344.0 344.00 344.01 344.02 344.03 344.04 344.09 344.1 344.2 344.3 344.30 344.31 344.32 344.4 344.40 344.41 344.42 344.5 438.2 438.20 438.21 438.22 438.3 438.30 438.31 438.32 438.4 438.40 438.41 438.42
Moderate / severe chronic kidney
disease 2
580.0 580.4 580.8 580.81 580.89 580.9 582 582.0 582.1 582.2 582.4 582.81 582.89 582.9 583 583.0 583.1 583.2 583.4 583.6 583.7 583.8 583.81 583.89 583.9 585 585.1 585.2 585.3 585.4 585.5 585.6 585.9 586 588 588.0 588.1 588.8 588.81 588.89 588.9
Non-metastatic solid tumour or leukaemia
and lymphoma 2
140 140.0 140.1 140.3 140.4 140.5 140.6 140.8 140.9 141 141.0 141.1 141.2 141.3 141.4 141.5141.6 141.8 141.9 142 142.0 142.1 142.2 142.8 142.9 143 143.0 143.1 143.8 143.9 144 144.0 144.1 144.8 144.9 145 145.0 145.1 145.2 145.3 145.4 145.5 145.6 145.8 145.9 146 146.0 146.1 146.2 146.3 146.4 146.5 146.6 146.7 146.8 146.9 147 147.0 147.1 147.2 147.3 147.8 147.9 148 148.0 148.1 148.2 148.3 148.8 148.9 149 149.0 149.1 149.8 149.9 Moderate / severe
liver disease 3 456.0 456.1 456.2 456.20 456.21 571.2 571.4 571.42 571.8 572.2 572.3 572.4 572.8 573.5 Metastatic solid
tumour 6
196 196.0 196.1 196.2 196.3 196.5 196.6 196.8 196.9 197 197.0 197.1 197.2 197.3 197.4 197.5 197.6 197.7 197.8 198 198.0 198.1 198.2 198.3 198.4 198.5 198.6 198.7 198.8 198.81 198.82 198.89 199 199.0 199.1 199.2
ARTIGO ORIGINAL Upon the definition of each patient’s conditions, the ICD-9
(International Classification of Diseases, 9th version – used in the GDH database) codes were obtained (Table 1). Social and demographic data (patient’s age and gender) were obtained for each admission episode corresponding to hospital admissions during 2015, in addition to the 22 condi-tions classified according to the ICD-9 system (Table 1). Data were exported to Excel and subsequently to SPSS, version 24.0 IBM software for Mac OS.
The paediatric population (ages 0-17) was removed from exported data and, considering that each patient could have been admitted to hospital more than once per year, duplicate entries regarding the adult population (aged 18 or over) have been also removed and only the most recent admission episode has been considered for each patient. The 22 conditions were dichotomised and the value of 1 corresponded to the presence and 0 to the absence of each condition. The number of conditions within a patient cor-responded to the sum of the medical conditions that were presented by each patient. Multimorbidity was determined according to the settings of the coexistence of two or more conditions (MM2+) up to eight or more (MM8+).
An overall index score was obtained, considering the weight assigned to conditions within the scale (Table 1). This index was adjusted to patient’s age, through the fol-lowing weighting: 1 for the 40-49 age group; 2 for the 50-59; 3 for the 60-69 and 4 for the 70+ age group.
Patient’s age, the number of conditions within a patient and Charlson index were taken into consideration in the descriptive analysis as numerical variables and these were categorised in order to make the analysis easier:
1. Age groups: early adulthood [18-39], middle adulthood [40-54], pre-retirement adulthood [55-64], third age [65-74], fourth age [75-84] and fifth age [85 +].
2. Total number of conditions within a patient: according to the definition of multimorbidity, two or more (MM2+) up to eight or more (MM8+).
3. Charlson index per severity of illness: age-adjusted off point 0 to < 5; 5 to < 9; ≥ 9] or non-age-adjusted [cut-off point < 5; ≥ 5].
Due to the binary nature of variables, the analysis was carried out by using a generalised linear model (GLM) with binary logistic regression.
Bivariate analysis was obtained for each condition and for each definition of multimorbidity, as dependent vari-ables.
Ethical requirements
The GDH database, provided with encrypted personal identification data, is provided to the students of the ENSP (Escola Nacional de Saúde Pública) upon application for superior authorisation and non-disclosure agreement. The study was approved by the Ethics Committee of the Administração Regional de Saúde de Lisboa e Vale do Tejo.
RESULTS
A total of 1,026,317 hospital admission episodes were exported from the GDH database, 136,574 of which cor-responded to paediatric patients. Duplicate episodes were removed according to the methodology and only the most recent admission episode has been considered for each patient; upon removal of 10% of the episodes, a total of 800,376 episodes involving adult patients were considered [58% involving female patients – 463,978; mean age of 59.8 years, higher in male (62.3 years) than female patients (57.9 years)].
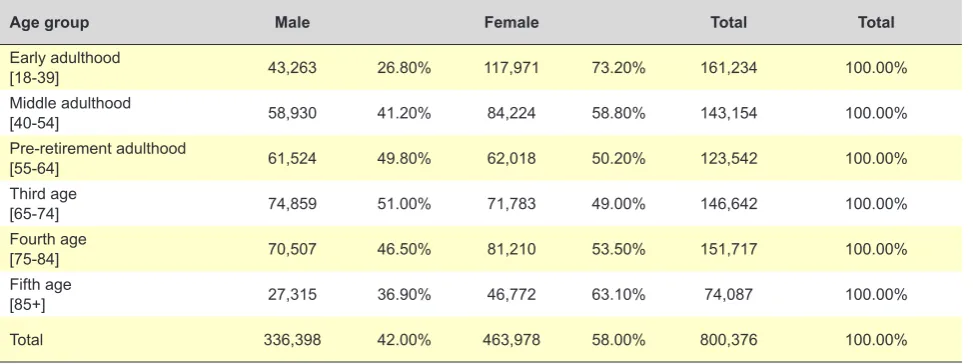
Data distribution per age group and gender is shown in Table 2 (patients admitted to a public hospital at least once in 2015).
A female predominance has been found in all age groups, except in the 65-74 (51% male patients).
A 1.6 average number of conditions per patient have been found (1.8 in male and 1.44 in female patients). A higher disease severity obtained with the Charlson index was also found in male patients (1.11) compared to 0.74 in female patients and 0.90 in the study sample. A decline in all age groups of the frequency of multimorbidity for dif-ferent settings [two (MM2+) to eight conditions (MM8+) within a patient] has been found as progressing from MM2+ to MM8+: 41.9% (MM2+), 28.0% (MM3+), 18.4% (MM4+),
Table 2 – Age group and gender
Age group Male Female Total Total
Early adulthood
[18-39] 43,263 26.80% 117,971 73.20% 161,234 100.00%
Middle adulthood
[40-54] 58,930 41.20% 84,224 58.80% 143,154 100.00%
Pre-retirement adulthood
[55-64] 61,524 49.80% 62,018 50.20% 123,542 100.00%
Third age
[65-74] 74,859 51.00% 71,783 49.00% 146,642 100.00%
Fourth age
[75-84] 70,507 46.50% 81,210 53.50% 151,717 100.00%
Fifth age
[85+] 27,315 36.90% 46,772 63.10% 74,087 100.00%
ARTIGO ORIGINAL 12.4% (MM5+), 8.8% (MM6+), 5.0% (MM7+) and 3.1% (MM8+). No statistically significant association between multi-morbidity and patient’s age or severity of illness (Charlson index) has been found. An increasing average number of conditions and Charlson index values have been found up to the 85-89 age group. A decline in both multimorbidity measures was found from the age 90 onwards.
Considering that the frequency of medical conditions is based on the list of conditions considered within the meth-odology and those found in literature as most frequent, their association with patient’s gender was analysed, adjusted to patient’s age.
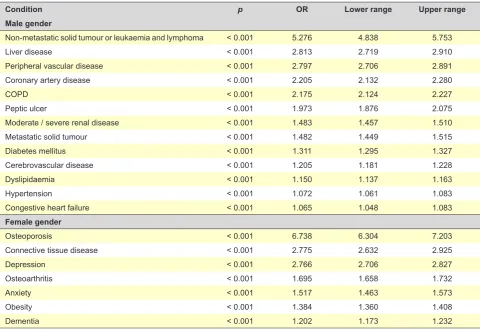
Conditions associated with patient’s gender in age-ad-justed bivariate analysis are shown in Table 3 by descend-ing order of odds ratio (OR). Non-metastatic solid tumour or leukaemia and lymphoma, liver disease and peripheral vascular disease stood out in male patients, while osteopo-rosis, connective tissue disease and depression stood out in female patients.
Anxiety (OR 2.016) and depression (OR 3.972) were as-sociated (p < 0.001) with younger age (45-64 age group), while congestive heart failure (OR 223.701), moderate/ severe chronic kidney disease (OR 44.240) and dementia (OR 1,864.620) were associated with older ages (95+ age group), with the same significance level (p < 0.001). Liver disease (OR 9.929) and metastatic cancer (OR 12.629) showed an association with middle age groups (55-64).
Hy-pertension and coronary artery disease were considered as having an increasing OR from the age of 65 onwards. The lowest number of conditions associated with the risk of mor-tality (OR > 1) was found in the youngest age groups (up to the age of 45).
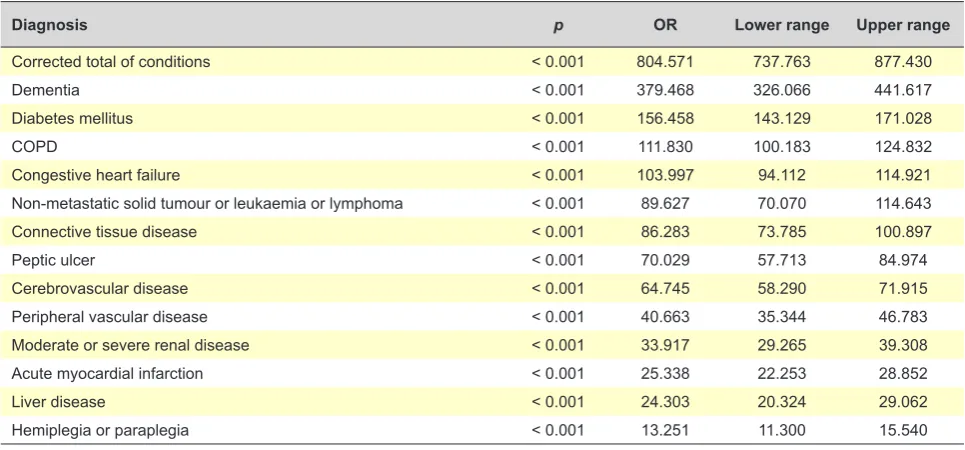
Multivariate analysis of conditions associated with se-verity of illness (Charlson ≥ 5) as dependent variables has been carried out. All conditions were adjusted to patient’s gender, age and number of conditions within a patient and, as shown in Table 4, the number of conditions within a pa-tient was the highest predictor of severity of illness followed by dementia, diabetes mellitus, COPD and congestive heart failure, by descending order of the value of OR. A protec-tive effect of female gender [p < 0.001; OR 0.807 (0.773: 0.842)] while a risk effect of patient’s age were suggested [p < 0.001; OR 1.713 (1.703: 1.724)].
Conditions that were included due to their frequency and that were not included as candidate conditions in the Charlson index were not associated with severity of illness (Charlson ≥ 5). Nevertheless, a significant association with the overall index score (p < 0.001) (OR close to 0) with an apparent protective effect was found with conditions that were not included as candidate conditions within the Charl-son scale (osteoarthritis, osteoporosis, anxiety, depression, hypertension, dyslipidaemia and obesity).
Bivariate analysis has been carried out, in order to as-sess the association between multimorbidity and severity of illness scores (Charlson index) through the GLM model.
Table 3 – Conditions associated with patient’s gender
Condition p OR Lower range Upper range
Male gender
Non-metastatic solid tumour or leukaemia and lymphoma < 0.001 5.276 4.838 5.753
Liver disease < 0.001 2.813 2.719 2.910
Peripheral vascular disease < 0.001 2.797 2.706 2.891
Coronary artery disease < 0.001 2.205 2.132 2.280
COPD < 0.001 2.175 2.124 2.227
Peptic ulcer < 0.001 1.973 1.876 2.075
Moderate / severe renal disease < 0.001 1.483 1.457 1.510
Metastatic solid tumour < 0.001 1.482 1.449 1.515
Diabetes mellitus < 0.001 1.311 1.295 1.327
Cerebrovascular disease < 0.001 1.205 1.181 1.228
Dyslipidaemia < 0.001 1.150 1.137 1.163
Hypertension < 0.001 1.072 1.061 1.083
Congestive heart failure < 0.001 1.065 1.048 1.083
Female gender
Osteoporosis < 0.001 6.738 6.304 7.203
Connective tissue disease < 0.001 2.775 2.632 2.925
Depression < 0.001 2.766 2.706 2.827
Osteoarthritis < 0.001 1.695 1.658 1.732
Anxiety < 0.001 1.517 1.463 1.573
Obesity < 0.001 1.384 1.360 1.408
ARTIGO ORIGINAL When severity categories of the age-adjusted Charlson
in-dex were used [cut-off 5 to < 9 (severe) and cut-off ≥ 9 (very severe)], a different association between multimorbidity and severity of illness has been found (Table 5) with an increas-ing association from the presence of six conditions onwards with the two poorest outcome cut-offs, particularly with ≥ 9. No association with the highest severity cut-off of the Charlson index (≥ 9) has been found up to MM5+ (five con-ditions or more) and a conflicting trend of association with the cut-off 5 to < 9 has been found. From MM6+ onwards, a consistently increasing OR for both severity cut-offs has been found.
DISCUSSION
The higher average number of conditions,1,8 in male pa-tients found in this study is worth mentioning,1,8 as well as the severity of illness through the Charlson index.1,11 A vari-able frequency of multimorbidity has been confirmed for dif-ferent settings (MM2+ to MM8+) with a declining frequency in all age groups when progressing from MM2+ to MM8+: 41.9% (MM2+), 28.0% (MM3+), 18.4% (MM4+), 12.4% (MM5+), 8.8% (MM6+), 5.0% (MM7+) and 3.1% (MM8+). These results were slightly lower to those found in the
Aus-tralian study, except regarding MM2+,9 probably due to the fact that data regarding hospitalised patients were used. A decline in the whole multimorbidity scores has been found in most elderly patients (≥ 90).
A so-called clinical coherence was granted by condi-tions associated with male gender (liver disease or COPD, for instance)27,28 as based on the empiric knowledge and confirmed by literature.29-36 The same applies to the asso-ciation of conditions associated with female gender: mus-culoskeletal disorders37 (osteoporosis38 and connective tis-sue disease) and mental disorders37 (dementia, anxiety and depression). The associations of health conditions such as congestive heart failure and dementia with elderly ages are in line with literature.39
A relationship between multimorbidity and severity of illness has not been clearly established and therefore the Charlson index was used (outcome instrument) as a meas-ure of severity of illness.16,20 Scores such as the Charlson in-dex allow for the aggregation of the complex reality into sin-gle indicators, with a list of conditions weighted according to the mortality risk. Despite the controversy regarding the use of scores,17 the use of the Charlson index was confirmed as clinically relevant and useful in further comparisons
Table 4 – Conditions associated with Charlson index ≥ 5, non-adjusted to patient’s age in multivariate analysis
Diagnosis p OR Lower range Upper range
Corrected total of conditions < 0.001 804.571 737.763 877.430
Dementia < 0.001 379.468 326.066 441.617
Diabetes mellitus < 0.001 156.458 143.129 171.028
COPD < 0.001 111.830 100.183 124.832
Congestive heart failure < 0.001 103.997 94.112 114.921
Non-metastatic solid tumour or leukaemia or lymphoma < 0.001 89.627 70.070 114.643
Connective tissue disease < 0.001 86.283 73.785 100.897
Peptic ulcer < 0.001 70.029 57.713 84.974
Cerebrovascular disease < 0.001 64.745 58.290 71.915
Peripheral vascular disease < 0.001 40.663 35.344 46.783
Moderate or severe renal disease < 0.001 33.917 29.265 39.308
Acute myocardial infarction < 0.001 25.338 22.253 28.852
Liver disease < 0.001 24.303 20.324 29.062
Hemiplegia or paraplegia < 0.001 13.251 11.300 15.540
Table 5 – Association between measures of multimorbidity and categories of poorest outcome of the age-adjusted Charlson index
Cut-off 5 to < 9 ≥ 9
p OR Lower range Upper range p OR Lower range Upper range
MM2+ < 0.001 52.641 51.697 53.602 ns
MM3+ < 0.001 29.495 29.099 29.896 ns
MM4+ < 0.001 39.407 38.690 40.137 ns
MM5+ < 0.001 76.959 74.325 79.687 ns
MM6+ < 0.001 209.546 192.851 227.685 < 0.001 53,836.701 48,424.289 59,841.703 MM7+ < 0.001 473.172 376.402 594.822 < 0.001 24,346.826 19,366.124 30,608.496 MM8+ < 0.001 1097.052 579.187 2110.751 < 0.001 79,684.008 41,448.928 153,189.513
ARTIGO ORIGINAL between different settings.
14,18,19 The association of the poorest outcomes and conditions with the highest severity with male gender seems to confirm the ‘morbidity-mortality (gender) paradox’ suggesting that healthcare in male pa-tients should be mainly focused on the deadliest health con-ditions such as cancer, heart or cerebrovascular diseases, while mainly on the approach to health conditions with a relevant impact on patient’s functional capacity in female patients (musculoskeletal and mental disorders).40,41 The validity of the results obtained in our study may be due to the robustness given by the sample size, by the sig-nificance of results, the diagnostic accuracy as well as clini-cal coherence. The inclusion of accurate mediclini-cal diagnoses and the use of medical records classified according to the International Classification of Diseases (ICD) coding sys-tem has been assumed as diagnostic accuracy. The use of medical records classified according to the ICD system has contributed to the reproducibility and external validity of the results, as well as to the comparability of morbidity between different countries17 and settings.
The question arises as to whether this association with male gender is related with the source of data regarding se-verity of illness (hospital admission data), with gender para-dox regarding the use of healthcare services or even with specific characteristics of the Portuguese population, due to the fact that an association between multimorbidity and male gender has been found, in line with the Portuguese study carried out in primary care setting.11 However, these results are not in line with the meta-analysis by Violan C et al., in which an association with female gender has been found by most studies.13
In line with the minimum number of medical conditions to be included in multimorbidity studies4 in order to ensure the lowest possible variability,6 a total of 22 conditions were included in our study, including the most frequently stud-ied4 such as diabetes mellitus, osteoarthritis, hypertension and cancer.4 The GLM model of analysis and the use of the Charlson index were the other methodological strategies that make our study reproducible, even though it should not be extrapolated to the population, due to the use of hospital admission data.
The association between any measure of multimorbidity (from MM2+ to MM8+) and the Charlson index was con-firmed with the assessment of the association between mul-timorbidity and severity of illness measure (Charlson index) through bivariate analysis within the GLM model. When the association between multimorbidity (MM2+ to MM8+) and three cut-offs of an age-adjusted Charlson index (< 5, 5 to < 9 and ≥ 9) was analysed, the poorest outcome was associ-ated with the setting of six or more medical conditions. De-spite the apparent clinical significance, this was not found in literature, even though it is questioned whether or not it cor-responds to the concept of complex multimorbidity, defined as the “co-occurrence of three or more chronic conditions affecting three of more different systems within a patient”.9 Further studies are required to clarify the meaning of a mul-timorbidity setting of six or more conditions (MM6+) as a
measure of severity of illness. The results obtained from the GLM model explain for the range of values of OR and con-fidence intervals (Table 5).
The number of conditions within a patient was the great-est predictor of the severity of illness followed by dementia, diabetes mellitus, COPD and congestive heart failure, by descending order of the value of OR, which seems in line with the decline in average life expectancy associated with multimorbidity, with a 1.8-year reduction related to each ad-ditional chronic condition (ranging between a 0.4-year re-duction with the first condition and 2.6-year with the sixth).17 The cross-sectional design and the nature of the study have been identified as limitations of the study, in addition to the absence of socioeconomic data including patient’s education, income or social network, which are consist-ently associated with multimorbidity in other studies,12,13 or even the absence of protective factors reducing the effect of multimorbidity such as patient’s high education, healthy lifestyle, good social network and regular leisure activity.42 According to the authors, the fact that the same medi-cal conditions were used in both measures of multimorbidity and severity of illness (Charlson index) is the main limitation of the study. However, this study leaves the prospect that these issues would become more clarified with further re-search with longitudinal studies on the association between the number and nature of medical conditions and the use of Charlson index over time in different settings (admission to hospital, primary healthcare and general population). Fur-ther studies and models of analysis are required for the ap-proach to the complexity of multimorbidity (social, mental and physical) and clarification of the currently simple defini-tion of multimorbidity, which is apparently indadequate.17 Despite the limitations, different aspects make this study unique, including:
▪ The results were based on a robust database, such as the GDH database, involving conditions classified ac-cording to the ICD-9 system and allowing for the deter-mination of severity through the Charlson index. ▪ The reproducibility of this methodology, with a
contribu-tion to further comparisons between healthcare depart-ments, healthcare units or levels of healthcare.
▪ The size of our group of patients and the method of analysis, allowing for the confirmation of an association between severity of illness and multimorbidity with male gender.
▪ The association between severity of illness and the set-ting of six or more medical conditions within a patient may become a simple measure of severity of illness.
CONCLUSION
ARTIGO ORIGINAL patients. The number or conditions, followed by dementia
and diabetes mellitus were the greatest predictors of se-verity of illness by using the Charlson index. Multimorbidity with six or more conditions within a patient was consistently associated with severity of illness.
HUMAN AND ANIMAL PROTECTION
The authors declare that the followed procedures were according to regulations established by the Ethics and Clini-cal Research Committee and according to the Helsinki Dec-laration of the World Medical Association.
DATA CONFIDENTIALITY
The authors declare that they have followed the proto-cols of their work centre on the publication of patient data.
CONFLICTS OF INTEREST
The authors declare that there were no conflicts of inter-est in writing this manuscript.
FINANCIAL SUPPORT
The authors declare that there was no financial support in writing this manuscript.
REFERENCES
1. Valderas JM, Starfield B, Sibbald B. Defining comorbidity: implications for understanding health and health services. Ann Fam Med. 2009;7:357– 63.
2. Broeiro P. Multimorbilidade e comorbilidade: duas perspectivas da mesma realidade. Rev Port Med Geral Fam. 2015;31:7–8.
3. Le Reste JY, Nabbe P, Manceau B, Lygidakis C, Doerr C, Lingner H, et al. The European General Practice Research Network presents a comprehensive definition of multimorbidity in family medicine and long term care, following a systematic review of relevant literature. J Am Med Dir Assoc. 2013;14:319–25.
4. Diederichs C, Berger K, Bartels DB. The measurement of multiple chronic diseases - a systematic review on existing multimorbidity indices. Journals Gerontol - Ser A Biol Sci Med Sci. 2011;66:301–11. 5. Stewart M, Fortin M, Britt HC, Harrison CM, Maddocks HL. Comparisons
of multi-morbidity in family practice-issues and biases. Fam Pract. 2013;30:473–80.
6. Fortin M, Stewart M, Poitras M, Maddocks H. A systematic review of prevalence studies on multimorbidity: toward a more uniform methodology. Ann Fam Med. 2012;10:142–51.
7. Zellweger U, Bopp M, Holzer BM, Djalali S, Kaplan V. Prevalence of chronic medical conditions in Switzerland: exploring estimates validity by comparing complementary data sources. BMC Public Health. 2014;14:1157.
8. Haregu T, Oldenburg B, Setswe G, Elliott J. Perspectives, constructs and methods In the measurement of multimorbidity and comorbidity : a critical review. Internet J Epidemiol. 2012;10:1–9.
9. Harrison C, Britt H, Miller G, Henderson J. Examining different measures of multimorbidity, using a large prospective cross-sectional study in Australian general practice. BMJ Open. 2014;4:e004694.
10. Mokraoui NM, Haggerty J, Almirall J, Fortin M, Schram M, Frijters D, et al. Prevalence of self-reported multimorbidity in the general population and in primary care practices: a cross-sectional study. BMC Res Notes. 2016;9:314.
11. Prazeres F, Santiago L. Prevalence of multimorbidity in the adult population attending primary care in Portugal: a cross-sectional study. BMJ Open. 2015;5:e009287.
12. Barnett K, Mercer SW, Norbury M, Watt G, Wyke S, Guthrie B. Epidemiology of multimorbidity and implications for health care , research , and medical education : a cross-sectional study. Lancet. 2012;380:37–43.
13. Violan C, Foguet-Boreu Q, Flores-Mateo G, Salisbury C, Blom J, Freitag M, et al. Prevalence, determinants and patterns of multimorbidity in primary care: A systematic review of observational studies. PLoS One. 2014;9:3–11.
14. Carey IM, Shah SM, Harris T, Dewilde S, Cook DG. A new simple primary care morbidity score predicted mortality and better explains between practice variations than the Charlson index. J Clin Epidemiol. 2013;66:436–44.
15. De Groot V, Beckerman H, Lankhorst GJ, Bouter LM. How to measure comorbidity: a critical review of available methods. J Clin Epidemiol. 2003;56:221–9.
16. Quan H, Li B, Couris CM, Fushimi K, Graham P, Hider P, et al. Updating and validating the charlson comorbidity index and score for risk adjustment in hospital discharge abstracts using data from 6 countries. Am J Epidemiol. 2011;173:676–82.
17. DuGoff EH, Canudas-Romo V, Buttorff C, Leff B, Anderson GF. Multiple chronic conditions and life expectancy. Med Care. 2014;52:688–94. 18. Crooks CJ, West J, Card TR. A comparison of the recording of
comorbidity in primary and secondary care by using the Charlson Index to predict short-term and long-term survival in a routine linked data cohort. BMJ Open. 2015;5:e007974.
19. Brilleman SL, Salisbury C. Comparing measures of multimorbidity to predict outcomes in primary care: a cross sectional study. Fam Pract. 2013;30:172–8.
20. Charlson M, Szatrowski TP, Peterson J, Gold J. Validation of a combined comorbidity index. J Clin Epidemiol. 1994;47:1245–51.
21. Yurkovich M, Avina-Zubieta JA, Thomas J, Gorenchtein M, Lacaille D. A systematic review identifies valid comorbidity indices derived from administrative health data. J Clin Epidemiol. 2015;68:3–14.
22. Li B, Evans D, Faris P, Dean S, Quan H. Risk adjustment performance of Charlson and Elixhauser comorbidities in ICD-9 and ICD-10 administrative databases. BMC Health Serv Res. 2008;8:12.
23. Deyo RA, Cherkin DC, Ciol MA. Adapting a clinical comorbidity index for use with ICD-9-CM administrative databases. J Clin Epidemiol. 1992;45:613–9.
24. Khan NF, Perera R, Harper S, Rose PW. Adaptation and validation of the Charlson Index for Read/OXMIS coded databases. BMC Fam Pract. 2010;11:1.
25. Ramiarina RA, Ramiarina BL, Almeida RM, Pereira WC de A. Comorbidity adjustment index for the international classification of diseases, 10th revision. Rev Saude Publica. 2008;42:590–7.
26. Gabinete de Estatísticas da União Europeia. Sustainable development in the European Union - 2015 monitoring report of the UE Sustainable Developmnt Strategy [Internet]. Luxembourg: Publications Office of the European Union; 2015. [consultado a 2017 fev 11]. Disponível em: http://ec.europa.eu/eurostat/documents/3217494/6975281/KS-GT-15-001-EN-N.pdf.
27. Afonso AS, Verhamme KM, Sturkenboom MC, Brusselle GG. COPD in the general population: Prevalence, incidence and survival. Respir Med. 2011;105:1872–84.
28. Dal Negro RW, Bonadiman L, Turco P. Prevalence of different comorbidities in COPD patients by gender and GOLD stage. Multidiscip Respir Med. 2015;10:24.
29. Ferlay J, Steliarova-Foucher E, Lortet-Tieulent J, Rosso S, Coebergh JW, Comber H, et al. Cancer incidence and mortality patterns in Europe: estimates for 40 countries in 2012. Eur J Cancer. 2013;49:1374–403. 30. Malvezzi M, Carioli G, Bertuccio P, Rosso T, Boffetta P, Levi F, et al.
European cancer mortality predictions for the year 2016 with focus on leukaemias. Ann Oncol. 2016;27:725–31.
31. Rehm J, Samokhvalov AV, Shield KD. Global burden of alcoholic liver diseases. J Hepatol. 2013;59:160–8.
32. Blachier M, Leleu H, Peck-Radosavljevic M, Valla DC, Roudot-Thoraval F. The burden of liver disease in Europe: a review of available epidemiological data. J Hepatol. 2013;58:593–608.
33. Townsend N, Wilson L, Bhatnagar P, Wickramasinghe K, Rayner M, Nichols M. Cardiovascular disease in Europe: epidemiological update 2016. Eur Heart J. 2016;37:3232–45.
ARTIGO ORIGINAL
35. Sanchis-Gomar F, Perez-Quilis C, Leischik R, Lucia A. Epidemiology of coronary heart disease and acute coronary syndrome. Ann Transl Med. 2016;4:256.
36. Ostan R, Monti D, Gueresi P, Bussolotto M, Franceschi C, Baggio G. Gender, aging and longevity in humans: an update of an intriguing/ neglected scenario paving the way to a gender-specific medicine. Clin Sci. 2016;130:1711–25.
37. McLean CP, Asnaani A, Litz BT, Hofmann SG. Gender differences in anxiety disorders: Prevalence, course of illness, comorbidity and burden of illness. J Psychiatr Res. 2011;45:1027–35.
38. Wright NC, Looker AC, Saag KG, Curtis JR, Delzell ES, Randall S, et al. The recent prevalence of osteoporosis and low bone mass in the United States based on bone mineral density at the femoral neck or lumbar
spine. J Bone Min Res. 2014;29:2520–6.
39. Guzman-Castillo M, Ahmadi-Abhari S, Bandosz P, Capewell S, Steptoe A, Singh-manoux A, et al. Forecasted trends in disability and life expectancy in England and Wales up to 2025: a modelling study. Lancet Public Health. 2017;2:e307-13.
40. Chang WC, Lu FP, Lan TY, Wu SC. Multidimensional health-transition patterns among a middle-aged and older population. Geriatr Gerontol Int. 2012;13:571–9.
41. Luy M, Minagawa Y. Gender gaps - life expectancy and proportion of life in poor health. Health Reports. 2014;25:12–9.