Trust-Based Security Level Evaluation using Bayesian
Belief Networks
Siv Hilde Houmb1, Indrakshi Ray2, Indrajit Ray2, and Sudip Chakraborty3 1 SecureNOK Ltd.,sivhoumb@securenok.com
2 Colorado State University,{iray, indrajit}@cs.colostate.edu 3 Valdosta State University,schakraborty@valdosta.edu
Abstract. Security is not merely about technical solutions and patching
vulner-abilities. Security is about trade-offs and adhering to realistic security needs, em-ployed to support core business processes. Also, modern systems are subject to a highly competitive market, often demanding rapid development cycles, short life-time, short time-to-market, and small budgets. Security evaluation standards, such as ISO 14508 Common Criteria and ISO/IEC 27002, are not adequate for evaluating the security of many modern systems for resource limitations, time-to-market, and other constraints. Towards this end, we propose an alternative time and cost effective approach for evaluating the security level of a security solution, system or part thereof. Our approach relies on collecting information from dif-ferent sources, who are trusted to varying degrees, and on using a trust measure to aggregate available information when deriving security level. Our approach is quantitative and implemented as a Bayesian Belief Network (BBN) topology, allowing us to reason over uncertain information and seemingly aggregating dis-parate information. We illustrate our approach by deriving the security level of two alternative Denial of Service (DoS) solutions. Our approach can also be used in the context of security solution trade-off analysis.
Key Words:security evaluation, trust, bayesian belief networks, common criteria
1
Introduction
Often times there is a need to build a security solution that has a rapid development cycle, short time-to-market, and a short life-time. It is important to predict the security of such a system before it can be deployed, due to a number of constraints put on the system including cost, schedule and security. One approach for evaluating the security level of security solutions is by using standards, such as ISO 14508 Common Criteria for Information Technology Security Evaluation [1]).
However, predicting the security level using the Common Criteria has many draw-backs. First, the result of a Common Criteria evaluation is not given as a statement of the security level of a system, but rather as the level of assurance that the evaluator has in whether the set of security features present in the system in combination provide ad-equate security. This is hard for decision makers to relate to. Second, Common Criteria evaluations are time and resource demanding and may not always be worth in terms
of effort and cost. In Norway, for example, where one of the authors work, a security evaluation according to Common Criteria for EAL 4/4+ has an estimated cost of 1.5 million NOK (about 250,000 USD). It also takes 2-3 working days to arrive at a trust-worthy estimate about the security of even a small system. Third, the documentation and tests required by Common Criteria may not be suitable for a particular system or deployment environment.
The above mentioned difficulties in adopting a security evaluation standards like Common Criteria for predicting security level of a system, motivates us to develop an alternative approach. We propose an approach for evaluating the security level of a system using information collected from a number of different sources, including sub-jective judgments as those of evaluators and similar. A source can be an active agent or a domain expert. We need to consider the trustworthiness of the sources before aggregat-ing the information provided by each of them. We propose a model of trust to formally capture the concept of trustworthiness of information sources. Trust, in our model, is a relationship between a truster and a trustee with respect to some given context. For instance, a truster A may trust a trustee B in the context of understanding network pro-tocols but may not trust B in the context of understanding database security. Here, the entity trying to obtain information from the sources is the truster, the information source is the trustee, and the problem for which the information is requested is the trust con-text, also called security evaluation case. The trustworthiness of an information source depends on two factors, namely, its knowledge level and expertise level. Knowledge level captures the level of knowledge possessed by the information source with respect to the security evaluation case; the trust context. Expertise level captures the experience and qualifications of the information source.
We show how to evaluate these two factors and quantify the trustworthiness of sources and from that derive a security level prediction. The approach is implemented as a Bayesian Belief Network (BBN) topology, which allows us to reason over uncer-tain information and to aggregate disparate information in a step-wise and seamless manner. Our approach is semi-automatic in the sense that it does require some human intervention; however, it significantly eases the burden of deciding on appropriate secu-rity solutions in a structured and well-informed manner. We demonstrate our approach by showing how to evaluate five information sources and aggregate the information pro-vided by these when evaluating the security level of two alternative Denial of Service (DoS) solutions. We chose this particular example because it relates closely to the type of security solutions that we are targeting with our approach.
The rest of the paper is organized as follows. Section 2 summarizes the related work to place our work into context. Section 3 discusses information sources of relevance for security evaluations. Section 4 presents the approach for deriving the security level of a given security solution, part of a system or a system. It shows how to evaluate the factors on which trust depends, provides a model for calculating trustworthiness, and describes how this can be used for aggregating the information obtained from various sources. Section 5 gives the details of the Bayesian Belief Network (BBN) implementation, and Section 6 illustrates our approach by showing an example of security level evaluation of two alternative DoS security solutions. In section 7 we discuss some of the issues
related to using this approach for predicting security levels that the user needs to be aware of. Finally, Section 8 concludes the paper with pointers to future directions.
2
Related work
The trust-based security level evaluation approach builds on techniques from three dis-tinctive domains: security evaluation, expert judgment aggregation, and trust.
The literature on trust can be broadly classified into three distinct areas - (i) trust models, (ii) trust management and negotiation, and (iii) application of trust concepts. Here, trust models are of most relevance.
Jøsang [2, 3] propose a model for trust based on a general model for expressing relatively uncertain beliefs about the truth of statements. Cohen et al. [4] describe an alternative, more differentiated concept of trust called Argument-based Probabilistic Trust model (APT). Yahalom et al. [5, 6] outline a formal model for deriving new trust relationships from existing ones. Beth et al. [7] extend the ideas presented by Yahalom et al. to include relative trust. Xiong and Liu [8] present a coherent adaptive trust model for quantifying and comparing the trustworthiness of peers based on a transaction-based feedback system. Other works include logic-based formalisms of trust [9–12] that allow one to reason about trust relationships. While each of these models have their individual strengths and applicability, none of them discuss which parameters should be consid-ered in evaluating the trustworthiness of users or systems.
Bacharach and Gambetta, on the other hand, [13] define trust as a particular belief, which arises in games with a certain payoff structure. The authors observe that in most games, the truster sees or observes a trustee before making any decision and, therefore, can use these observations as evidence for the trustee’s having, or lacking, trustworthy-making qualities. Purser [14] presents a simple, graphical approach to model trust. In particular, the author emphasizes the relationship between trust and risk and argues that for every trust relationship, there exists a risk associated with a breach of the trust ex-tended. Ray and Chakraborty [15] and Ray et al. [16] were among the first to describe the factors on which trust depends. They show how to quantify these factors, and from that how to obtain a quantitative value for trust. In addition, there is the work by Sun and Yang [17] on theoretical analysis and evaluation of trust models. Our approach borrow from these works. It builds on the trust decision making aspects discussed in Bacharach and Gambetta, the granulated trust evaluation model of Ray et al. [16] and the perspective of direct and indirect trust relationships discussed by Sun and Yang. In particular, our approach enables the granulated evaluation of the trustworthy-making qualities of a trustee based on observations, and also tangible aspects related to trustee knowledge and experience (such as education and number of years of professional ex-perience and expertise domains). Different from most other work, our approach focuses on the evaluation of experts as information sources in the context of expert judgment aggregation.
In the domain of security evaluation there are mainly three categories of techniques - (i) operational and quantitative measurement of security, (ii) security management standards, and (iii) security evaluation and certification approaches, such as ISO 15408 the Common Criteria.
Littlewood et al. [18] was one of the earliest works on measuring operational se-curity. The authors argue for the importance of extending the capabilities of current security evaluation approaches to include techniques for quantitative measure of the perceived level of security, as well as evaluating the operational security level. Sub-sequently, Ortalo et al. [19] proposed a quantitative model for evaluating Unix secu-rity vulnerabilities using a privilege graph. Madan et al. [20] discuss how to quantify security attributes of software systems using traditional reliability theory for model-ing random processes, such as stochastic modelmodel-ing and Markov analysis. Jonsson and Olovsson [21] look at the problem in a more practical way by analyzing attacker behav-ior through controlled experiments. Houmb et al. [22] and Houmb [23] build on these works emphasizing the importance of quantitative measures of security and the role of security trade-off analysis. The goal is to assist decision makers in choosing among al-ternative security solutions, based on security, cost, resources, time-to-market and other trade-off parameters, and to reduce time, cost and effort in security evaluations. The current work draws upon Houmb’s earlier works [22, 23].
Security management standards aid in the overall management of security in an organization. The most important standards in this area are the ISO/IEC 27002:2005 Information technology – Code of Practice for information security management [24], ISO/IEC TR 13335:2004 Information technology – Guidelines for management of IT Security [25], and AS/NZS ISO 31000:2009, Risk management - Principles and guide-lines [26]. ISO/IEC 27002 provides recommendations for information security manage-ment and supports those that are responsible for initiating, implemanage-menting or maintain-ing security in their organization. ISO/IEC 13335 provides guidance on management aspects of IT security. This standard’s main objectives are: to define and describe the concepts associated with the management of IT security, to identify the relationships be-tween the management of IT security and management of IT in general, to present sev-eral models which can be used to explain IT security, and to provide gensev-eral guidance on the management of IT security. AS/NZS ISO 31000:2009 is a widely recognized and used standard within the field of risk assessment and management. It is a general risk management standard that have been tailored for security critical systems in the CORAS framework. The standard includes a risk management process, a detailed ac-tivity description, a separate guideline companion standards, and general management advices.
Security evaluation standards includes TCSEC [27], ITSEC [28] and ISO 14508 Common Criteria [1]. TCSEC is the oldest known standard for evaluation and certifi-cation of information security in IT products. The standard was developed by the De-partment of Defense (DoD) in the US in the 1980ies. The standard evaluates systems according to six predefined classes: C1, C2, B1, B2, B3 and A1. These classes are hier-archically arranged, meaning that A1 is the strongest and C1 is the weakest. Each class contains both functional and assurance requirements. The functional requirements are divided into authentication, role based access control, obligatory access control, log-ging and reuse of objects. TCSEC is also known as the Orange Book and was tailored for military IT systems.
The International Organization for Standardization (ISO) harmonized TCSEC, IT-SEC and other security evaluation/assurance standards and published the first version
of ISO 14508, also know as the Common Criteria, in 1999. The idea behind the Com-mon Criteria was to develop a world wide approach for evaluating security properties of IT products and systems. The standard incorporates experience from TCSEC, ITSEC and other related standards, and provides a common set of requirements for the secu-rity functions of IT products and systems. Among other things, the standard provides a common evaluation methodology such that results from independent evaluations can be compared and thereby aid decision makers in choosing between security solutions. Certification is done according to the seven predefined classes: EAL1, EAL2, EAL3, EAL4, EAL5, EAL6 and EAL7.
A common problem for most security evaluations, however, is the large amount of information involved. The result of such evaluations is also subject to bias as the evaluation is done by one or a few evaluators. Although evaluators must be certified to perform evaluations according to the Common Criteria, evaluations still include many tasks that only rely on subjective assessment (someone saying something about some-thing as it cannot be directly observed). It is these problems that our trust-based security level evaluation approach is designed to aid. Rather than relying on single information sources, our approach combine multiple sources and aggregates information provided by these sources based on the trustworthiness of the source. However, this does not mean that the biases are completely removed. The level of bias has been reduced signif-icantly. Also, these biases are not directly related to the information provided but to the ways in which we derive the knowledge and experience level of an information source. Managing security is, in general, difficult and there is a lack of industry standard security metrics. The reason for this is that there is very little empirical data available for estimating the risks facing a system. Thus, one must often rely solely on the opinions of domain experts and risk analysts. This is particularly problematic for risk estimation (estimating the likelihood and impact of a potential threat). The trust-based information aggregation part of our approach (part 1 of the approach) can aid in the process of risk estimation by aggregating whatever information that is available. The same is the case for quantifying operational security level, where our approach evaluates the security level directly by the notion of trust rather than through stochastic modeling techniques. Stochastic modeling techniques, such as Markov models, are effective, but rather time consuming to create and suffer from the problem of state explosion. Our approach avoid this problem as it does not model the problem itself but rather the information available to assess the problem.
3
Information Sources for Security Level Evaluation
Evaluating the security of a system involves information, whether it is given as an ex-pert judgment from a formally certified Common Criteria evaluator or from a log-file of some kind. Information always comes from a source and it is the trustworthiness of these sources that we evaluate in our approach, not the information itself. This is be-cause an information source can be assessed in terms of observable properties, while this is rather difficult with information. These properties can also be used to calibrate various types of information and enables us to aggregate over all available information of relevance.
Definition 1. An information source is an active or a passive entity which has
ob-tained, either directly or indirectly, relevant information for evaluating the security level of a system.
Active entities have the ability to observe events, interpret the observations, and generate additional information from these observations. A domain expert is consid-ered an active entity. Software and agents operating using rule sets as well as all types of intelligent software are additional examples of active entities. Passive entities merely record or receive information but do not interpret or manipulate the information them-selves. An example of a passive entity is a log file. Note that neither active nor passive entities can, by default, be completely trusted. For instance, domain experts can have their individual biases or can be influenced, software agents may contain Trojan horses, and configuration of a log file may be set up to disregard important information. We call active entities indirectly observable sources and passive entities directly
observ-able sources.
Definition 2. An indirectly observable source is an information source that has
inter-preted an observed phenomenon or event of relevance to the particular security evalu-ation case (including recommendevalu-ations), and provides the informevalu-ation as its subjective opinion (judgment).
Indirectly observable sources may be biased. When it comes to the use of indirectly ob-servable information sources for evaluating the security level, two types are commonly used: subjective expert judgment and third-party interpreted information (recommenda-tion). In subjective expert judgment, the experts have gained knowledge and experience of relevance to the security evaluation case that they use when providing information. Third party interpreted information refers to an expert interpreting events observed by another source, such as another expert or a directly observable source. This means that the expert interprets the information given by other sources before providing the infor-mation.
Definition 3. A directly observable source is an information source that either has
gathered empirical information or that has directly observed a phenomena or events relevant for the particular security evaluation case.
Directly observable sources have not been biased by subjective influence. This means that the sources have gained knowledge and experience by observing actual events themselves. Commonly used directly observable information sources are real-time in-formation sources, such as Intrusion Detection Systems (IDS), log-files from firewalls, Internet gateways (routers), honeypots, and scanners for virus, vulnerability, and spy-ware.
4
Model and Computational Engine for Evaluating Security Level
Our approach to security level evaluation comprises two main phases: (i) evaluate the trustworthiness of the information sources to determine their trust level scores, and (ii) derive the security level by combining the result of (i) with the information provided.
The first phase deals with assessing the trustworthiness of an information source. The trustworthiness of a source depends on two parameters: knowledge level and
exper-tise level of an information source. Knowledge level of an information source is defined
as a measure of awareness of the information source about the knowledge domains of relevance to the particular security evaluation case. It is represented in terms of a num-ber called knowledge score. Expertise level of an information source is defined as a measure of degree of ability of the information source to assess the security level of a security solution. It is represented in terms of a number called expertise score.
Trust-worthiness of an information source is defined as a measure of the competence of the
information source to act desirably and to provide information to the best of its abili-ties. It is represented in terms of a number called trustworthiness score. Trustworthiness score is then derived by combining the knowledge and expertise scores.
4.1 Evaluate Knowledge Score of an Information Source
The knowledge score of an information source gives a measure of how closely the knowledge of that information source is related to the desired knowledge for the se-curity evaluation case (trust/problem context). The knowledge score is calculated from two scores – reference knowledge domain score and information source knowledge
do-main score. These two scores are derived using two models – reference knowledge domain model and information source knowledge domain model. The reference
knowl-edge domain model provides the relative importance of different knowlknowl-edge domains regarding the problem context. The information source knowledge domain model gives an assessment, by a third party, of the relative importance of knowledge level of an in-formation source corresponding to the knowledge domains identified in the reference knowledge domain model.
Reference Knowledge Domain Model
Evaluating the security level of a security solution typically benefits from knowl-edge in several domains, not all of which are equally important. Knowlknowl-edge level of an information source expresses his/her awareness about these knowledge domains. We develop a reference knowledge domain model that captures the domains that are of interest and their relative importance with respect to the security level evaluation case (problem context). The relative importance of a domain is measured in terms of
importance weight which is defined to be the percentage of the whole reference
knowl-edge domain covered by that particular knowlknowl-edge domain. Figure 1 shows a reference knowledge domain model for a security solution consisting of four domains: domain A (network security) domain B (Internet Protocol), domain C (authentication) and do-main D (access control). The four dodo-mains cover the security solution to various de-grees. Thus the difference in the importance weights. Note that this is just an example reference knowledge domain model and does not refer to any specific security level evaluation case.
In the computation of reference knowledge domain weights, we first find out the knowledge domains that are of relevance to the particular security level evaluation case. A discussion on how the relevant knowledge domains are determined is beyond the scope of this paper. Once we determine the knowledge domains that are of interest, we arrange the domains in some order and find their respective importance weight. Often,
Fig. 1. Reference knowledge domain model
the process of determining the knowledge domains itself will provide clues about their relative importance. This order could also be arrived at following some specific guide-lines of the evaluator. A vector, called reference knowledge domain scores, specifies the relative importance of all involved knowledge domains. Each element of the vector indicates the importance weight of the corresponding domain. This evaluation is shown next.
Calculating Reference Knowledge Domain Score
Each knowledge domain in the reference model has a particular importance weight associated with it. Note that multiple stakeholders are often involved in formalizing the problem context. Consequently, different stakeholders can assign different weights for importance. Suppose the stakeholders are denoted by the set X and the cardinality of the set is q. We use x to denote an individual stakeholder. Suppose m is the number of knowledge domains in the problem context. The importance of knowledge domains, from the point of view of a stakeholder x, is represented as an m-element vector. This vector is denoted by WKimp(x)where WKimp(x) = [wKimp(x(j))]mj=1. This is shown by Equation 1. Here, wKimp(x(j))∈[0, 1]∀j=1, . . . ,m and∑
m
j=1wKimp(x(j)) =1. Note that, we obtain such vector for each of the q stakeholders in the set X . The importance of the m different domains given by q stakeholders is then represented in a q×m matrix
denoted by WallKimp(X). Equation 2 gives the formula for WallKimp(X). The next step is to aggregate the information obtained from q stakeholders. The aggregation can be done using some aggregation technique. The idea is to apply an aggregation function, denoted by faggregation1, on the q×m matrix WallKimp(X)to merge the rows, resulting in a vector of size m. Equation 3 indicates the result of this aggregation. Here we do the aggregation by taking the arithmetic average for each m elements from all q number of vectors and put them into a single vector (for X ), WaggregatedKimp(X), which is given by
[waggregatedKimp(X(j))]mj=1. The arithmetic average is the simplest type of expert opinion aggregation. The reader is referred to Cooke [29] and similar sources for examples of other aggregation techniques. To normalize this vector, the normalization factor is obtained using Equation 4. Finally, the weight of each domain in the problem context is obtained by normalizing each element in the vector WaggregatedKimp(X)by the above normalization factor to obtain the vector Wre f KnowledgeDomainScore(X). This is shown in Equation 5. This vector derives the relative importance for each knowledge domain in the reference knowledge domain model.
WKimp(x) = [wKimp(x(j))]mj=1 (1)
WallKimp(X) = [WKimp(x)]qx=1 (2)
WaggregatedKimp(X) = faggregation1(WallKimp(X))
= [waggregatedKimp(X(j))]mj=1 (3) fre f Knorm= 1 ∑m j=1waggregatedKimp(X(j)) (4)
Wre f KnowledgeDomainScore(X) = fre f Knorm×WaggregatedKimp(X)
= [wre f KnowledgeDomainScore(X(j))]mj=1 (5)
Note, if simple average is used as an aggregation technique there is no need to normalize the vector WaggregatedKimp(X)as each element of the vector will be in[0, 1]and sum of all elements will be 1. In that case, we can ignore Equation 4 and WaggregatedKimp(X) =
Wre f KnowledgeDomainScore(X).
Information Source Knowledge Domain Model
An information source may not have comprehension in all the knowledge domains represented in the reference domain model. The information source knowledge domain model is used to derive the relative importance of the knowledge level of the informa-tion source according to the knowledge domains in the reference knowledge domain model. This relative importance is assessed by a third party or an expert and not by the information source itself. This helps reduce the bias involved in self-assessment.
Consider the reference knowledge domain example shown in Figure 1. For an infor-mation source, say b, a third party assessor assesses the relative importance of knowl-edge level of b on the identified knowlknowl-edge domains as (say) 30% on domain A, 30% on domain B, and 40% on domain D. Thus, the relative importance of b’s knowledge level on the domains, as assessed by the third party, is[0.3,0.3,0.0,0.4].
Suppose we have n information sources, denoted by b1,b2, . . . ,bn, in a security level evaluation. Assume Y is the set of third parties assessing the expertise of these n infor-mation sources. Let the cardinality of Y be z, and an individual third party in the set Y be denoted by y. Then, information source knowledge domain score is represented as an m-element vector where each element corresponds to some knowledge domain of the information source. Each element indicates the relative weight of that domain and has a weight between 0 and 1. Equations 6–10 show how to compute the information
source knowledge domain score for a source bi.
WKis(y(bi)) = [wKis(y(bi(j)))]mj=1 (6)
WallKis(Y(bi)) = [WKis(y(bi))]zy=1 (7)
WaggregatedKis(Y(bi)) = faggregation2(WallKis(Y(bi)))
= [waggregatedKis(Y(bi(j)))]mj=1 (8) fisKnorm= 1 ∑m j=1waggregatedKis(Y(bi(j))) (9)
WisKnowledgeDomainScore(Y(bi)) = fisKnorm×WaggregatedKis(Y(bi))
= [wisKnowledgeDomainScore(Y(bi(j)))]mj=1 (10) Each third party y∈Y provides a vector, denoted by WKis(y(bi)), of m-elements. Each element represents the assessed weight of knowledge level of the information source bicorresponding to the domain represented by that element as shown in Equation 6. This step is repeated for each y in the set Y and results in z such vectors. To aggregate information from all y for the information source bi, these z vectors are first combined in a z×m matrix in Equation 7 and then aggregated using some aggregation function in
Equation 8. The aggregation function is denoted as faggregation2in the equation. The ag-gregation technique used here is arithmetic average. We normalize this vector using the normalization factor obtained in Equation 9. Finally, the weight of each domain in the problem context is obtained by normalizing each element in the vector WaggregatedKisby the above normalization factor to obtain the vector WisKnowledgeDomainScore. This is shown in Equation 10. The result gives one vector for the set Y holding the relative knowledge domain scores for the information source bi. All these steps are then repeated n times (as we have n number of information sources).
Calculating Knowledge Score of Information Sources
The knowledge score of an information source bi, denoted by Kscore(bi), gives a measure of the source’s knowledge level and is calculated using the reference knowl-edge domain score and the information source knowlknowl-edge domain score of bi. For an information source bi, this score is calculated as follows.
Kscore(bi) = m
∑
j=1 {wre f KnowledgedomainScore(X(j))×wisKnowledgeDomainScore(Y(bi(j)))} (11) The result of the above equation is a real number derived by component-wise multipli-cation of the two vectors Wre f KnowledgeDomainScore(X)and WisKnowledgeDomainScore(Y(bi)) and then adding all the product values.4.2 Evaluating Expertise Score of an Information Source
Expertise level of an information source with respect to evaluating the security level of a security solution is represented by the expertise score. We propose to evaluate the expertise score using questionnaires to reduce the bias of self-assessment. Each questionnaire consists of a set of calibration variables which are further divided into
Variables Categories
level of expertise low, medium and high
age under 20, [20-25), [25-30), [30-40), [40-50), over
50
years of relevant education 1 year, 2 years, Bsc, Msc, PhD, other years of education others 1 year, 2 years, Bsc, Msc, PhD, other
years of experience from industry [1-3) years, [3-5) years, [5-10) years, [10-15) years, over 15 years
years of experience from academia [1-3) years, [3-5) years, [5-10) years, [10-15) years, over 15 years
role experience database, network management, developer,
de-signer, security management and decision maker
Table 1. Example calibration variables for assessing expertise level of information sources
Each information source is assessed on each calibration variable according to the information source’s category for that variable. However, not all calibration variables are of equal importance, neither all categories of a particular calibration variable have the same weight. The importance value for each calibration variable and the value as-sociated with each category is determined by some external source, such as an expert4. To derive expertise score of an information source, we develop calibration variable
importance weight model and calibration variable category importance weight model.
Calibration Variable Importance Weight Model
The relative importance of a calibration variable is assessed by external sources. Suppose the set of such external sources is denoted by X′ and the cardinality of the set is u. Each calibration variable that is pertinent to the problem context is associated with an importance value. A member x′of the set X′assigns an importance value from the range (0,1] to a calibration variable such that the sum of the importance value of all the calibration variables used is 1. Let there be p calibration variables denoted by l1,l2, . . . ,lpand Wl1,Wl2, . . . ,Wlp be their relative importance value assigned by the external source x′. This is represented by a vector Wl(x′) = [wlj(x
′)]p
j=1and shown in Equation 12. All u members of X′will assign such values. For each calibration variable, the final importance value is derived by applying an aggregation function, faggregation3, on Wl(X′). This is shown in Equation 14. A possible choice for such an aggregation function is the arithmetic average. Since, wlj(x
′)∈(0
, 1] for all j=1, . . . ,p and for each x′∈X′, the aggregation function is so chosen that each element of WI(X′)is in
(0, 1]and∑ p j=1Wlj(X ′) =1. Wl(x′) = [wlj(x ′)]p j=1 (12) Wl(X′) = [Wl(x′)]ux′=1 (13) WaggregatedCalwt(X′) = faggregation3(Wl(X′)) (14) Calibration Variable Category Importance Weight Model
4Interested readers are referred to Cooke [29] and Goossens et al. [30] for an overview of
Each category in a calibration variable is also associated with a value. This value denotes the importance weight of the category of that calibration variable. These values are assigned by the external sources in X′. Let the calibration variable lj have s cate-gories denoted by lj1,lj2, . . . ,ljs where ljk ∈[0, 1]for all k=1, . . . ,s. This is shown in Equation 15. All u members of X′assign weights and then an aggregation function is used to derive the category weights for calibration variable lj(Equation 16 and Equation 17 respectively).
Wc(x′(lj)) = [wc(x′(lj(i)))]si=1 (15)
Wc(X′(lj)) = [Wc(x′(lj))]ux′=1 (16)
WaggregatedC(X′(lj)) = faggregation4(Wc(X′(lj)) (17)
Therefore, WaggregatedC(X′(lj))holds the importance weight (as derived by all external sources in X′) of each category of the calibration variable lj. The above is done for all the calibration variables ( j=1, . . . ,p). Note that not every p calibration variables will have s categories.
Information Source Calibration Variable Category Score Model
An information source (bi) receives scores for applicable categories within each calibration variable by a set Y′of external sources where cardinality of y′is v. This score is computed as follows. Each information source biis required to fill the questionnaire. Each member of Y′assesses the completed questionnaire and assigns relative scores to applicable categories within each calibration variable. This score value lies within[0,1]. Equation 18 shows such scores, assigned by an y′∈Y′, for the calibration variable lj. All v members of Y′ assigns such scores and then an aggregation is used to reduce it to single set of values. Equations 19 and 20 show this. Hence, information source calibration variable category score model is designed as
WisCat(y′(bi(lj))) = [wisCat(y′(bi(lj(m))))]sm=1 (18)
WisCatAll(Y′(bi(lj))) = [WisCat(y′(bi(lj)))]vy′=1 (19)
WisCatAggregated(Y′(bi(lj))) = faggregation5(WisCatAll(Y′(bi(lj)))) (20)
The above is normally done for all calibration variables, but one may choose to limit the number of calibration variables depending on the resources and time available for the security level evaluation case. Note that for some calibration variables the members of Y′may not need to assign any score. For example, for the calibration variable level
of expertise, the importance weight of the applicable category (according to filled
ques-tionnaire) can work as the score. Hence, members of Y′ can assign simply 1.0 to the category.
Calculating Expertise Score of Information Sources
The set X′of external experts assign importance weights of each category within each calibration variable. Also the information source bireceives scores for applicable categories within each calibration variable by another set of experts Y′. These two are combined to derive the information source’s score for each calibration variable. Equa-tion 21 gives the value obtained by bifor calibration variable lj. The weighted sum of all these calibration variable scores, where the weight is the importance weight of the
corresponding calibration variable, gives the expertise score of bi, denoted by Escore(bi) as demonstrated by Equation 22. WcalScore(bi(lj)) = s
∑
m=1 WaggregatedC(X′(lj(m)))×WisCatAggregated(Y′(bi(lj(m))))(21) Escore(bi) = p∑
j=1 WaggregatedCalwt(X′(j))×WcalScore(bi(lj)) (22)4.3 Computing Information Source Trustworthiness
The information sources involved in the security level prediction have varying de-grees of trustworthiness, which depends on their knowledge levels and expertise levels. Therefore, the knowledge score and the expertise score must be combined to derive the trustworthiness of an information source. Here again, the problem context will deter-mine the relative importance of each score. Let k and e be the relative importance of the knowledge and expertise score. The following relations hold: 0≤k,e≤1 and k+e=1. The values of k and e can be set by the evaluator (or, truster). The trustworthiness score for information source bi, denoted by Tscore(bi)is computed as follows.
Tscore(bi) =k×Kscore(bi) +e×Escore(bi) (23)
4.4 Computing Security Level of a Security Solution
The trustworthiness score of an information source is used to compare the security level of different security solutions. The information obtained from each source bi (in the form of a number∈[0,1]), denoted by bi(I), is multiplied by the trustworthiness score of that source. This is done for all sources. The results are then added and divided by n. This gives the initial security level for the security solution sjas shown by Equation 24. This is done for all sjin the set of security solutions S. Since the r security solutions are compared against each other, we must obtain a relative security level for each solution. The relative security level of sjis computed using Equation 25.
FinitialSL(sj) = ∑ n i=1{bi(I)×Tscore(bi)} n (24) FSL(sj) = FinitialSL(sj) ∑r j=1FinitialSL(sj) (25)
5
Trust-Based Security Level Evaluation BBN Topology
The trust-based security level evaluation is implemented as a Bayesian Belief Network (BBN) topology to enable a flexible and effective platform for reasoning under uncer-tainty. In the following we give some background of BBN and a short description of the BBN topology. The next section demonstrates the use of the various parts of the BBN topology in a step-by-step manner for evaluating the security level of two DoS solutions.
5.1 Bayesian Belief Network Overview
Bayesian Network (BN) or Bayesian Belief Network (BBN) is based on Bayes rule and designed for reasoning under uncertainty. Bayes rule calculates conditional prob-abilities of events and BBN can handle large scale conditional event expressions due to its formalism. The BBN formalism [31–34] offers, in addition to the mathematical formalism and computational engine, an intuitive and compact graphical model rep-resentation. The graphical model is formed as a connected and directed acyclic graph (DAG) that consists of a set of nodes or variables and directed arcs (or, links). Nodes correspond to events or concepts, and are defined as stochastic or decision variables. Possible outcomes of the nodes are specified using a set of states, and multiple vari-ables may be used to determine the state of a node. Each state of each node is expressed using probability density functions (pdf). Probability density expresses ones confidence in the various outcomes of the set of variables connected to a node, and depends condi-tionally on the status of the parent nodes at the incoming edges. There are three type of nodes in BBN: 1) target node, which represents the target of the assessment (here, secu-rity level evaluation case), 2) intermediate node, which is a node that one have limited information or beliefs on (the intermediate level). The associated variables are hidden variables that represent aspects that may increase or decrease the belief in the target node, and 3) observable node, which represents information and evidence that can be directly observed or in other ways obtained. These three type of nodes are then con-nected in a topology and the status of the network is continuously updated as evidence are entered and propagated backward and forward along the edges in the network.
5.2 Structure of the BBN Topology
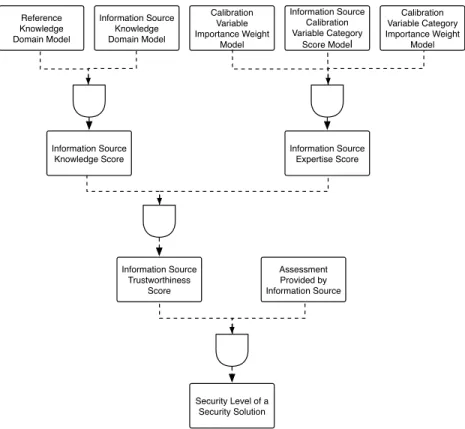
The trust-based security level evaluation approach involves a variety of information and information sources. These pieces of information are used as input to the different mod-els described in Section 4. Figure 2 gives a schematic overview of the BBN topology structure, which is constructed such that it resembles the underlying process. The BBN topology has been implemented using the HUGIN software tool [35].
As shown in Figure 2, information and evidence are structured according to four levels. The first level contains the five models used to derive the knowledge level and
expertise level of the information sources (B). This includes: 1) reference knowledge
domain model, 2) information source knowledge domain model, 3) calibration variable importance weight model, 4) calibration variable category importance weight model, and 5) information source calibration variable category score model. Here, the first two are involved in knowledge score model and thus internally dependent. The other three belongs to the expertise score model, and are also internally dependent. There is, however, independence between these two score models. In level two, these models are combined into the information source knowledge score model and information source
expertise score model. These two scores are further combined in the third level by the information source trustworthiness score model. Then, to determine the security level,
the resulting trustworthiness scores are combined with the set of information provided for all information source. This results in an security level prediction in level four.
Reference Knowledge Domain Model Information Source Knowledge Domain Model Information Source Calibration Variable Category Score Model Calibration Variable Category Importance Weight Model Calibration Variable Importance Weight Model Information Source Knowledge Score Information Source Expertise Score Information Source Trustworthiness Score Assessment Provided by Information Source Security Level of a Security Solution
Fig. 2. Schematic overview of the trust-based security level evaluation BBN topology
Figure 3 shows the top-level network in the BBN topology. The notation consists of ovals, dotted ovals, diamonds and squares. The ovals represent observable nodes, which are nodes where evidence is directly inserted. The dotted ovals represent intermediate nodes, meaning nodes that have a underlying subnet and that gets information as input from one or more observable nodes in its underlying subnet. The diamonds are utility functions which combine evidence from observable and intermediate nodes and it is these nodes that implement the equation sets described in Section 4. All other nodes in the topology represent the discrete variables providing input to the utility functions. Utility functions specify the relations between their input nodes and differ from ordinary nodes in that the probability density functions can be expressions, or equation sets that specify how information are aggregated. The squares in the figure represent decision nodes, which define the different outcomes from an utility function and are used to make intermediate or target decisions. As can be seen, we have two subnets in our BBN topology: 1) knowledge level, and 2) expertise level. In the following we describe these subnets using an example. However, first we take a look at how the BBN topology was
constructed and how it can be evolved as new information and insight is made available.
Fig. 3. Top-level network in the trust-based security level evaluation BBN topology
The BBN topology was constructed from available empirical data and the underly-ing process and structure are shown in Figure 2. It is important to note, however, that the structure of the topology is a critical factor of the BBN method, which consists of the following three steps: (1) construction of the BBN topology, (2) elicitation of probabilities to nodes and edges, and (3) making computations. We have used both a top-down and a bottom-up approach when deriving the BBN topology. The top-down approach is performed by manually modeling the associated nodes and their internal relations according to the information flows of Figure 2 and the models from Section 4. This resulted in a preliminary sets of DAGs together making up the BBN topology. The bottom-up approach was then performed by structural learning from available empiri-cal data. This means that the bottom-up approach also represents an evaluation of the models in Section 4 and the resulting BBN topology from the top-down approach, as the bottom-up approach only uses the empirical data and is carried out independently of the models.
The HUGIN software tool was selected as the implementation tool because of its structural learning capabilities. Two algorithms are available for structural learning in the HUGIN software tool and these are the PC (Path Condition) algorithm and the NPC (Necessary Path Condition) algorithm. The Hugin PC algorithm is a variant of the orig-inal PC algorithm (for more information the reader is referred to [36]) and belongs to the class of constraint-based learning algorithms. The NPC algorithm is an extension of the PC algorithm that solves some of the problems of the constraint-based learning in the PC algorithm. However, both algorithms generate the skeleton of the DAG or topol-ogy by the use of statistical tests for conditional independence. Their main difference lies in that for the NPC algorithm one needs to provide additional information to indi-cate the direction of dependencies in the graph, which result in a more complete DAG when little empirical data is available. To simplify the demonstration of our bottom-up approach, we show the result of structural learning from one data set from the example in Section 6 using both the PC and the NPC algorithms with an informally reasoning about the relationship between the variables of the resulting DAGs. This is shown in the figure 4(a).
Figure 4(a) shows the resulting DAG using the NPC algorithm, while Figure 4(b) shows the same using the PC algorithm. When using the NPC algorithm we get a suggestion for the internal relation among the three nodes: Escore(bi), Kscore(bi)and
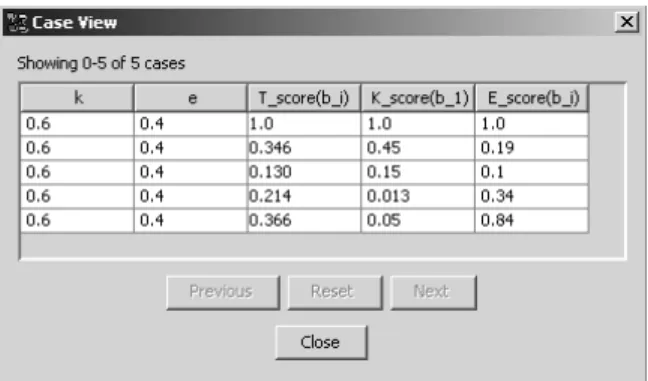
Tscore(bi). For demonstrational purposes, we have used the data from the input file shown in Figure 5. This is part of the data set used for the demonstration given in Section 6, and covers the nodes ‘Knowledge level’, ‘Expertise level’, ‘IS trustworthi-ness cal’ and ‘IS trustworthitrustworthi-ness Level’ in figure 3.
The resulting DAG using the NPC algorithm shows that there are relationships be-tween the three nodes: Escore(bi), Kscore(bi)and Tscore(bi). However, as we use a lim-ited data set in this example, it is not clear what the nature of this relationship is. The algorithm tells us that there is a direct relationship between the nodes Tscore(bi)and
Kscore(bi), and that there is a direct relationship either between the nodes Tscore(bi)and
Escore(bi), or between the nodes Kscore(bi)and Escore(bi). As described earlier, we as-sume independence between the knowledge and experience subnets and thus we choose to keep the direct relationship between the Tscore(bi) and Escore(bi) nodes. When it comes to the direction of the relationships, it is used to specify parent-child relations between the nodes in the DAG. Informally reasoning over the result and the assumed independence leads to the conclusion that Tscore(bi)is the parent node. This is also the result from structural learning from both the PC and the NPC algorithms. The same strategy was followed for the rest of the data sets from the example. Note that there are no utility or decision nodes in the resulting DAG from structural learning but that the resulting DAGs in the BBN topology presented in the following is built around utility and decision nodes. This is because the input data does not indicate any such constructs and so the utility and decision node constructs are introduced during the top-down ap-proach.
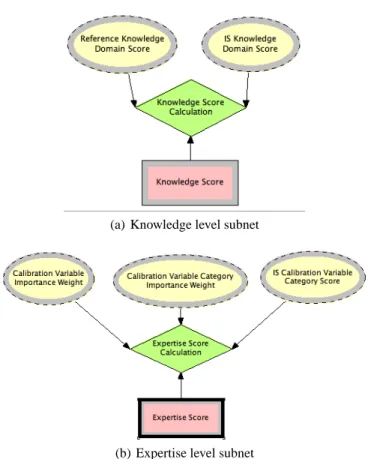
Figures 6(a) and 6(b) show the resulting networks for the knowledge and expertise level subnets taking both the top-down and bottom-up approaches into consideration.
(a) Using NPC algorithm
(b) Using PC algorithm
Fig. 4. DAG using structural learning algorithms in HUGIN
Subnets are connected based on the dependency they have on each other. Since we model calculations with some numbers and not with any state of any variable, we make some modification to the interpretation of the BBN nodes. Each observable node (represented with oval) represents an input variable from the models in Section 4 and are assigned values accordingly. The intermediate nodes are modeled as utility nodes, represented with diamonds in the figures, and are the formula evaluators. This means that each utility node uses the relevant equation from the models in Section 4 to express the relationship between its input nodes. Each target node, represented as a square in the figures, represents a variable whose value is to be computed by the intermediate node. This means the output variables of the respective models in Section 4.
Fig. 5. Data in input file
6
Example: Evaluating the Security Level of two DoS Solutions
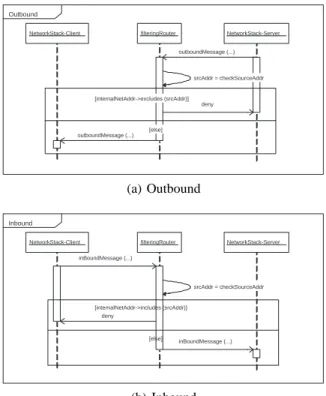
We now describe how to use our approach to evaluate the security level of two solutions for protecting against Denial of Service (DoS) attacks that can be launched at the user authentication mechanism of ACTIVE, an e-Commerce platform that was developed by the EU EP-27046-ACTIVE project [37]. Here, we evaluate two such mechanisms – a cookie solution and a filtering mechanism. The cookie solution adds a patch to the network stack software that keeps track of sessions and their states. It begins by sending a cookie to the client. If the client does not respond within a short period of time, the cookie expires and the client must re-start the request for a connection. If the client responds in time, the SYN-ACK message is sent and the connection is set up. Adding the cookie message makes it unlikely that an attacker can respond in time to continue setting up the connection. If the client address has been spoofed, the client will not respond in any event. The filtering mechanism works a bit differently. The filtering mechanism has an outbound and an inbound part, shown in Figures 7(a) and 7(b) respectively, that checks the source address (srcAddr) against a set of accepted source IP addresses stored in internalNetAddr. The filtering mechanism is implemented on the server side (usually on a firewall or an Internet router) and configured to block unauthorized connection attempts.
A decision maker (truster) A needs help to choose between the two security solu-tions. For this purpose A seeks guidance from a number of information sources regard-ing anticipated number of DoS attacks for the two solutions. In our example, we have five information sources; one honeypot [38] and four domain experts from a pool of 18 domain experts. The four domain expert judgments included was drawn randomly from the expert pool and denoted as b4,b6,b15,b18, and the honeypot is denoted by bhoneypot. (Note that to simplify the demonstration we choose not to include all 18 domain experts that we had consulted). These five information sources provide information on the an-ticipated number of DoS attacks for the two involved solutions to A. The truster A has complete trust in the abilities of ‘honeypot’ to provide accurate and correct information on the potential number of successful DoS attacks and therefore Tscore(bhoneypot) =1.
(a) Knowledge level subnet
(b) Expertise level subnet
Fig. 6. Knowledge level and expertise level subnets
Thus, no additional evaluation of the knowledge and expertise level is necessary for honeypot. Elicitation of expert judgments are done using a combined knowledge level and expertise level questionnaire as shown by Table 2.
6.1 Demonstration of the BBN Topology
In the first level of the BBN topology, we have five models which together are used to derive the knowledge score and expertise score, respectively.
Implementation of reference knowledge domain model
The reference knowledge domain score is on level 1 in the information flow process shown in Figure 2. Recall that the BBN topology must reflect this structure to ensure accurate information aggregation and propagation. Because all models on level 1 are independent, they can be computed in any order, and hence all score models on level 1 are implemented as series of subnets on the lowest level in the topology.
Figures 8(a) and 8(b) show the implementation of equations 4 and 5 respectively. Note, in the example, we only use one external source x1in X . Importance weights for
NetworkStack-Client filteringRouter NetworkStack-Server srcAddr = checkSourceAddr [internalNetAddr->excludes (srcAddr)] deny [else] outboundMessage (...) Outbound outboundMessage (...) (a) Outbound
NetworkStack-Client filteringRouter NetworkStack-Server
srcAddr = checkSourceAddr [internalNetAddr->includes (srcAddr)] inBoundMessage (...) [else] Inbound inBoundMessage (...) deny (b) Inbound
Fig. 7. Filter mechanism
the knowledge domains in the reference knowledge domain model, as given by x1, are denoted by the observable variables wKimp(1),wKimp(2), . . ., respectively for knowl-edge domain 1, 2 etc. Since we only have one stakeholder (external source) x1in X ,
WaggregatedKimp(X) =WallKimp(X) =WKimp(x1). As the knowledge domains are already normalized with each other, we have: Wre f KnowledgeDomainScore(X) =WaggregatedKimp(X) =
WKimp(x1)( fre f Knorm=1 as can be seen from Figure 9).
Implementation of information source knowledge domain model
Similar subnets as above are constructed for the information source knowledge domain model as defined by the equations 6 through 10. Figure 10 gives an overview of the resulting information source knowledge domain models and scores for the four domain experts.
Implementation of knowledge score model
The knowledge score is derived by combining the result from the reference knowl-edge domain score subnet and the information source knowlknowl-edge domain score subnet. This is done by a component-wise multiplication of the reference knowledge domain score by information source knowledge domain score using equation 11 from Section 4.1, and populated for each information source bi. Figure 11(a) shows the subnet that
Expert no.
Calibration variable Information provided
4 level of expertise medium
years of relevant of education Bsc years of experience from industry 0
role experience database, security management
6 level of expertise low
years of relevant of education Bsc years of experience from industry 0
role experience database
15 level of expertise high
years of relevant of education Bsc years of experience from industry 0
role experience designer, developer, security management
18 level of expertise low
years of relevant of education Bsc years of experience from industry 0.5
role experience developer
Table 2. The combined knowledge and expertise level questionnaire and the information provided
on the four domain experts
implements the above mentioned equation. Evaluation of knowledge score of the infor-mation source b4using the data in our example is shown in Figure 11(b). Note that the
Kscore(b4)1 refers to knowledge domain number 1 (security management), etc.
Implementation of information source expertise level model
The ‘expertise score’ of an information source bi is evaluated in a similar manner as ‘knowledge score’ of bi. Values obtained by an information source bifor each calibra-tion variable ljis implemented using a separate subnet. Then another subnet is used to aggregate the results obtained from these subnets to evaluate the expertise score of bi (equation 22). Since the illustrations are very similar to the above figures, we do not show them here.
Implementation of information source trustworthiness score model
The information source trustworthiness level is implemented as a utility and decision node in the top-level network shown in Figure 3. The trustworthiness score is dependent on knowledge score and expertise score which are calculated by two sets of subnets as described above. These subnets return the two scores through output nodes which, in turn, work as input nodes of the subnet implementing trustworthiness score. These two inputs, together with weight values k and e, derive the trustworthiness score. The corresponding subnet topology is shown in Figure 12(a), while Figure 12(b) shows the resulting trustworthiness score of information source b4(using equation 23) using the data from our example.
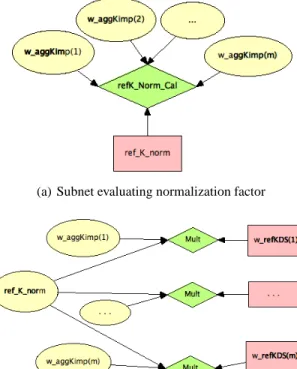
(a) Subnet evaluating normalization factor
(b) Subnet evaluating reference knowledge domain scores
Fig. 8. Subnets in reference knowledge domain model
Deriving the security level
Recall from the example description that each of the five information sources provides information on the number of DoS attacks for the two DoS solutions, s1=cookiesolution and s2=f iltermechanism. Figure 12(b) shows the resulting trustworthiness score with information inserted and propagated for information source b4(expert number 4 in the example). We can then derive and interpret the information from b4using the utility function ‘Security Level cal’ and the decision node ‘Security Level’ in the top level BBN (Figure 3). The same is done for all information sources, which eventually results in the “final” security level prediction.
In our presentation of the implementation we have shown an example-driven version of the topology, as well as presented only parts of the implementation. This simplified version is not ready for population of large amount of evidence and for use of several external sources X and Y , as well as dynamic and unknown amount of knowledge do-mains, calibration variables, and calibration variable categories. The complete version of the BBN topology is an aggregation of the top-down and bottom-up approaches, as described earlier. This means that the BBN topology can even be changed dynamically by structural learning when new empirical data are made available or when new insights into the relationships between the involved variables are gained. This may, quite
possi-Fig. 9. Subnet calculating normalization factor with information inserted for the example
bly, change the very foundation of our model over time. Thus, the learning capability is essential in that it makes our approach adaptable and dynamic. Evaluating security is challenging, and new insight will become available as more experience is gained. The benefit of our approach is that such eventuality can be countered for directly in the BBN implementation by feeding insights into the topology as empirical data, and using the structural learning capabilities to re-structure the topology whenever necessary.
6.2 Validation of Example Application Results
DoS attacks are becoming more sophisticated and hence increasingly difficult to detect and protect against. The attacks are often performed using legitimate protocols and services; the malicious activities differ from legitimate ones only by intent and not by content. Since it is hard to measure intent, many of the existing DoS solutions do not offer a proper defense. Many solutions are deployed on the network device level, such as the filtering mechanism described in this paper. However, filtering on the network device level has been demonstrated as being infeasible to deploy in an effective manner [39]. In fact, filtering against a defined legitimate or expect type of traffic may even contribute in completing the attacker’s task by causing legitimate services to be denied [39].
In [40] Karig and Lee gives an overview of common DoS attacks and potential coun-termeasures for DoS attacks. In this context, the filtering mechanism is categorized as a network device level countermeasure while the cookie solution is categorized as an OS level countermeasure. A network device level DoS solution provides measures to pro-tect against potential misuse of a communication protocol. Thus, the propro-tection is often on the IP or transport layer and hence there are possible ways around the mechanism, such as those discussed in [40]. The main shortage of filtering mechanisms are their inability to filter out spoofed packets [40]. There are, however, more efficient filtering mechanisms available, such as the one discussed in [41].
The other DoS solution discussed in this paper, the cookie solution, operates on the OS level. An OS level DoS solution integrates protection into the way a protocol is im-plemented in a particular operating system. Thus, the measure is deployed on the source
Fig. 10. Information source knowledge domain scores for b4, b6, b15, and b18
(target) and refers to a host-based protection solution. Hence, the cookie solution repre-sents a more defense-in-depth DoS solution than the filtering mechanism. Furthermore, the cookie solution discussed in this paper is a SYN cookie, which has been well tested and is well understood. SYN cookies have also been incorporated as a standard part of Linux and Free BSD and are recognized as one of the most effective DoS mechanisms [42].
In general, a DoS solution should be effective, transparent to existing Internet in-frastructure, have low performance overhead, be invulnerable to attack aimed at the defense system, be incrementally deployable and have no impact on the legitimate traf-fic [39]. The filtering mechanism is somewhat effective in stopping attacks on the spot. It is not transparent to existing Internet infrastructure and results in some performance overhead. The filter mechanism can also be vulnerable to attacks due to its scanning of each packet and hence may have impact on legitimate traffic. However, the mecha-nism can be incrementally deployed. The cookie solution is documented to be effective against DoS attacks, but has been demonstrated to be somewhat unable to detect and prevent against zombie attacks. The mechanism is transparent to the network infrastruc-ture, but leads to some performance overhead, but in practice no impact on legitimate traffic. The cookie solution is already included in some operating systems and is easy to deploy. Thus, we can conclude that the cookie solution is a better choice than filtering mechanism for DoS attacks. Our trust-based information aggregation approach shows that the cookie solution is approximately 2.76 times better than the filtering mechanism.
(a) Evaluation of knowledge score
(b) Knowledge score of information source b4
Fig. 11. Subnets involved in calculating Kscore
7
Discussion
Evaluating the security level or security of a system can be done in many ways. Exam-ples include qualitative risk assessment and security evaluation techniques using stan-dards such as the Common Criteria, and ad-hoc security assessments or judgments. For the most part, these assessments are subjective since these are essentially opinions of experts. Risk assessment of a typical size system of medium complexity is, in general, estimated to involve approximately 200 hours of work. This number is not derived from scientific experiments; rather it is the opinion of one of the authors who has more than15 years of experience providing risk assessment and security evaluation consultancy ser-vices to the industry. It is also based on anecdotal evidence and experience of colleagues of the authors. It is hard to get an exact cost and effort calculation for such activities, so one may question its soundness, as it is merely a best effort estimate based on ex-perience from the industry. In Norway, for example, where one of the authors work, an evaluation according to the Common Criteria for EAL 4/4+ has an estimated cost of 1.5 million NOK (approximately 250,000 USD). Traditional security evaluation is also time consuming. For small systems, 2-3 days are needed to derive a good estimate/opinion. This limits the ability to carry out risk assessments and rules out the use of any formal security evaluation. This has been the primary motivation for our approach.
Two of the main challenges in the security evaluation process that contribute sig-nificantly to its cost and efficiency are (i) how to gather relevant information within a
(a) Subnet evaluating trustworthiness score
(b) Subnet for computing the trustworthiness score of infor-mation source b4
Fig. 12. Subnets involved in calculating Tscore)
short time frame and make best use of it, and (ii) how to aggregate in a sound manner across both empirical data and expert judgments. In our opinion, the second challenge is the most critical and time consuming and hence has been the focus of this work. In-stead of manually performing this aggregation, we have proposed an approach that is automated for the most part. Hence, it is more cost effective and efficient than tradi-tional approaches. In addition, since it is the sources and not the information that are evaluated, such evaluations can be reused. This (reusability) makes our approach effec-tive and enables it to scale as the complexity of the problem context and the number of information sources grows.
A related challenge is how to ensure that the information collected in true. This is a major challenge in risk assessment and security evaluations, as subjective evaluations are involved. It is hard to assess whether humans provide accurate information and it is hard to assess other sources as well, owing to false positives and the inability to calibrate the information provided. There is nothing firm (observed facts) to calibrate against. However, in our approach we calibrate information sources according to knowledge of relevance to the particular security level evaluation case and the expertise of information sources. We implement our model as a BBN topology, enabling the reasoning with uncertain information. BBN is based on the Bayesian or subjective interpretation of probability, where there does not exist a true value but only beliefs. The goal then is to assess whether the beliefs are reasonable and accurate. We do this by introducing