Business Education Innovation Journal
VOLUME 6 NUMBER 1 June 2014Contents
Page
2
Introduction3
Editorial Review Board4
Journal Information4
Subscriptions and Cabell’s Listing5
Book Review: Great Leaders Grow: Becoming a Leader for LifeReviewed By Brenda Hayden-Sheets, Murray State University, KY
7
A New Perspective on Teaching Process Variation CausesLifang Wu, Xavier University, OH
13
Using Infographics as an Integrative Higher-Order Skill Development Assignment in Undergraduate Leadership InstructionAnn L. Saurbier, D.M., Walsh College, Troy, Michigan, USA
24
Mapping Bridges to Creative CollaborationStaci R. Lugar-Brettin, Indiana Institute of Technology - Fort Wayne, Indiana, U.S.A.
27
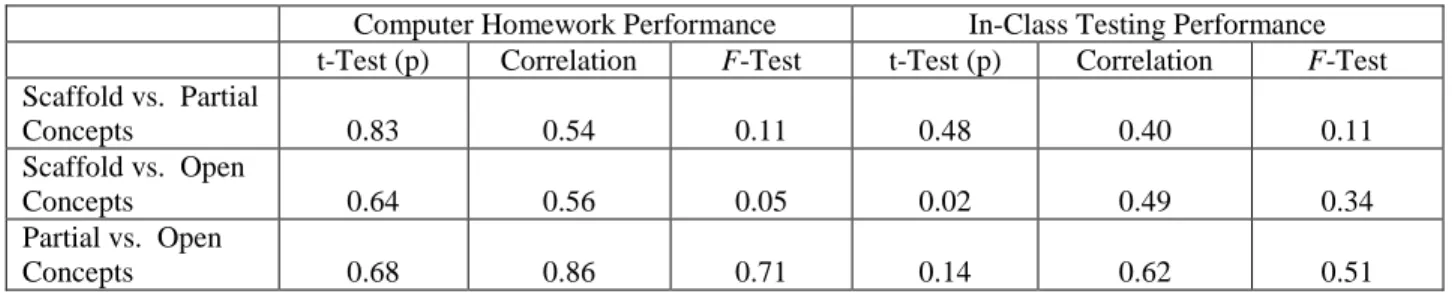
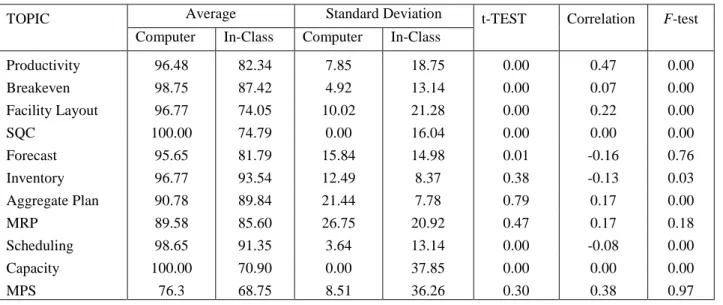
Comparing Different Testing Formats for Graduate Student Performance onComputer-Managed Homework versus In-Class Performance
Lynn A. Fish, Canisius College, 2001 Main Street, Buffalo, NY, USA 14208
37
Unsustainable Supply Chains: Using “The Story of Stuff” in the Business Classroom Girish Shambu, Canisius College, Buffalo, New York, USA41
The Role of Performance Feedback in the Transfer of Teamwork Skills Thomas L. Rakestraw, Jr. Youngstown State University, Ohio, USA48
Using Socratic Pedagogy to Deliver Undergraduate Business Education©Peter Geoffrey Bowen, Ph.D., Daniels College of Business, The University of Denver
57
Name the Game: Teaching Students How to Ethically “Bargain with the Devil”Edward G. Wertheim, D’Amore-McKim School of Business, Northeastern University-- Boston, MA, USA
66
Back to the Future:Experiencing History to Demonstrate Teambuilding Methods in an MBA Class William C. Sharbrough III, The Citadel, South Carolina, USA
Michael J. “Mick” Fekula, The Citadel, South Carolina, USA
76
Manuscript Guidelines, Submission and Review ProcessIntroduction
Welcome to this issue of the
Business Education Innovation Journal.
The purpose of this journal is to assemble researched and documented ideas that help drive successful learning and motivate business students to learn. The intention is to draw ideas from across both methods and disciplines and to create a refereed body of knowledge on innovation in business education. As a result, the primary audience includes business education faculty, curriculum directors, and practitioners who are dedicated to providing effective and exciting education.
We invite you to read about innovations published and apply in your classroom. We also encourage you to develop your original creative ideas, prepare an article, and submit for review.
This particular issue includes a number of interesting classroom innovations in diverse areas.
Peter J. Billington Editor
Content Verification: The ideas presented in the journal articles are not tested nor verified for accuracy, quality, or value. The opinions and claims expressed in the articles are those of the authors and do not represent a position or opinion of the editor or staff of the Business Education Innovation Journal.
No responsibility is assumed by the Editor or Publisher for any injury and/or damage to persons or property as a matter of product liability, negligence or otherwise, or from any use or operation of any methods, products,
instructions or ideas contained in the material in this journal.
Business Education Innovation Journal
www.beijournal.comISSN 1945-0915
Business Education Innovation Journal is an imprintof Editor
Peter J. Billington
Colorado State University – Pueblo, CO [email protected] Editorial Review Board
Dirk Barram
George Fox University, Newberg, OR J. Brad Gilbreath Colorado State University – Pueblo, CO James H. Browne
Professor Emeritus, Colorado State University – Pueblo, CO
Uma Gupta
State University of New York (SUNY) at Buffalo State Maryann Billington
Action Leadership Group, Colorado Springs, CO
J. Andrew Morris
California State University – Channel Islands, CA Jose Castillo
Truman State University, Kirksville, MO
Kristie Ogilvie
California State University at San Bernardino Jui-Kuei Chen
Tamkang University-Dansui Campus, Taipei, Taiwan
Ramanjeet Singh
Institute of Management and Technology, Chandigarh, India
Steven I-Shuo Chen Trinity College Dublin, Ireland
Jamie Slate
Catawba College, Salisbury, NC Michael J. Fekula
The Citadel, Charleston, SC
Alice Valerio
De La Salle University-Dasmarinas, Philippines Lynn A. Fish
Canisius College, Buffalo, NY
Stuart H. Warnock
Metropolitan State University of Denver, Denver, CO Kelly Flores
City University of Seattle, WA
Marsha Weber
Minnesota State University Moorhead, Moorhead, MN Lifang Wu
Xavier University, Cincinnati, Ohio
Susan K. Williams
Northern Arizona University, Flagstaff, AZ Femi Ademiluyi
Osun State Polytechnic, Iree, Osun State, Nigeria
Ed Wertheim
Northeastern University, Boston MA George G. Kelley
University of Phoenix
Michael Kraten
Business Manager, Graphics, Design, and Production Drew C. Billington
Submissions - [email protected] Subscriptions - [email protected]
Add or remove from our mailing list - [email protected] Write in “add” or “remove” in the topic line.
Webmaster - [email protected] Elm Street Press
6660 Delmonico Drive, Suite D 232, Colorado Springs, CO 80919-1899
Subscriptions
For subscriptions to Business Education Innovation Journal, please email: [email protected].
Subscription Rates:
Destination Individual * Institutional Back Issues Individual
Back Issues Institutional United States
Countries other than the U.S. $25 $50
$50 $100
$15 $30
$30 $60
* Published authors are entitled to a free issue of the Journal in which their article is published.
Business Education Innovation (BEI) Journal © 2010 by Elm Street Press (ISSN 1945-0915) BEI Journal is published two times per year or more, based on submission volume.
Authorization for use of derivative works or to photocopy items for internal, personal or any other use as well as requests for multiple reprints will be priced and granted by the publisher ([email protected] ).
Use of information in the articles and journal are governed by U.S. national copyright laws. No claims for missing issues will be processed after two months following the month of publication of the issue. Send author inquiries to [email protected] .
Postmaster: Please send address changes to Elm Street Press, 6660 Delmonico Drive, Suite D232, Colorado Springs, CO 80919-1899.
Listings and Indexing
Business Education Innovation Journal
is listed in the most recent on-line edition of
Cabell's
Directory of Publishing Opportunities in Management.
www.cabells.com
Full text article access of the journal is available from EBSCO and the journal is indexed in
EBSCO’s databases.
Book Review:
Great Leaders Grow: Becoming a Leader for Life
Reviewed by Brenda Hayden-Sheets
Murray State University, KY
Title: Great Leaders Grow: Becoming a Leader for Life Authors: Ken Blanchard and Mark Miller
ISBN: 978-1-60994-303-5
Pages: 128
Cost: $22.95
Publisher: Berrett-Koehler Publishers, Inc.; San Francisco Edition: First Date Published: 2012
ABSTRACT
Authors Blanchard and Miller track the developmental steps of their Blake Brown as he grows to become a selfless leader. Blake’s mentor, Debbie Brewster, guides him in the fundamentals of leadership through the GROW model: “G” represents “Gaining Knowledge” about oneself, others, one’s industry; “R” translates as “Reaching Out to Others”; “O” means “Opening Your World” at work and outside of work to learning experiences; and “W” equates to “Wisdom,”—the essence of the G-R-O in becoming a leader. As a recognized leader in his company, Blake guides his troubled company to also develop according to the GROW model.
Book Review of Great Leaders Grow: Becoming a Leader for Life
The narrative begins with Blake, a 22 year-old college business student, grieving over the unexpected death of his father who was a prominent leader in the community. Understanding Blake’s sense of loss, Debbie Brewster, a protégé of Blake’s father for 10 years, in turn, offered Blake her services as a mentor. As the authors chronicle Debbie’s guidance of the young man into becoming a leader, the readership finds itself vicariously living through Blake’s experiences as they, too, may aspire to become leaders.
To lead Blake in promoting his identity and building self-confidence, Debbie asked him to review his strengths and weaknesses. Through their discussion, he realized that accepting past mistakes was a means of learning from them. Debbie noted, “That’s one of the things leaders do extremely well” (p. 10).
As Blake’s focus turned to finding a job after graduation, he questioned why a company that he recently visited chose several employees to interview him. Debbie took this opportunity to encourage Blake to think about sound decision-making, whether it was for satisfying a potential employer, a potential employee, or anyone searching for a solution. Their conversation clarified his understanding of a company’s decision making process, in this case, determining whether he was the best candidate for the position. The company defined the need for a new employee, determined criteria the new hire must meet, evaluated the candidates with the greatest potential, and finally, through a joint effort of several employees, would choose the ideal candidate. Blake reflected upon the goal of making a good choice “is … the most important decision a leader makes” (p. 19).
Blake gained another lesson on leadership during his interview with the president of the company. Noticing rows of books in the president’s office, Blake asked the president why he needed all the books when he already had achieved the highest position in the company. The response was “My capacity to learn determines my capacity to lead. If I stop learning, I stop leading” (p. 27). Blake grasped the point that leaders have a continuous need to grow in knowledge and understanding.
When Blake accepted the position for which he interviewed, Debbie introduced him to the GROW Model, a guide he could use throughout life to build his career. The “G” in the acronym of GROW represents “Gain Knowledge,” of self, of others, of one’s industry, and of leadership in one’s role as an employee. Blake applied this skill in the workplace around him as he listened to conversations of managers, employees, and customers regarding work-related issues. By listening, he learned the company was losing customers to its competitors and falling behind, leaving employees fearful of being fired.
When Blake and Debbie later met, he revealed the company’s poor performance and expressed his desire to help. Debbie addressed the “R” in GROW,--“Reaching Out To Others,” inside and/or outside the company. As Blake engage in this step, he was able to assemble various perspectives, knowledge, and skills that could potentially solve the company’s problems.
Blake proposed to his supervisor the formation of a cross-functional team composed of departmental representatives. The team was soon approved. With Blake’s guidance, team members shared knowledge of problems in each of their departmental areas. They also interviewed senior leaders, along with disgruntled customers, to learn their perspectives of the company’s performance. The team’s findings indicated the company was negligent in operations and lacked good customer service.
Blake processed the findings, wrote a set of recommendations, and prepared a summarized presentation for delivery to senior management.
At Blake’s next encounter with Debbie, she referenced the “O” of the GROW Model and explained it represented “Opening Your World” to opportunities which promoted professional and personal growth for a leader. Some of the opportunities might include shadowing someone, having lunch with someone different each day, traveling to different countries, and/or engaging in sports or hobbies. One of Blake’s earliest applications of “Opening Your World” was his volunteering to serve as a counselor at a youth camp which enriched his perspective of balancing life with business.
In another visit with Debbie, Blake learned the meaning of the “W” in the GROW Model translated to “Walk Toward Wisdom” and defined as the “application of knowledge, discernment, insight, experience, and judgment to make good decisions when the answer may not be obvious” (p. 96). Wisdom was the cumulative result of “G”aining knowledge, “R”eaching out to others, and “O”pening up to experiences.
Debbie explained wisdom involved 1) self-evaluation and a focus on the truth about oneself, another, or organization; 2) honest feedback from others; 3) counsel from others; and 4) time—the pursuit of wisdom continues a lifetime.
At the workplace, Blake internalized the elements of wisdom while he delivered his part of the team presentation to management. The president of the company asked what was it that caused the company to get into trouble. When no one responded, Blake answered with wisdom, “We’ve not helped our leaders or our organization grow sufficiently to meet the changing demands of our world. We got caught providing yesterday’s answers to today’s problems” (p. 105). The president privately thanked Blake for his honest assessment and said, “You showed courage … [an] essential attribute for a leader” (p. 106). He appointed Blake to serve on a team to “ignite a culture of growth at [the company]. The place we’re going to start is to help the leaders in this organization GROW” (p. 107).
Blake had become a leader who served others. Although conceding he had much to learn, he accepted the challenge to continue to grow as a serving leader to guide the organization from a struggling company to one of high performance.
A New Perspective on Teaching Process Variation Causes
Lifang Wu, Xavier University, OH
ABSTRACT
Process quality variation causes are among the most important concepts covered in operations management courses. In this paper we present and discuss how the definitions of variation causes in popular operations management textbooks often create confusions for students. We specifically analyzed the applicability and limitations of different restrictive terms used to define variation causes. A new teaching approach is then proposed in the paper to help students understand the variation causes and their relative distinctions.
Keywords: Process variation, common causes, special causes, SPC, teaching INTRODUCTION
Process quality control is an important topic covered in operations management (OM) or related courses. All processes that provide a good or a service surely exhibit a certain amount of variation in their output. The central problem in management is failure to understand the information in variations (Deming 1985). In the literature, common or natural causes are normally defined as the purely random, unidentifiable sources of variation that are unavoidable with the current process. Specifically, common causes include those small, inherent causes interacting with each other complicatedly to create consistent and stable overall process variations which cannot be predicted, identified, controlled, or avoided (Finch 2008, Montgomery 2005, Cachon and Terwiesch 2013, Krajewski et al. 2013, Heizer and Render 2013, Jacob and Chase 2011, Stevenson 2010). For example, the common causes may be the result of the type of equipment used to complete a process. A process that is operating with only common causes present is said to be in statistical control.
The other type of variation cause is called special or assignable causes, referring to sources that are not inherent in the process, appear sporadically, and disrupt the random pattern of common causes. The special causes are normally due to the wrong-doings associated with the process input and procedures which are not accepted as a normal part of the system. For example, special cause variability usually arises from three sources: improperly adjusted or controlled machines, operator error, or defective raw material. Such variability is generally large when compared to the background noise, and it usually represents an unacceptable level of process performance (Montgomery 2005, Collier and Evans 2010, Boyer and Verma 2009, Finch 2008). A process that is operating in the presence of special causes is said to be out of control.
To identify these variation causes, Walter Shewhart is credited with developing the control chart to separate the common and special causes of variation. Special cause variation tends to be easily detectable using statistical methods such as statistical process control (SPC) charts because it disrupts the normal pattern of measurements. Therefore special causes can be identified and prevented or at least explained and understood. Keeping special cause variation from occurring is the essence of quality control. A process that is in control does not need any changes or adjustments (Collier and Evans 2013).
As understanding the variation causes is essential for managing any quality control system (Evans and Lindsay 2005), a number of in-class experiments have been developed to help students distinguish special causes from common causes in certain situations (see Neureuther 2006, Fish 2007, Gaffney and Hays 2007, Chow et al. 2008, and Johnson 2011). However, while students may see what variation causes are in some cases, there is still much confusion around the general concepts of common and special causes. It is interesting to note that even today the most popular OM textbooks still do not provide clear enough definitions on variation causes to help students understand these terms effectively and efficiently.
CONFUSIONS
illustrate the issue, we propose two separate processes A and B (can be the same type of manufacturing process, belonging to two different firms), assuming A is performing at 4 sigma level, B operates at 2 sigma quality level, and both processes are in control (suppose A produces high end products and B produce low end ones). Surely there are only common causes present in both processes. However, process B has bigger system variability due to reasons of having more influential common causes (e.g., having older machines). In this particular example, students can often be confused by the following issues occurring during their learning process:
1. In any production process, regardless of how well designed or carefully maintained it is, a certain amount of inherent or natural variability always exists. Common causes affect every production process and are to be expected. This statement seems that the common causes are causing the minimal level of reasonable variations which cannot be eliminated and every process should expect to carry, for example, background noise type of variations carried by a 6-sigma process. However, in the above example, process A or B obviously contains much more variations than a 6-sigma process. If common causes are indeed purely random and unavoidable, why are some common causes for B avoidable to A? Since these common causes do not exist in process A, they are not really inherent. In fact, they can be identified and avoided, which somehow conflict with our earlier definitions.
2. In the literature the common cause variability or “background noise” is said to be the cumulative effect of many small, essentially unavoidable causes. The common causes are those countless minor factors, each one so unimportant that even if it could be identified and eliminated, the decrease in process variability would be negligible. If eliminating common causes cannot reduce process variability, then an in-control process cannot be improved for sure. Then, how an in-control 2-sigma process (like B) can be improved to 4-sigma level (like A)?
3. Some texts we surveyed also state a process in control does not need any changes or adjustments. This makes some students believe that “in-control” status represents kind of perfect or ideal quality performance people want to reach. However, this seemingly conflicts with the continuous improvement paradigm or Kaizen. What does it really mean for that “not need any changes” statement? Does that mean an in control 2-sigma process like B does not need any changes or adjustment to provide better output?
4. If common causes create the pure randomness of the system and we do not know what they are and how they interact with each other, how do we know they are inherent to the process? How do we know their characteristics such as small or unavoidable? Why can’t common causes be created by some exterior factors which we do not know?
DISCUSSIONS
We found that many restrictive terms are used to define common causes in almost all popular OM textbooks we reviewed, including purely random, small, inherent, unavoidable, natural, and unidentifiable. In Merriam-Webster dictionary, random means chosen, done, etc., without a particular plan or pattern. Common causes result in constant variation reflecting pure randomness in the process which cannot be predicted. The pure randomness is the result of lack of information or knowledge, particularly, missing information about common causes and their direct operational impact. The word random describes the process behavior if we do not know the underlying causes. As such, random is a relative term. It has different meanings to different people, depending on the amount of information they possess. Further, common causes are defined to be inherent in the current process while special causes are not. As a result, specifying what a process really is in the first place is critical to defining the so-called common and special causes. Before speaking about common or special causes, one has to define what constitutes a process, what product the system produces, what inherent elements are, and what are possible external elements which should not be in the process.
Are common causes really small, unavoidable, and unidentifiable?
They can be due to the complex interactions of elements such as materials, tools, machines, operators, and the environment therefore are expected for all processes.
However, common causes are not just limited to background noises. According to Deming (1986), we shall speak of faults of the system as common causes, and faults from fleeting events as special causes. The common causes of variation also include poor design of process or product, inputs or procedures not suited to the high requirements, poor light, etc. Common causes are a result of the design of the product and production system and generally account for about 80 to 95 percent of the observed variation in the output of a production process. Therefore, common cause variation can only be reduced if the product is redesigned, or if better technology or training is provided for the production process (Evans and Lindsay 2005). In other words, many common causes can be identified and eliminated by redesigning the product or improving the process. As such, some of the restrictive terms used for defining common causes, including unavoidable and unidentifiable, may not be true in all circumstances. The definition of common cause largely depends on how the process is defined. As we demonstrated early, even for the same type of production processes, the amount of inherent common cause variability differs from one process to another. For instance, older machines generally exhibit a higher degree of natural variability than newer machines. If the process operator admits the older machines as an inherent part of the system, then the old machines are considered and accepted as common causes which are constantly influencing the process output in a consistent and stable way. Although the higher degree of variability is caused by excessive common causes, the process (if only containing common causes) is still considered to be in statistical control. On the other hand, this again does not mean common causes can never be identified or eliminated, nor is it small. In the above case, if the operator compares the old machine process with another one equipped with new machines, it is evident that the higher degree of common variability is caused by the older machines.
Now, if the older machines are not perceived as an inherent part of the process, then the conclusion would be quite different. In this case the old machines are seen as something in the process being wrong and should be fixed or replaced. The resulting high degree of variability is not considered as an inherent part of the process, thus it is caused by special causes. Special causes often have their origin in single variables, making diagnosis easier (Gryna 2001). The older machines as a special cause in this example must be identified and eliminated. That is, to either fix or replace the old machines with new ones. As a result, one particular quality cause can be a common cause to process B, and the same cause can be a special cause to process A, all depending on how the normal system or process is defined.
Small is another popular term used to describe common causes. We admit that many common causes (e.g., background noises) are small. However, some other common causes such as the older machines are not small individually. Collectively, common causes generally account for about 80 to 95 percent of the observed variation in a process, which is not small at all. Now we clearly see when the existing definitions do not work in certain scenarios.
Overall, common causes can be identified and reduced only if better technology, process design, or training is provided (Collier and Evans 2013). In other words, common causes can be possibly identified with new technology or new process design. To give another example, in most service industries, customers might have to wait in line before being served and the waiting time is purely random and unavoidable. However, much of the waiting time can be avoided if the service process is redesigned (e.g., appointment system and other incentives are used) to ensure system synchronization. That means, under the new system, many of the influential common causes of the old system can be identified and avoided.
If a common cause to process B can be a special cause to process A, can SPC charts still detect that special cause for A?
extrusion machine would be likely to change the process output distribution thus can be detected by SPC charts. When abnormality in SPC chart is found for a given process, it is almost certain that special causes are present hence the process is out of control (the exception is the so-called type I error). However, in theory, there could be some special causes which are relatively small, produced from external sources, and do not produce identifiable pattern change. Therefore, the SPC charts may not identify them and they can be better classified as common causes (but not an inherent part of the process). One needs to remember, if only SPC charts are used, common causes are indeed unidentifiable, unavoidable, and cannot be eliminated.
Now, suppose the older machine is the common cause for process B (2-sigma process), and it is the special cause for process A (4-sigma process). It is easily understandable that the SPC charts for process B will not identify the related old machine common causes, as we expected. Can SPC charts detect the same cause as a special cause for process A? The answer is definitely yes, in fact, since the old machines will consistently impact the process output distribution, SPC charts will detect this special cause in no time.
Does an in-control process need change or further improvement?
Typically, being in control only means the process is statistically stable without special causes. Since a significant portion of the variation is caused by common causes collectively, an in-control process does need further improvement in many cases. The objective of many process improvement projects is to "assign" changes in process behavior to causes and then to prevent them from recurring in the future (Cachon and Terwiesch 2013). Common causes are naturally part of an existing process, but that does not mean they cannot be identified or eliminated. In fact, six sigma methodologies like DOE can be effectively used to identify the cause(s) behind typical quality problems including common cause variations. As long as the cause can be assigned, this previously unknown common cause (most likely not background noises) can be defined and converted into a special cause if they reoccur in the new process.
A common fault in the interpretation of process variations, seen everywhere, is to suppose that every event (defect, mistake, accident) is attributable to someone (operator or worker), or is related to some special cause which SPC tools can help solve. The fact is that most troubles with service and production lie in the system (Deming 1986). The faults of the system are common causes (Deming 1956). Further, the common causes are the responsibilities of the management. In fact, according to Deming, 94% of the troubles and possibilities for improvement belong to the system (responsibility of management), and 6% are special causes which are local fleeting events (employees are probably responsible for). People may formulate two sources of loss from confusion of special causes with common causes of variation. For example, ascribe a variation or a mistake to a special cause when in fact the cause belongs to the system (common causes), and ascribe a variation or a mistake to the system (common causes) when in fact the cause was special (individual’s mistake). Therefore, over-adjustment and under-adjustment (never doing anything to try to find a special cause) are typical examples of the mistakes.
The action required to find and eliminate a special cause is totally different from the action required to improve the process and eliminate common causes (Deming 1986). Using SPC charts to eliminate special causes only allows bringing the process back to a stable status. It is the management’s ultimate responsibility to eliminate common causes to improve the overall process performance, for instance, via process redesign or product upgrade (Meyer 1993). Lean Six Sigma is said to be one of the most successful methods in history for integrating known statistical methods into a novel initiative to reduce process variability (Hoerl and Snee 2010).
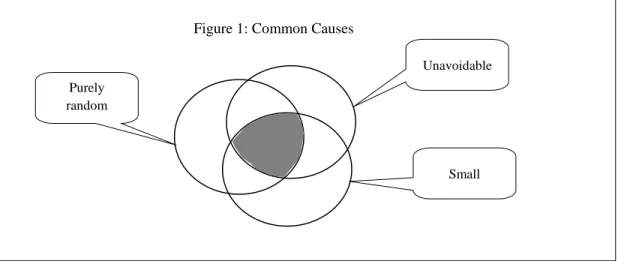
Are non-common causes actually special causes?
From Figure 1, it appears some purely random but avoidable causes do not belong to the common cause category. From the definition of special causes, they are not special causes as well since they cannot be clearly identified. As a result, non-common causes (meeting some common cause requirements but not all) are not necessarily special causes. This can create confusions in classroom environment. In particular, incorporating many restrictive properties in defining variation causes with no context explanation might produce imagination space for other causes belonging to neither common nor special causes. In order to support SPC use, non-common causes must be special causes for sure. We apparently need a much clearer approach to define and teach these extremely important terms.
Can we present variation causes in a clearer way?
While the line between common and special causes might be murky in many cases, SPC charts as a scientific tool can always provide a definite answer about process behavior (in or out of control). When we say a process only contains common causes we do not imply the common cause concept is still debatable. In particular, we argue that the definitions of common and special causes must be (1) consistent with what SPC charts can do; (2) clear and easy to comprehend to business students.
In theory what SPC does is to detect occasional abnormality which is not an original part of the process. All the underlying causes behind this abnormality are called special causes, including event-based operator error, procedure mistakes, tool wear, etc. Apparently they must be (1) significant enough to disrupt the process distribution so it can be detected by SPC; (2) the causes are event-based, meaning not an inherent part of the process. Everything else should be called common causes which include background noises, unknown system interactions, and other inherent variation causes (in theory, common causes can also include those event-based operator mistakes which do not produce detectable variations). Note some common causes (like background noises) are purely random, unavoidable, and unidentifiable. Other types of common causes may not necessarily possess all of these properties. When introducing them, more contextual information is needed to avoid much of the above said confusions. In fact, the distinction between common and assignable causes is not a universal truth. It does depend on the degree of knowledge of the observer and a few other things (e.g., how the process is defined). We argue it would be a better approach to introduce in-control and out of control status and SPC concept first, then present definitions of common causes and special causes.
We further proposed to use a simple Excel based simulation excise to assist SPC teaching. The benefits of using computer simulation is the associated time efficiency, as reported in the literature, most of the in-class SPC excises take 40+ minutes. We formulate the following three processes where 20 samples are taken to construct SPC charts (we used P-chart for simplicity purpose):
Process A is performing at 4 sigma level or any higher sigma level (with new machines).
Process B operates at 2 sigma quality level or any lower sigma quality level (having older machines).
Process C is basically a combination of A and B. Among 20 samples from C, 16 are produced by new machines and 4 are produced by older machines (the new machines are becoming old).
Figure 1: Common Causes
Purely random
Unavoidable
We use random number generator to simulate these three processes. Surely there are only common causes of variations present in processes A and B thus SPC will tell both of them are in control. For C, the result is quite different. If we assume that old machine as an inherent part of the process (common causes), the process is most likely in control (using its own control limits). The process is clearly out of control if we assume the older machine should not be part of the process, thus we use the control limits for A to judge if process is out of control. Here process C is an extensional version of process A and the older machines are considered as special causes. This exercise takes no more than 10 minutes to run, and can give students clearer picture about some of confusing distinctions between common and special causes.
CONCLUDING REMARKS
Common and special causes are among the most fundamental concepts to be taught in an operations management class. However, the way they are defined in most existing textbooks can potentially result in learning confusions. While useful to define some specific common causes, using multiple restrictive terms to define the general concept of common causes can create potential conflict and leaning difficulties. After reviewing many popular OM textbooks, we systematically analyze the potential learning issues, make the relevant clarifications, and propose a new way to present the concepts, including a simple time-saving simulation exercise. We hope this paper will shed some light on developing better approaches for teaching SPC in OM courses.
REFERENCES
Boyer, K. and R. Verma, (2009). Operations and supply chain management for the 21st century (1st Edition), Mason, OH: South-Western College Pub.
Cachon, G. and C. Terwiesch, (2013). Matching supply with demand: An introduction to operations management (3rd Edition). New York, NY: McGraw-Hill/Irwin.
Collier, D.A. and J.R. Evans, (2013), OM (4th Edition), Mason, OH: South-Western Cengage Learning.
Chow, A.F., J.C. Howard, and N.J. Lambe. (2008). Teaching variation using an interactive classroom activity. Decision Sciences Journal of Innovative Education, 6 (2), 305–311.
Deming, W.E., (1956). On the use of theory. Industrial Quality Control, Vol. 8, No. 1, pp.: 12-14.
Deming, W.E., (1986). Out of the crisis. Boston, MA: Massachusetts Institute of Technology, Center for Advanced Engineering Study. Evans, J.R., and W.M. Lindsay. (2005). The Management and Control of Quality. (Sixth Edition), Mason, OH: Thomson South-Western. Finch, B.J., (2008). Operations now: Supply chain profitability and performance (3rd Edition), New York, NY: McGraw-Hill/Irwin.
Fish, L.A. (2007). Statistical quality control: Developing students’ understanding of variable control charts using string. Decision Sciences Journal of Innovative Education, 5 (1), 191–196.
Gaffney, R.L., and Hays, J.M. (2007). Sweet control charts and process capability. Decision Sciences Journal of Innovative Education, 5 (2), 397–404.
Gryna, F.M., (2001). Quality planning and analysis: From product development through use (4th Edition), New York, NY: McGraw-Hill / Irwin. Heizer, J. and B. Render, (2013). Principles of operations management (11th Edition), Upper Saddle River, NJ: Prentice Hall.
Hoerl, R.W., and R. Snee. (2010). Statistical thinking and methods in quality improvement: A look to the future. Quality Engineering, 22, 3, 119-129.
Jacobs, F.R. and R.B. Chase. (2011). Operations and supply chain management. (13th Edition). New York, NY: McGraw-Hill/Irwin.
Johnson, D.J. (2011). Using paper helicopters to teach statistical process control. Decision Science Journal of Innovative Education. Vol. 9, No. 2, pp. 299-306.
Krajewski, L.J., L.P. Ritzman, M.K. Malhotra. (2013). Operations management: Processes and supply Chiains (10th Edition). Upper Saddle River, NJ: Prentice Hall.
Meyer, R.S., (1993). Common causes and special causes: Who is threatened by Deming – labor or management? Labor Law Journal, October, pp. 620-625.
Montgomery, D.C., (2005). Introduction to statistical quality control, Hoboken, NJ: John Wiley & Sons, Inc.
Neureuther, B.D., (2006). Conceptualizing variation and control chart theory. Decision Science Journal of Innovative Education, Vol. 4, No. 1, pp. 147-151.
Stevenson, W.J., (2010). Operations management (Tenth Edition), New York, NY: McGraw-Hill/Irwin.
Using Infographics as an Integrative Higher-Order Skill Development
Assignment in Undergraduate Leadership Instruction
Ann L. Saurbier, D.M., Walsh College, Troy, Michigan, USA
ABSTRACT
In addition to the development of disciplinary competence, it is necessary for post-secondary students to develop the skills required for success as well. The addition of problem-based, project-centric, open-ended learning environments may enable the simultaneous development of not only the disciplinary competence but also the higher-order skills necessary for workplace success. This article explores the use of infographics in an undergraduate leadership course as a means to develop simultaneously this suite of competencies.
Keywords: 21st higher-order century skills, open-ended learning, information visualization, INTRODUCTION
The Information Age has fundamentally redefined the nature of work at all levels (Spires, 2008). Tracing the evolution of skills necessary for success in the workplace, Allred, Snow, and Miles (1996) contrasted the dominance of technical competency, necessary in 20th century bureaucratic organizations, with the Information Age requirements of both technical and collaboration skills. There is however wide variety in the classification and categorization in these skills. Fleming (2008) indicated skills necessary for success in the 21st century workplace include teamwork, reasoning, technological, as well as employability skills, whereas Erickson (2010) noted compelling inquiry, collaboration, an appreciation for both complexity and diversity, as well as sharing the corporate identity skills should dominate. Further, Tapscott and Williams (2010) stated the ability to locate, assess, synthesize, and apply research in the organizational context were skills that led to enhanced organizational problem-solving, collaboration, and communication. Though there is debate over the exact taxonomic classification of these skills, and whether these skills are indeed new or not, there is less debate on the necessity of these skills as an element of workplace success (Tapscott, 2009). Salpeter (2008) stated:
“students need to know more than core subjects. They need to know how to use their knowledge and skills – by thinking critically, applying knowledge to new situations, analyzing information, comprehending new ideas, communicating, collaborating, solving problems, and making decisions.” (p. 1)
As a result, one of the key skills necessary for success in almost every sector of the workforce is the ability to locate, analyze, and apply information from wide variety of sources (Salpeter, 2008).
BLOOM’S TAXONOMY AND 21ST
CENTURY SKILL DEVELOPMENT
Bloom (1956) noted the three domains of educational activities included cognitive, affective, and psychomotor. Within the cognitive dimension, Bloom indicated a range of six increasing educational objectives - knowledge, comprehension, application, analysis, synthesis, and evaluation - with each demonstrating a higher level of student critical thinking. Anderson and Krathwohl (2001) revised Bloom’s original taxonomy and connected the cognitive processing dimensions - remembering, understanding, applying, analyzing, evaluating, and creating - with a corresponding knowledge dimension. These knowledge dimensions progress along an increasing continuum as well; factual, conceptual, procedural, and metacognitive knowledge. As a result, the cross-combination of these two dimensions leads to both a wide variety in the types of student activities necessary to address the dimensional combination, and disparity in the types of assignments that would produce the desired outcome.
addition, “acknowledging that learners are self-directed and autonomous and that the teacher is the facilitator of learning rather than the presenter of content” may be seen as well as a component of contemporary post-secondary education (Henchke, 2005, p. 34). This view however presents a stark contrast to what Chan (2010) noted was the teacher-centric, dependent, and subject oriented nature of pedagogy. Today, there is detailed support in the literature for the “self-directed, problem-oriented, motivated, and independent” nature of adult learners and the application of andragogical principles to numerous disciplines, including management (Chan, 2010, p. 27).
Constructivist Epistemology and Skill Acquisition
Importantly, Chan (2010) stressed the need to “engage adult learners in … conducive learning environments” (p. 31). In this way, rather than passive, broadcast methods of instruction focused on content acquisition (Tapscott, 2009), discovery learning, which allows “learners to interact with materials, manipulate variables, explore phenomena, and attempt to apply principles,” learning appeared to be a more “robust” approach to 21st century adult education (Alfieri, Brooks, Aldrich, and Tenenbaum, 2011, p. 1). Alfieri et al. noted a spectrum of techniques fall under the discovery learning umbrella, ranging from completely unassisted discovery practices, to discovery with varying degrees of assistance provided, and finally discovery achieved with direct instruction. Linking the constructivist perspective with discovery learning, Alfieri et al. (2011) found enhanced discovery to be most effective with adult learners, and concluded that through the use of hands-on activities and manipulation exercises, adult learners achieve the higher order objectives of Bloom’s taxonomy.
Therefore, across the post-secondary instruction process, students need to progress though the lower level stages of learning to information acquisition. With the information acquired, students then need to be challenged through more integrative, interactive, engaged, and qualitative assignments. It is then incumbent on educators to find a way to not only understand how adult, post-secondary students learn best, and find the best way to present the material to them to facilitate that learning, but also to create assignments and activities that can help students internalize, personalize, and immediately apply what they have been presented. By rethinking not only the process but also the outcomes of assignments – simultaneously – it becomes possible to make coursework more individual, more meaningful, and in the end more effective to each individual student. This level of personalization is generally not seen in the mass higher education system, however, the possibilities seem enormous, in terms of both broadening the learning possible and in the creating learning situations (assignments and activities) where students can immediately apply they have learned.
FOCUSING ON THE DEVELOPMENT AND DEMONSTRATION OF HIGHER-ORDER SKILLS
The problem however is that, as students’ progress along the increasingly higher-order taxonomic levels; it becomes harder to measure objectively the associated skills, such as reflection and integration (Silva, 2009). Nevertheless, Silva noted it is important not to separate the disciplinary content core from the acquisition of skills. Instead, content mastery and skill acquisition should be an integrated part of the entire education process and developed together. As a result, the creation of “authentic projects” may be seen as a means to achieve the goals of reflection, integration, design, and creation at the highest levels of cross-combination in the cognitive and knowledge dimensions of learning (Silva, 2009, p.1). Salpeter (2008) concurred, noting there is value in creating “rich, multi-disciplinary, technology-infused learning” (p. 3). In this way, it becomes possible to create discipline-specific assignments, where students can not only demonstrate content acquisition but also the addition of the skills necessary for success as part of their professional socialization process (Buchanan, 2006,).
Summative assessments review, after instruction, what has been learned (Swearingen, 2002). Activities and assignments such as weekly quizzes, applicative homework assignments such as case studies, and comprehensive projects and exams are all examples of summative assessments that focus on what a student has (or has not) learned. Formative assessments, on the other hand, dynamically align instruction techniques and assignments during the learning process (Swearingen, 2002). In this way, formative assignments assess not what has been learned, but rather what is being learned (or not), while the learning takes place. From a student’s perspective, formative assessments allow a student to reflect, apply the content learned, determine why new content is important, and ascertain how the new knowledge connects with what they already know. From an instructor’s perspective, formative assignments create an opportunity for feedback, on not only the content acquisition but also its interpretation and application. This process therefore reflects Zull’s (2006) basic brain patterning and learning process, the steps of which include exposing, reflecting, and applying content. In addition, properly constructed formative assessments can create a guided inquiry process through the content acquisition process. Connecting this type of formative assignment and assessment then with summative assignments and assessments, students’ course work may culminate in the activation of Bloom’s higher order skills including reflection, integration, internalization, and personalization.
CREATING AN ENVIRONMENT TO DEVELOP AND DEMONSTRATE HIGHER-ORDER SKILLS
Problem and Project-based Learning
Combining elements of problem-based learning and project-based learning, in open-ended learning environment (OELE), may facilitate this type of content and skill acquisition. Bell (2010) defined project-based learning as a student-inquiry driven process, where students’ questions initiate the learning process and instructors facilitate guided research to answer that question. Bell (2010) additionally indicated project-based learning may result in “greater understanding of a topic, deeper learning, higher-level reading, and increased motivation to learn” (p. 39). Further, Savin-Baden (2000) indicated problem-based learning organizes content around a problem, rather than a specific discipline-based topic. In problem-based learning, students focus on addressing the problem, discerning the information that applies, and deciding how that information applies, rather than searching for a predetermined ‘right’ answer. Savin-Baden (2000) also noted literature on problem-based learning focuses on its use as a means to develop student-reasoning skills, allowing learning to occur in a student-relevant context, ensuring an education-workplace connection, and promoting self-directed enquiry. The current demands for the development Information Age skills allows problem-based learning to remain relevant, as a means to not only promote skill development but also to “enhance the knowledge creation capacity of individual[s]” (Savin-Baden, 2000, p. 20). The creation therefore of problem-based, project-centric formative and summative assignments may be seen as a vehicle through which students can optimally acquire, engage, and refine the knowledge and skills necessary for workplace success. Open-Ended Learning Environments
Land (2000) defined an open-ended learning environment (OELE) as a “technology-based environment that follow[s] constructivist assumptions” and allows for both “higher-order thinking and problem solving” (p. 61). In an OELE, Land noted technology supports both “unique learning goals and knowledge construction … [such that] complex concepts can be represented, manipulated, and explored” (p. 61). As a result, an OELE may be seen to echo the composition of a discovery-based, guided learning environment, with both focused on not only a student’s “voluntary cognitive engagement,” but support as well “thinking-intensive interactions with limited external direction” (Land, 2000, p. 62). In this way, Land stated students become an “active constructor of meaning … [and] through observation, reflection, and experimentation, understanding evolves in response to interactions that continually confirm, challenge, or extend ongoing theories and beliefs” (p. 62).
Information Visualization
Salpeter indicated there is value in finding a way for student to “create presentations to demonstrate their learning” (p. 3). In this way, the design creation process includes perceptual problem solving, which Inchauste (2010) defined as “forcing the mind to try and figure out, or imagine, what the objects look like” (p. 5). According to Inchauste, the challenge associated with creating a design may not only be motivating but also pleasurable to the designer. In addition, the information visualization process may be seen to complement the design process. Card, Mackinlay, and Shneiderman (1999) stated the purpose of information visualization is “insight, not pictures,” such that cognitive abilities and “the acquisition and use of knowledge” is expanded (p. 6).
Importantly, Card et al. differentiated scientific visualization, or the representation of physical data, with information visualization, whose aim is the representation of abstract, non-physical data. The information visualization process is designed to move “from information foraging to sense making … [which] requires building schema or descriptions into which many pieces if information fit” (Card et al., 1999, p. 580). This is significant since Pope (2013) noted, where organizations in the 21st century “are awash in data,” only approximately 10% of this data is structured, numerical data (p. 1). The remaining 90% of data to be assessed is unstructured, the analysis of which requires the detection of “patterns, sentiments and relationships” (Pope, 2013, p. 2). Choy, Chawla, and Whitman (2011) concurred, noting where a picture is worth a thousand words, the data visualization process creates an opportunity to gain insight from, and discern the relationships between, data points. Choy et al. also stated the visualization of ‘big data’ requires visualizer to be aware of the data’s volume, variety, and velocity. In an organizational setting, the volumes, or the amount of data to be analyzed, as well as the velocity, or the speed at which data changes, are important considerations. In an educational setting, however, data variety, which deals with the structured or unstructured nature of the data, may be seen as an important consideration. Semi-structured and unstructured data present unique challenges and therefore require different visualization techniques.
AN UNDERGRADUATE LEADERSHIP ASSIGNMENT TO DEVELOP AND DEMONSTRATE HIGHER-ORDER SKILLS
Hay and Hodgkinson (2005) stated the dominant conceptualizations of leadership have made its instruction difficult in the college classroom. They argue that the “systems-control” viewpoint in leadership education has not been successful in equipping students with the necessary knowledge and skills for success in the workplace. Rather, a “process-relational” view of leadership moves toward a “de-centered classroom where the student and teacher jointly construct knowledge,” without seeking a singular, reductionist answer (Hay & Hodgkinson, 2005, p. 156). In this light, the use of problem-based, project-centric formative and summative assignments in an undergraduate leadership class may allow students to not only acquire the necessary discipline-specific content, but also develop the skills that ultimately lead to career success.
Comprehensive Leader Infographic Assignment
At Walsh College, the institutional vision focuses on student mastery of both theory and practice. With that goal in mind, the undergraduate leadership course encourages students to master Bloom’s lower-order skills, understanding, analyzing, and applying relevant leadership theory. An additional and overt goal of the course is a demonstration of internalized metacognitive leadership knowledge. The use of both self-assessment exercises and examination questions asking students to detail the personal leadership lessons they have learned studying the assigned leaders are used to demonstrate that mastery.
At the end of the term, the content of these formative writing assignments then became the foundation for a course-ending summative assignment. Students were asked to create an infographic summarizing, in one pictorial representation, the leader’s personality, interactional capacity, and strategic leadership characteristics (Appendix A). Instructions for the final project indicated this was to be a summative assessment, specifically designed to bring the weekly work together in a comprehensive way. Students who may have been unfamiliar with the concept of an infographic were given a description of the technique, a visual example (in the context of the assignment), as well as additional resources on the creation of infographics. In addition, the instructions detailed that the infographic was not intended to merely replicate all of the weekly work but was specifically intended to seek patterns, connections, and relationships across that body of written work. The rubric provided also directed students toward areas of focus. This assignment was also created to include a project evaluation. Upon completion and submission of the infographic assignment, students were asked to provide their reflections on the assignment’s process, content, and value. The content of this evaluation survey provided critical feedback the instructor was able to use to refine and improve the assignment’s instruction clarity. More importantly, this reflective evaluation allowed students one additional opportunity to reflect on the value of the infographic creation process.
Evaluation of the Students’ Perceptions of the Assignment and its Value
Heer and Shneiderman (2013) noted a benefit of the information visualization process is the ability to make sense of data by asking questions, detecting patterns, and uncovering errors. This type of analysis “requires contextualized human judgments,” and in the context of the infographic assignment, students first needed to activate their perceptual skills, and determine patters and relationships between the researched weekly data elements (Heer & Shneiderman, 2013, p.1). Students then needed to map those elements visually as they create the infographic in an “iterative process of view creation, exploration, and refinement” (Heer & Shneiderman, 2013, p.1). The overall process therefore required student to selectively visualizing how the data would be depicted, filter in the relevant data elements (and filter out those that were unrelated), sort and order the information to determine patterns and relationships (or contrasting points), and deriving new data in the form of summary categories or descriptions. As a result, the creation of the summative leader infographic echoed Tufte’s (1997) statement, “when principles of design replicate principles of thought, the act of arranging information becomes an act of insight” (p. 9).
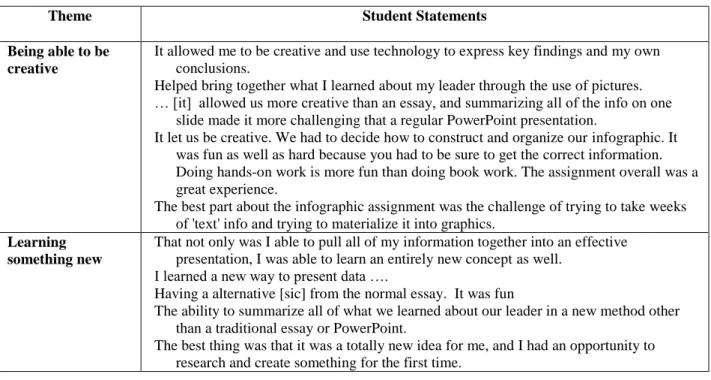
Student perceptions of this assignment supported not only the value of information visualization process at the heart of the infographic assignment, but also the enhancement of higher-order skills. When asked what they liked best about the leader infographic assignments, student’s responses culminated in three themes; the benefits of being able to more clearly visualize the concepts and connections, being able to be creative, and learning something new. Student feedback results are depicted in Table 1.
Table 1: Student responses to what they liked best about the infographic assignment
Theme Student Statements
Being visualize/see the concepts and connections
I know for me I can understand a lot better if things are visual, so this really stands out for me.
Seeing the connections of leadership traits visually.
Being able to pull all of the week’s together and see the characteristics all in one project. The amalgamation of all of the material that we assembled into a single visual assembly
drove a need to truly understand the leader at greater depth in order to effectively communicate the intended message.
I feel that using the same leader throughout allowed a consistent view of an individual along with how the concepts were, or were not demonstrated by that leader. I think there is significant value in understanding both the good and the bad examples and using the same leader throughout allowed a view into various aspects of leadership and how our chosen leader related to the topics that we were studying each week.
Table 1 Continued
Theme Student Statements
Being able to be creative
It allowed me to be creative and use technology to express key findings and my own conclusions.
Helped bring together what I learned about my leader through the use of pictures. … [it] allowed us more creative than an essay, and summarizing all of the info on one
slide made it more challenging that a regular PowerPoint presentation.
It let us be creative. We had to decide how to construct and organize our infographic. It was fun as well as hard because you had to be sure to get the correct information. Doing hands-on work is more fun than doing book work. The assignment overall was a great experience.
The best part about the infographic assignment was the challenge of trying to take weeks of 'text' info and trying to materialize it into graphics.
Learning something new
That not only was I able to pull all of my information together into an effective presentation, I was able to learn an entirely new concept as well.
I learned a new way to present data ….
Having a alternative [sic] from the normal essay. It was fun
The ability to summarize all of what we learned about our leader in a new method other than a traditional essay or PowerPoint.
The best thing was that it was a totally new idea for me, and I had an opportunity to research and create something for the first time.
When asked to detail the most significant challenges of the assignment, student’s responses indicated problems executing the higher-order thinking and processing skills required in the assignment. Several students stated difficulty in not only selecting the relevant data to be included in the infographic, but also in synthesizing the data they did select into a comprehensive and coherent single image. For other students, the newness of the technology to create an infographic was their most significant challenge. Most interestingly, the response of one student echoed Land’s (2000) cautionary note on student’s epistemological orientations, with the student failing to see the ability to apply data visualization techniques to non-physical data. Table 2 summarizes student answers to the question, “I think the worst thing about the infographic assignment was …”.
Table 2: Student responses to what they thought was the worst thing about the infographic assignment
Theme Student Statements
Selecting and Synthesizing data to create coherent end product
It was hard for me to decide how much information to put, and what exactly was the most important.
Too much information and not enough space!
How difficult it was trying to get all of the graphics to fit into one space in an organized and final manner. Trying to display months’ worth of info on one graphic image was kind of overwhelming at first.
Trying to decide what information just wasn't necessary to be included.
I found it very hard to narrow down 40+ pages of assignment into a single picture. It was hard to get it started because I was unsure on how to approach it.
Technical issues with new program and technology
I am not very tech savvy, and it was challenging at first.
Hard to complete online compared to a poster board in a classroom setting That the website lost the first one I created.
… using a very unfamiliar website
That I have never created a infographic before, and was rather intimidated by the programs that were provided to us.
Not relevant for ‘non-technical’ application
Students were also asked to comment on their perceptions of the term-long, formative-to-summative assignment process. In this assignment, students had been asked to select a leader at the beginning of the term and profile that individual consistently throughout the 11 week term. The majority of students believed the consistency of the weekly assignments, accumulating of a larger body of data evidence and synthesizing all of the course concepts into one, holistic picture, was beneficial. For others, the formative weekly assignments became repetitive. They noted the use of two or more leaders, and corresponding infographic assignments, would have been more beneficial. Table 3 summarizes students statements regarding the weekly work focused on the same leader across the entire term. Table 3: Student responses regarding the use of a singular leader the infographic assignment
Theme Student Statements
Selecting only one leader was a good idea because ….
… because I received a comprehensive picture at the end.
Great! I think using the same leader was better than changing leaders each week. I really enjoyed pulling it all together at the end and it was something different which made it more interesting.
A good idea because we got to put all that we have researched on our leader and any conclusions that we could draw on our leader in one picture. I honestly did not think that there was going to be way to get all that I needed to say about my leader onto one picture, but I did!
Great. I was able to focus on one leader all semester and at the end I felt I had a very good understanding of him and his leadership style. Studying multiple leaders would be less impactful.
Great because it made it easier because I learned so much about my leader [that] it made doing the infographic easier.
Great because I got a comprehensive picture that put everything together and made all that hard work pay off. It also allowed an element of creativity to it.
Selecting only one leader was a bad idea because ….
I think breaking up the semester into two or three leaders and summarizing each one in something similar to an infographic would be better.
A good idea to start with, but it got boring toward the end. I think it would have been more beneficial to focus on one leader to the mid-term and then another up to the final. … it did get a little repetitive.
Finally, students were asked to detail their perceptions of the infographic assignment as a course-ending summative assessment. Students perceived the production of an infographic to be a fun, creative, unique assignment. Several students believed the infographic assignment to be less work, and less stressful, than the preparation of a large, comprehensive paper or PowerPoint presentation. Table 4 summarizes student statements in answer to the question, “Of all of the ‘final assignments’ in the classes I have had so far, I think this one was …”.
Theme Student Statements
Fun This assignment was the most fun, because I really enjoyed making the infographic. … I think it was probably my favorite final project thus far.
I think this assignment was very fun because I got to be creative.
It was the most fun and interesting and I think it’s a great way to end a class after doing so much research and writing (typing).
The best. I enjoyed it very much and it was fun as well.
Creative I think this assignment was very fun because I got to be creative.
One of the best. I enjoyed not typing a huge paper, while my creative side flourished. Less work/easier It was much less work than an essay or PowerPoint and it was more fun. I still was able to
show that I understood the concepts and summarized my leader. It was a nice change of pace from most final assignments.