The Neural Network Selection for
a Medical Diagnostic System using
an Arti
fi
cial Data Set
Jan Piecha
University of Silesia, Institute of Informatics, Dept. of Electronics and Computer Systems, Katowice, Poland Silesian University of Technology, Institute of Transport, Katowice, Poland
The paper describes experiments with a neural network selection that works as a conclusion-making unit of walk-abnormalities diagnosis. The diagnostic interfaces described in this paper provide the user with various tools for the disease analysis. They are having a pressure and load distribution on the foot, while taking into account the individual characteristics of the patient standing and walking 1], 2], 3]. Various visualisation options give
the user many aims in putting the diagnosis anyhow, in order to simplify the diagnostic process several methods for the data record filtering have been implemented. The discussed methods of the neural network selection and training show how to avoid difficulties with limited num-ber of available data records, needed for the conclusion algorithms effectiveness improvement.
Keywords: neural networks, conclusion-making sys-tems, medical diagnostics
1. Introduction
Foot is a highly complex organ that produces balance of a human body, acting as a shock ab-sorber and a mobile adapter. These functions occur at a specific time in the cycle of walking or running activity. Medical staff uses many methods 1], 2]and tools 3]to analyse all
mo-bile mechanisms of a foot. They allow us to detect a shape of a foot or walk cycle abnormal-ities to provide the patient with relevant medical treatment.
Various computer diagnostic tools 4], 5]with a
built-in conclusion-making unit(CMU)are
suc-cessfully used in different fields of medicine. Expert technologies involved in the CMU de-velopment 6] have been presented in this
pa-per. Although the majority of the CMU
faci-lities have been discussed for pedobarography diagnostics and the neural network selection, the same methodology can be implemented in other diagnostic areas.
2. The Measuring Equipment
The method of a data analysis that is registered by sensors installed in shoe insoles is discussed in the paper. The Parotec System for Windows
(PSW) 7]is the measuring equipment that
con-sists of two main parts:
— a single-chip microcomputer measuring unit reading a pressure distribution on 24(
piezo-electric)sensors installed in the insole as it
is shown in Fig. 1a,
— a PC software package that reads the data record from the measuring unit and visua-lises the walk characteristics.
The data available in the record is presented in various interface windows having many com-ponents of diagnosis. They allow analysing the patient’s footprint and way of walking.
The measuring unit collects source records of static(while standing)and dynamic(while
walk-ing)data. The data is gathered in a memory card
dynamic data part is presented both as a set of medium values from the whole record and as a sequence of current values of a data flow. The PSW is a product of Paromed Medizin-techik GmbH that developed the hardware unit. The whole PC software (presented in the
pa-per)has been developed by Silesian University
research workers, under the paper author super-vision.
Orthopaedists analyse the pressure distribution on a foot(Fig. 1)that allows localising the foot
deformation and to design shoe insoles.
The first step of the disease detection concerns a static part of the data record. The user can in-clude his assumptions regarding the diagnosis; the rough estimation of the footprint abnorma-lity, namely a class of a foot disease. In most cases a foot shape disease is visible on the foot-print map (a static map), but the disease real
source can not be established precisely. The final conclusion has to be searched within the dynamic part of the data record where the way of walking is visible.
Fig. 1.The static data interface(a)– Pressure values,(b)– Control desk,(c)– Visual interface.
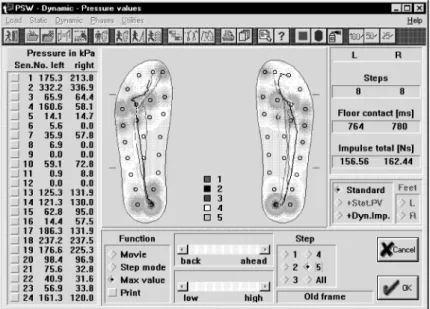
After this elementary recognition a next check-up procedure concerns the dynamic part of the data record(Fig. 2). Time schedules of the
pres-sure distribution and time diagrams describing the walk cycle has been given in Fig. 3 and Fig. 4.
The abnormality of time distribution in the cycle of walking allows the PSW user to extract the reasons of patient difficulties, underlying a na-ture of problems. All difficulties with walking are observed in efforts to tolerate the ongoing
stress or of utilising available motion to the nor-mal range, close to the neutral position. The dynamic data part of the record has been pro-vided with interfaces allowing analysis of the walk cycle characteristics in a movie and in a single-step mode.
3. The Conclusion Making Unit — CMU
Various visualisation formats allow to extract much more information. The paper presents
Fig. 3.The time diagram of a walk.
several research experiments that have been car-ried out with the PSW system. The data ex-tracted from the record can provide the users with several additions that make an automatic conclusion possible.
The three example screens presented in Fig. 2., Fig. 3 and Fig. 4 visualise:
(a)a pressure distribution on 24 sensors, (b)walking abnormalities,
(c)time diagrams with a load movement along
the foot, showing a body balance in a walk-ing period.
They are currently used for orthopaedic di-sease diagnosis supporting the insole selection for foot shape correction, for load reduction or for both. Anyhow they can also be used for other diagnosis, as:
— bones abnormality detection,
— body balance and mobile mechanisms ana-lysis,
— time measures analysis in a cycle of walking or running activity,
— neurological factors of the disease recogni-tion,
— to control the medical treatment, recovery and rehabilitation.
One of the most important diagnostics area seems to be neurology. The neurological di-agnostics suffers from shortage of equipment and formal methods supporting the disease de-tection, controlling medical treatment and sup-porting rehabilitation processes.
The figures mentioned above show the pressure distribution on the foot and time relations of a load centre movement within specified foot zones. Although the visual data format allows to notice many factors of the patient’s way of walking it is only the information set that has to be interpreted by the equipment user. Only a very well trained operator is able to concen-trate the whole data from PSW interfaces and to reach a proper diagnosis. What is more the quality of diagnosis highly depends on the user ability of handling the computer system. Doubts concerning diagnosis are reasonable smaller when it is supported by a knowledge database of diseases, classifying the disease
characteristic features given by current data record. The CMU simplifies the diagnostic procedures comparing the selected part of the record with pattern images, using filtering and extracting formulas.
The conclusion-making unit (CMU) consists
of:
— a neural network processor for incoming data,
— dialogue windows for interactions while the network is trained, for testing and for net-work exploitation,
— explanation unit that converts the network diagnosis into adequate comments.
The CMU designer has to cope first with the neural network structure and its training method selection. The most troublesome problem is non-sufficient number of records that are needed for the network training and selection. More-over, the records obtained in clinics are not clas-sified properly.
Although several models of the neural network were considered during the experiments, the results were not satisfactory at the beginning. Moreover, the reasons of the diagnosis faults were very difficult to estimate. In order to re-duce a number of faults factors simple three-layer back-propagation network for the CMU structure has been applied initially. The neu-ral network dimensions have been defined as follows:
(a)for the inputs number (IN) definition we
used:
5 steps 2 feet 20 samples per step 24 sensors=4800 input signals,
(b)the outputs number(ON)was equal to fully
defined pathological features.
(c)the hidden layer(HL)size of the network has
been defined temporarily as a square root of product IN ON ex.: sqrt(4800 10)=219
neurones]then modified empirically during
the training process.
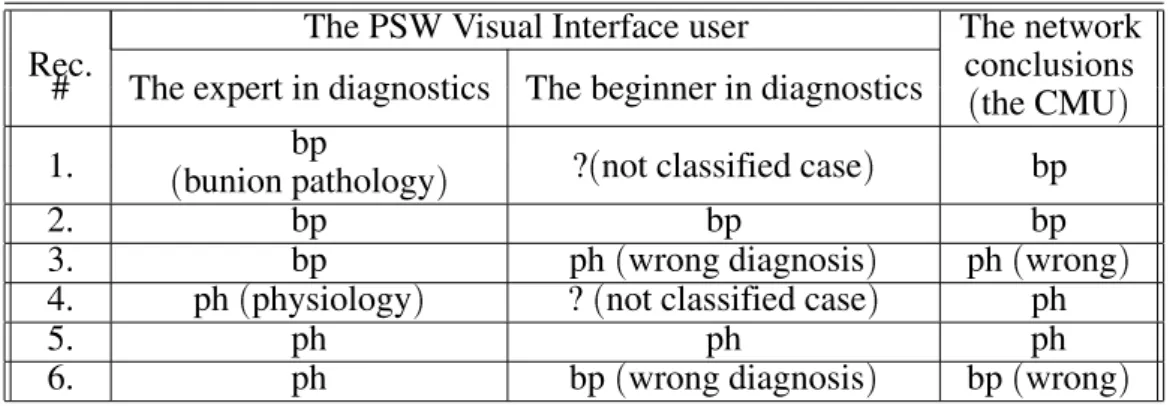
Experiments in clinics
The PSW Visual Interface user The network
Rec. conclusions
# The expert in diagnostics The beginner in diagnostics
(the CMU)
bp 1.
(bunion pathology)
?(not classified case) bp
2. bp bp bp
3. bp ph(wrong diagnosis) ph(wrong)
4. ph(physiology) ?(not classified case) ph
5. ph ph ph
6. ph bp(wrong diagnosis) bp(wrong)
Table 1.The network examination results.
NEXT: Several records have been selected from medical expert’s check-up set.
The first sample network training has been done by:
26 data records for two active outputs: — 13 records for physiological feet(ph),
— 13 records with bunion pathology(bp).
Training:
by 10 and 10 records from both groups, given 1000 times in random order. The training stopped when faults of the records self-test were smaller than 0:5%
Examination:
For examination (Tab. 1) the remaining 6
records were used.
The examination results are presented in three columns of Table 1. They contain conclusions of a medical expert, a beginner in diagnostics and the CMU.
The CMU classified properly the record # 2 and the record # 5 however they were easy to clas-sify by the beginner in diagnostics. The records # 1 and # 4 were also classified properly as they were very well represented in the network training process.
Unsatisfactory conclusions were made for the records # 3 and # 6 but a more careful analy-sis of PSW visual interfaces explain the reason. They are the disease features that are close to a threshold value of these classes. The records contain characteristic features of two different classes of the diseases.
For the next step of training 53-sample data records (for 6 outputs) were chosen. Then 47
records were used for a direct training, with:
— 12 records from physiological group(ph),
— 7 records of bunion pathology(bp),
— 6 records with a left-sided paresis, — 4 records with a right-sided paresis, — 7 records with a left-sided ischialgia, — 11 records with a right-sided ischialgia. The training process was stopped after 50000 iterations, when the records self test properly classified 41 records; with fault smaller than 1%. For the remaining 6 records (5 of
para-paresis and 1 of ischialgia) the CMU
recogni-tion fault was bigger than 50% anyhow these diseases have not been represented in the train-ing cycle. Six records out of 53 were used for the network examination:
— 3 records of physiology group(ph),
— 2 records with bunion pathology(bp),
— 1 record with right-sided ischialgia. The examination results, for:
— record # 1 that was classified by medical ex-pert as physiology:
the CMU recognised the disease with 51% of confidence level(its characteristic features)
and less than 1% features recognised from another disease.
— record # 2 was classified as physiology: the physiology features were classified pro-perly in 59%, with less than 1% features belonging to another disease.
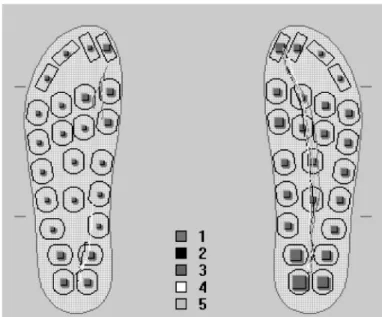
— record # 3 was also defined as physiology
(Fig. 5):
Fig. 5.Pathology on the left foot — the wrong classification by medical expert.
were found in the record, with 82% features of a left-sided ischialgia. It is enough to look at the left footprint where pathology is visible. It means that the CMU classified this record properly.
— record # 4 was classified by medical expert as bunion pathology(Fig. 6):
the CMU recognised 0% features of bunion pathology, while the footprint with regular trajectories of walking mark undoubtedly characteristics of physiological record. — record # 5 was classified as bunion
patho-logy:
the CMU recognised only 2% features of the appointed class and 9% features of physio-logy. More careful analysis of the footprint proves that this record has also been classi-fied incorrectly.
— record # 6 classified as right-sided ischial-gia:
the CMU recognised 0% of the appointed disease and 57% factors of a right-sided paresis. The diagnosis was wrong as this
patient was suffering from neurological di-seases.
Comments:
— The experiments with the network training proved that computer interfaces like PSW make the medical experts many troubles in reaching a proper diagnosis. They provided the CMU designer with the not properly clas-sified data set. This way the designer had to cope not only with shortage of data records but also with records doubtfully classified.
— In spite of a large number of iterations, the network has not been able to generalise the disease features recognition carried by the data records. What may suggest that the network structure has to be better matched to the input set.
— The similar classes of the disease were dif-ficult to distinguish. This means that the network needs more training cycles and the conclusion tools have to be provided with additional interfaces.
The CMU designer has to cope with:
(a)the neural network structure selection,
(b)the satisfactory number of well defined
re-cords selection that can be used for the net-work training.
4. The Data Filtering Unit
To avoid or to reduce the scale of troubles with the disease classification the filtering unit has been developed. The data record contains se-veral pointers of a walk that can be discussed separately. The specified pointers are used as foot shape and walk abnormality classifiers. They allow defining foot and walk patterns then to analyse values of pointers in a current record. The value of each pointer defines a single mea-sure of the disease.
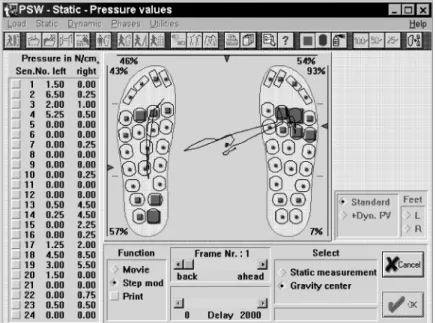
The trajectory length of the gravity centre move-ment in a static part of the data record is one of the example pointers. The example mentioned in Fig. 7 shows three pointers of body stability while standing.
There are:
— two pointers of a foot gravity placement as-signed by the triangle on vertical axis along the foot,
— one pointer of the body balance gravity place-ment assigned by the triangle on horizontal axis.
The example shows movement trajectories of gravity pointer. Patient’s body balance trou-bles or diabetic diseases are noticed on a tra-jectory length, where several pointers can be distinguished. One of them is the pointer of
Fig. 8.A body gravity centre movement.
trajectory length for body gravity centre move-ment(for medium value of all steps)in the static
part of the data record. This pointer shows how the load is distributed on the whole foot or on the selected part of the foot.
The example in Fig. 8 shows the load trajec-tory movement on both feet that are remarkable different on both feet. The patient has walk-ing troubles visible on the right foot. Simi-larly many other pointers can be distinguished,
as: pointer of the step time medium value, the pointer of the medium trajectory length devia-tion of body gravity centre movement in suc-cessive steps. A medium value of the trajectory length pointer for all steps. Similarly any other pointers can be defined. They allow classifying many of abnormalities of the patient’s walk.
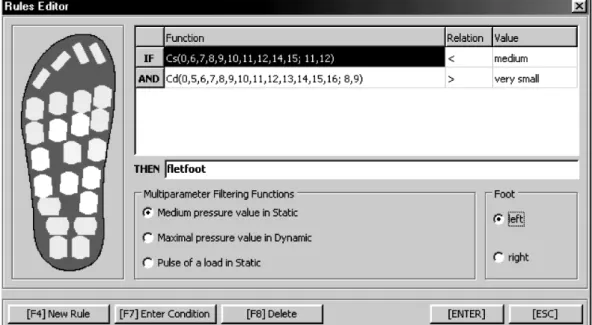
The user interface for data filtering principle definition is presented in Fig. 9. It is an inter-face of a current record classifier. The classifier
uses several filtering functions that allow veri-fying medical expert’s conclusions.
The conclusion conditions are defined (for
ex-ample) by marking the sensors group that is
compared with the sensors load of another group. The top part and a right hand side corner of the window are used for rule factors and for rule relations definition, as:
IF <functions> <relation, value> and <functions> <relation, value> and <functions> <relation, value> ...
THEN <conclusion>
The sensors load selection allows to define disease factors values and to start the system knowledge development. The user interface al-lows defining the load relations in a selected foot area. The relations of the load within the selected groups of sensors define the disease characteristic feature. Only the record contain-ing classified load relations can be included to the class of the disease(during the learning
pro-cess).
5. Artificial Records for the Neural Network Selection and Training
The pressure distribution within the foot has been described by several functions defining various values of PSW variables. Analysing the PSW data set one can find several regular-ities in the disease image of the data records. The difference between the record classified as physiological and several pathological are regu-lar and periodical. They show well known geo-metrical functions, as: sinus, cosine, exponent, etc.. Those remarks allowed us to carry out an experiment with artificial records definition that could be used for the network structure selec-tion. The only problem was to define the period length of the function. Anyhow, this problem can be solved experimentally. The amplitudes of the disturbances will be measured using the disease scale.
The image of a data record can be described by four groups of functions, as:
F1(X)+F2(X)+F3(X)+F4(X)
where:
X — the network input
variables set,
F1(X) — static pressure distribution
for physiology,
F2(X) — dynamic pressure distribution
for physiology,
F3(X),F4(X) — the disease disturbances
for static and dynamic load.
It means that the F3(X) and F4(X) represent
characteristics that could be a subject of the ar-tificial pathology recognition by the CMU. This way instead of searching well-defined cli-nical records, the artificial records of new patho-logy classes have been produced. The F1(X)
andF2(X) of physiological data set have been
interfered by well known functionF3(X),F4(X)
and their combinations. They have been used for experiments concerning the network struc-ture selection.
These experiments were repeated for several networks:
— back propagation with 3 and 4 layers, — counter propagation network,
— adaptive resonance network.
The most satisfactory results for the PSW data format have been obtained for counter propaga-tion network. This network has got the highest score(99,9%)of the records recognition. This
way the first task(the network structure
selec-tion)of the CMU designer has been solved.
Similarly the artificial records set for training process can be defined. However this techno-logy has to be combined with filtering classifier of the data record presented in Fig. 9. Both records obtained during the experiments in cli-nics and records generated artificially have to be classified by these filtering tools. The filtering formulas allow us to select a sufficient number of records, for network training and for CMU verification.
the whole disease classification, based on vari-ous interface-windows of PSW.
6. Conclusion
Efficiency and a large number of options give the user different options in putting the diagno-sis. A lot of experience is needed for a fruitful usage of the PSW power. In order to make the system friendlier to not very experienced users several expert extensions have been of-fered. The expert options combine the current data with groups of models the most relevant to the pathology. The PSW users have difficulties with the computer interfaces handling, during the clinical evaluation processes.
When the neural network complexity grows and the network training process is not well con-trolled, the network collects many unimportant details that cause the record recognition diffi-cult or not possible. The experiments in clinics proved high ability of the disease recognition. The mentioned interfaces can also be used as a tool for controlling the recovery process after the surgery operations. A lot of work has to be done concerning the methodology of medical treatment supported by walk analysis tools.
References
1] R. W. SOAMES, P. G. CARTER, J. A. TOWLE, The
rheumatoid foot during gait, Journal Biomechan-ical Measurement in Orthopaedic Practice, New York: Oxford University Press, 1985, pp. 167-178. 2] H. ARITOMI, M. MORITA, K. YONEMOTO, A
sim-ple method of measuring the foot sole pressure of normal subjects using prescale pressure-detection sheets,J. Biomech.,16, 1983, pp. 157-165.
3] M. J. SHEREF, A. M. BREGMAN, F. J. KUMMER, The
effect of immobilisation devices on the load distri-bution under the foot, Clinical Orthopedics, 192, 1985, pp. 260-267.
4] C. FRANKS, R. BETS, T. DUCKWORTH, A
micropro-cessor based image processing system for dynamic foot pressure studies,Journal Med. Biol. Eng. Com-puting, New York, 1983.,21, pp. 566-572.
5] E. HENNING, P. CAVANAGH, H. ALBERT, N. MACMI
-LAN, A piezoelectric method of measuring the
vertical contact stress beneath the human foot, J. Bio-med. Eng.,4, 1982, pp. 213-222.
6] R. FORHTH, Expert Systems Principles and case
studies, Chapman and Hall Computing, London 1984.
7] J. PIECHA, The neural network conclusion-making
system for foot abnormality recognition, Proceed-ings of IMACS World Congress, Lausanne, Switzer-land, August 2000.
8] W. WEISSHOLOM, C. G. KULIKOWSKI,A practical
guide to designing expert systems, Chapman and Hall Computing, London 1983.
Received:October, 2000
Revised:April, 2001
Accepted:April, 2001
Contact address:
Jan Piecha University of Silesia Institute of Informatics Dept. of Electronics and Computer Systems ul. B¸erdzi´nska 60, 41200 Sosnowiec POLAND
JANPIECHAreceived MSc in electrical engineering from Technical Uni-versity of Silesia(TUS – Gliwice, Poland). PhD in Computer Science
received from TUS as well – in 1967 and 1972, respectively. In 1980 he received DSc. degree from AGH in Krakow, Poland. In 1990 he received professor title from the President of Poland, then in 1994 a top level professor status at the University of Silesia(US – Katowice,
Poland). Since 1974 is a head of Chair of Electronics and Computer
Systems at US. Also a top level professor status at TUS and a head of Chair of Transport Informatics in Institute of Transport.