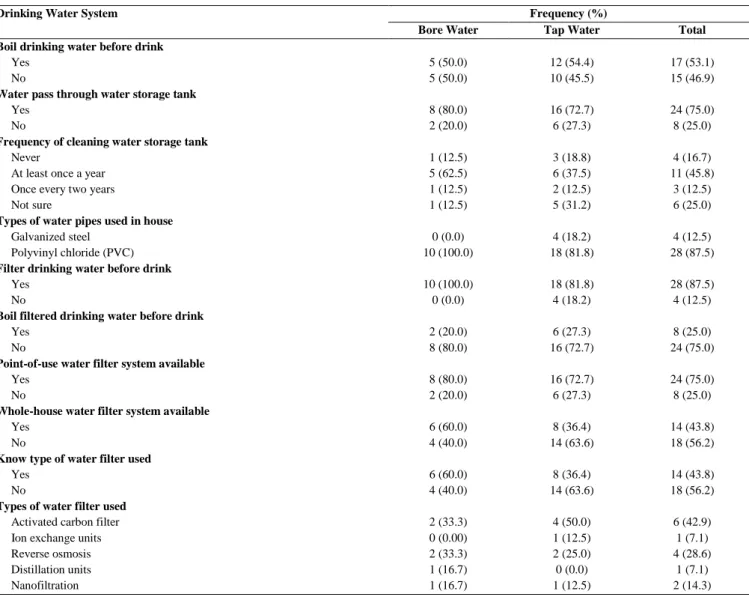
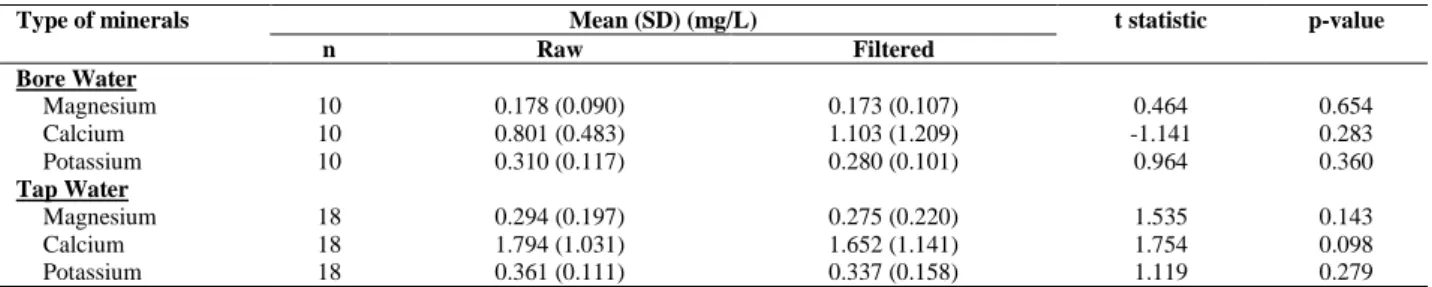
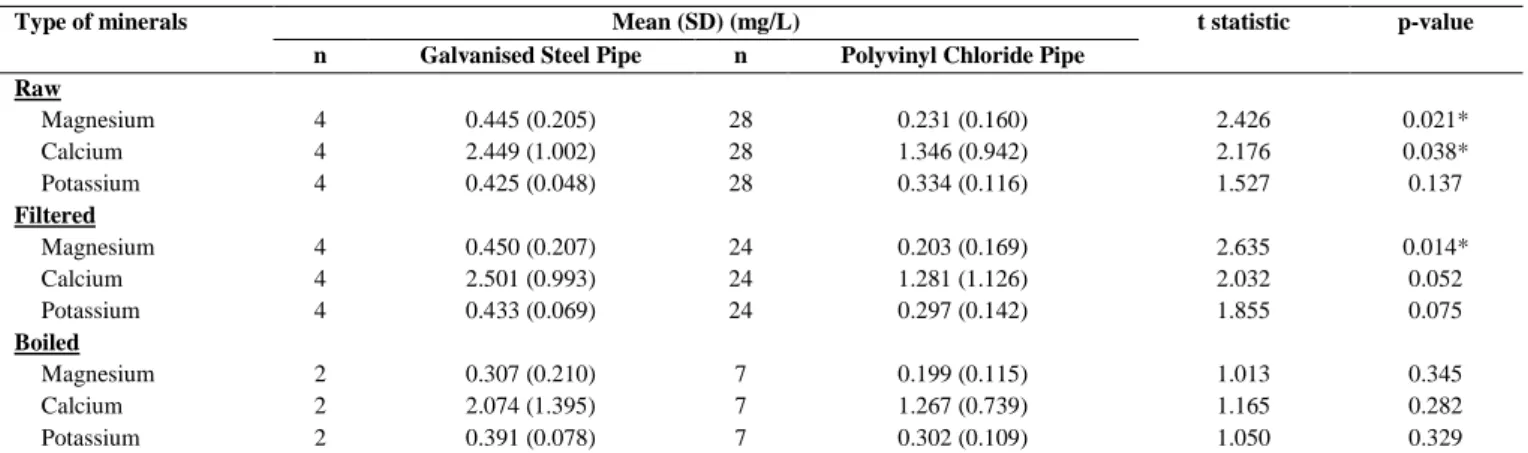
Concentrations of Magnesium, Calcium and Potassium in Drinking Water; A Comparison between Tap Water and Bore Water
Full text
Figure
Related documents
M.E. Thompson developed a theory of “institutional corrup- tion” in order to explain a phenomenon that he believed the Congres- sional ethics rules failed to address:
The polynomials are applied in the machine’s position control circuit to keep the sensor in its chosen working point of the calculated probing interaction signal (e.g. magnitude
This paper aims to raise the attention of public to the crucial role of Waqf to solve the current lack of financing towards infrastructure projects that impedes
The current work describes the antiproliferative activity of Schiff bases of combinatorial mixtures of the isatin derivatives M1-M22 as well as the individual compounds 1-11(A-K)
Intraperitoneal injection of rt-PA seems not to affect adhesion formation, as a 100% adhesion rate (seven rats) was reported in the treated group compared with 90% (nine rats) in
The general approach to finding a solution to a differential equation (or a set of differential equations) is to begin the solution at the value of the independent variable for
The intensity based registration method was applied to the two input images, the quality of the registration was measured using the Correlation function to measure the
Heterologous bone graft material (Osteoplant-Flex) is thought to be a good alternative to autologous grafts in de- creasing relapse rates and reducing the morbidi- ty of the
