Keywords: S e r v i c e q u a l i t y, SRVQUAL, SERVPERF, Technical quality, Functional quality,
*Correspondence to Author:
Fitsum Ghebregiorgis (address for correspondence), College of Business and Economics, P.O. Box 3963, Asmara, Eritrea (Tel: + 291-716 1013).
How to cite this article:
Asmerom A. Ghebremichael and Fitsum Ghebregiorgis. SERVICE QUALITY MEASUREMENT MOD-ELS: A Comparison of Two Models. Journal of Theoretical and Applied Economics, 2017; 1:3.
eSciPub LLC, Houston, TX USA. Website: http://escipub.com/
Asmerom A. Ghebremichael and Fitsum Ghebregiorgis, JTAE, 2017; 1:3
Research Article JTAE (2017); 1:3
Journal of Theoretical and Applied Economics
(ISSN:2
5
7
6-
3
9
70)
SERVICE QUALITY MEASUREMENT MODELS: A Comparison of
Two Models
Purpose of this paper: This study aims to contribute to the de-bate in service marketing literature concerning the operationali-sation of service quality measurement. To this effect, we tested two service quality measurement models by adapting them to the audit service context. These models are the gap model (SERVQUAL) developed by Parasuraman, Berry, and Zeithaml (1985) and the performance-only (SERVPERF) model developed by Cronin and Taylor (1992). Design/methodology/approach: The models are quantitatively analysed and evaluated for construct validity and predictive power using OLS models. In line with mar-keting literature (Gronroos 1984), service quality dimensions are classified into technical and functional dimensions. Construct validity is measured in terms of whether the technical and func-tional dimensions of audit service quality are significantly posi -tively correlated with an overall measure of service quality in the audit service market. Predictive power is measured in terms of the strength of adjusted R2. Findings: The results indicate that both the performance-only model and the gap model have done quite well in predicting determinants of overall audit quality. The argument by Cronin and Taylor (1992) that the gap model has low explanatory power compared to the performance-only model did not materialise in our study. Research limitations/implications: Our results are limited by the low response rate that did not allow us to conduct factor analysis on all the functional and technical variables at the same time. What is original/value of paper: The paper shows that the service marketing models for the measure-ment of quality would be improved when core outcome (technical) variables are incorporated.
Asmerom A. Ghebremichael1 and Fitsum Ghebregiorgis2
1Department of Accounting at College of Business and Economics, Department of Accounting (Pre-viously at the University of Asmara. Now under the umbrella of the National Commission for Higher Education, Eritrea) 2Department of Business Management and Marketing at College of Business and Economics, Department of Business Management and Marketing (Previously at the University of Asmara. Now under the umbrella of the National Commission for Higher Education, Eritrea)
ABSTRACT
Http://escipub.com/journal-of-theoretical-applied-economics/ 2
INTRODUCTION
Consumers make buying decisions and cling to product brands due to perceptions of quality (Boshoff, Mels, and Nel 1994). Consequently, perceived quality is one of the important reasons why customers engage in a relationship with a supplier. As a result service firms have been repeatedly cautioned about the importance of quality to their customers (Boshoff, et al. 1994, Zeithaml, et al. 1996). Studies have reported that quality has apparent relationship to many facets of competitive advantage such as costs, profitability, customer satisfaction and retention, market share, and return on investment (Mosahab et al. 2010; Sachdev and Verma 2002; Zeithaml 2000; Zeithaml et al. 1996; Richard and Allaway 1993). Accordingly, firms have used quality in order to gain these advantages. Unfortunately, research on quality and its relevance for service firms has been hampered by the lack of a generally acceptable definition of the concept (Boshoff, Mels, and Nel, 1994). This in turn has hampered the development of a generally acceptable service quality measurement instrument.
While the quality of tangible goods has often been described and measured objectively and considerably by researchers, service quality has largely remained difficult to assess because of its subjective nature. As Parasuraman, Zeithaml, and Berry (1988) described it service quality by its very nature is an abstract and elusive construct. Consumers find it hard not only to measure and delimit the concept, but difficult to articulate their requirements as well. For this reason, sellers of services experience difficulty in understanding and controlling quality. Zeithaml et al. (1988) stated that services are performances rather than objects and, therefore, precise manufacturing specifications for uniform quality can rarely be established and enforced by the firm. This means that, unlike goods, service quality is not engineered at the manufacturing plant, then delivered intact to the consumer. Service quality
construct. The audit service market is used in this study to test which of the two service quality models identified in section two is superior. In this section, literature on the economics of auditing, audit quality, and service marketing is reviewed in an attempt to define the audit quality concept and to identify its dimensions. Section four develops the hypotheses on the determinants of overall audit quality. Section five presents the methodology used to collect and analyse the relevant data. Section six presents the empirical findings of the study. Finally, in section seven we discuss and conclude on the findings.
DEFINING AND MEASURING SERVICE QUALITY
An understanding of the characteristics of the service sector is necessary in the selection of an appropriate instrument to measure service quality. Such an instrument needs to accommodate the difficulties and peculiarities raised in the previous sections. Service output is characterised inter alia
by high involvement of the consumer, which leads him/her to a greater noticing of the process (Lehtinen and Lehtinen 1991; Grónroos 1984). As a result, the quality construct as conceptualised in the service literature centres on consumer perceived quality (Parasuraman et al. 1988; Grónroos 1984). This implies that, in the service industry, quality measurement seems to be in terms of the result of the comparison that customers make between their expectations and perceptions about the service (Landrum, et al., 2008; Zeithaml et al. 1988; Caruna, et al., 1998; Grónroos 1984). Grónroos stated that “…the perceived quality of a given service will be the outcome of an evaluation process, where the consumer compares his expectations with the service he perceives he has received, i.e. he puts the perceived service against the expected service. The result of this process will be the perceived quality of the service” (1984, p37). Parasuraman et al. (1985) also state that service quality measurement is made based on a
comparison between what the customer feels should be offered and what is provided. Accordingly, Parasuraman et al. (1988:1) define perceived quality as “the degree and direction of discrepancy between consumers’ perceptions and expectations”.
Grónroos (1984) argues that there are many factors that influence the expectations of a customer among which are traditional marketing activities (such as advertising, field selling, pricing, etc.), previous experience with a service, ideology, and word-of-mouth communication. The perceived service, on the other hand, is the result of the consumer’s perception of how the service was performed. Hence, the quality of the service is dependent on two broad variables: expected service and perceived service. Quality can, then, be measured by comparing the expectation of clients with their perception of the actual service performance.
Although Grónroos’s conceptualisation of service quality was the first to be aired in the academic literature, it has been the work of Parasuraman, Zeithaml, and Berry (1985, 1988, 1991a) in developing and promulgating a technology for measuring and managing service quality which has received the most attention (Grapentine 1998). Since then, a number of studies have tried to operationalise theoretical frameworks and introduce various methodologies for the measurement of service quality in various service sectors by selecting a suitable definition of quality (e.g. Cronin and Taylor 1992; Bolton and Drew 1991). The technology that Parasuraman et al.
has developed is called the SERVQUAL model. The model is based on what is termed as “gap analysis” in the provision of services. That is, service quality can be assessed by comparing customers’ expectation of the service prior to the service encounter and their perceptions of the actual service delivered. This notion can be reflected in the equation:
Http://escipub.com/journal-of-theoretical-applied-economics/ 4
Perceptions of performance are consumers’ beliefs, based on experience of how well (or how bad) a service has been performed by the provider whereas expectations are consumers’ feelings concerning how a service should be provided (Caruna et al. 1998). Parasuraman et al. (1985) argue that the higher the expectation of the consumer the lower will be the quality of service unless matched by an equivalent or greater magnitude of perceived performance by the service provider. The resulting difference between performance and expectation is the gap that ultimately indicates the perceived level of quality. The SERVQUAL model (gap model) measures service quality using a 22-pair of items that are claimed to have resulted in the five dimensions. That is, 22 items are used to capture consumers’ expectations from the service provider. At the same time the performance of the service provider is measured using these 22 items with some changes in the wording. The measurement can be made on the basis of a five, seven, or nine-point Likert scale. The gap between the performance scores and the expectation scores on these items is then used to evaluate service quality. The working presupposition is that the service is good if performance meet or exceed expectations and problematic if performance falls below expectations.
The development of the SERVQUAL model started with the establishment of the aspects that the customer values in assessing service quality. To identify these aspects, Parasuraman et al. (1985) undertook a comprehensive review of the literature on service industries, and conducted focus group interviews with customers of four industries, namely retail banking, credit cards, securities brokerage, and product repair and maintenance. Parasuraman et al. analysed the results and conclude that customers use the same measuring standards in assessing service quality regardless of the type of industries, and that their criteria correspond to ten overlapping dimensions.
These ten dimensions were: tangibles, reliability, responsiveness, competence, courtesy, credibility, security, communication, access, understanding the customer. Parasuraman et al. then drew up 97 questionnaire items that correspond to these ten items, and refined them to reduce the number of items based on the industry survey results. This was done based on Cronbach’s alfa value of each dimension as well as on the item to total correlation coefficients. At the same time, the number of items was condensed through factor analysis. Parasuraman
et al. passed through stages of seven dimensions and 34 items, and five dimensions and 26 items, and finally settled on the five dimensions of tangibles, reliability, responsiveness, assurance, and empathy with corresponding 22 questionnaire items. The developers of the instrument claim that SERVQUAL with its five dimensions and its corresponding items “capture facets of all ten originally conceptualised dimensions” (Zeithaml et al. 1990) and could be widely utilised in any industry with only minor modifications (Parasuraman et al. 1991a).
Nagata, Satoh, Gerrard, and Kytómaki (2004) argue that the functional quality is appropriate where the technical quality stays much the same. Richard and Allaway (1993) augmented the gap (SERVQUAL) model by including six items assessing outcome quality increasing the original attributes to 28. To compare the prediction ability of the only model and the functional-technical model, they conducted a regression analysis of attributes of both models using data from 139 adult respondents of pizza consumers. Their result indicated that the model with both functional and technical (outcome) quality attributes is superior in terms of predicting service firm choice as compared to the functional-only model or outcome-only model. The criticism that the gap model only measures attributes of process quality and ignores technical (outcome) quality is consistent with that of Woo and Ennew (2005) and Carman (1990). Carman offered only a mild support for the dimensions proposed by the gap model suggesting that the five generic dimensions be considered as a starting point only on which to add dimensions to improve usefulness.
Another major criticism of the gap model was made by Cronin and Taylor (1992). The primary concern of these researchers was that the model’s ‘expectations’ component is unnecessary and its dimensionality is problematic. Cronin and Taylor argue that the relevance of the expectation-performance gap as the basis for measuring service quality is not sufficiently supported by theory or empirical evidence. Babakus and Boller (1992) also stated that the expectation-performance gap approach to service quality management seems intuitively appealing but questioned the ability of the difference scores to provide additional information beyond that already contained in the ‘perceptions’ component of the gap model. They also argue that the contributor to the gap score was the perceptions score because of a generalised response tendency to rate
expectations high. Cronin and Taylor conducted a study in four service industries to investigate whether a performance-only instrument of service quality measurement is superior to the expectation-performance gap model. On the basis of this study, Cronin and Taylor (1992) contend that in all industries surveyed, the performance-only instrument (which they called SERVPERF) explains more of the variations in the global (overall) measure of service quality. Thus, Cronin and Taylor (1992) concluded that the gap model’s expectation component is unnecessary, although this conclusion has been challenged by Parasuraman et al. (1994) in an article they wrote in response to Cronin and Taylor and Teas (another critic of the model). In this article, Parasuraman et al. (1994) argue that high performance on an attribute does not necessarily indicate high quality because it may not be high enough from the customer’s standpoint; hence the customer’s expectation component is an important norm.
Http://escipub.com/journal-of-theoretical-applied-economics/ 6
the individual dimensions of service quality […]’ (word in parentheses added).
In their 1988 work, Parasuraman et al. defined ‘expectations’ as ‘desires or wants of consumers,
i.e. what they feel a service provider should offer rather than would offer’. The ‘expectations’ component was designed to measure customers’ normative expectations (Parasuraman et al.
1990). Teas (1993a; 1993b) argue that this definition of expectations is somewhat vague and has questioned respondents’ interpretation of the ‘expectations’ component in the gap model. Teas (1993a) contend that a considerable percentage of the variance of the gap model expectations measure can be explained by the difference in respondents’ interpretations. Following the results of a number of replication studies, Parasuraman
et al. (1991b; 1994) have responded to these criticisms by redefining expectations as ‘the service customers would expect from excellent service organisations’, rather than ‘normative’ expectations of service providers.
In a different concern, Teas (1993a) also questioned the meaningfulness of the model’s ‘performance minus expectation’ specification. Teas (1993a) argue that the specification is meaningful only if the service feature being assessed is a vector attribute.1 The gap model
assumes that customers are likely to consider the 22 items as vector attributes. However, Teas’ (1993a) concern that the model’s 22 items may be classic-ideal-point attributes—that is, one on which a customer’s ideal expectation is at a finite level, in which case the ‘performance minus expectation’ specification becomes problematic. In a classic-ideal-point (expectation) attribute assumption, performance beyond the customer’s ideal point displeases the customer, giving rise to a decrease in quality. However, Parasuraman et al. (1994) responded stating that ‘for a vast
1 Vector attribute is one on which a customer’s ideal expectation
is at an infinite level. That is, with vector attributes, performance higher than expectation is always preferable.
majority of the respondents, the vector-attribute assumption is tenable’ even for the service attributes included in Teas’s (1993a) study.
In spite of a number of concerns and shortcomings, the gap model has showed particular strength in the representation of functional quality (Woo and Ennew 2005). It has also been shown to be a reliable and valid measure of service quality with relatively stable dimensions across service industries (Parasuraman et al. 1988). It also has proved to be very popular and has generated much research and application across different industry sectors and countries (e.g. Sachdev and Verma 2002; Urdang and Howey 2001; Nel, Pitt, and Berthon 1997; Dassen 1995; Richard and Allaway 1993; Bojanic 1991).
study, Cronin and Taylor (1992) contend that in all industries surveyed the performance-only instrument (which they called SERVPERF) explained more of the variations in the global (overall) measure of service quality than the expectation-performance gap. Thus, Cronin and Taylor (1992) concluded that the model’s expectation component is unnecessary. The model is expressed in the following equation: Quality = f (Performance)
Where ‘Performance’ is the perception of service users about the performance of the service provider on identified quality attributes.
In view of the foregoing debate the following research questions are put forward:
1. What are the determinants of overall service quality in the audit service market?
2. Based on the identified determinants of overall audit service quality which of the two service quality measurement models (gap model and performance-only model) is superior in terms of construct validity and predictive power.
In this study, the quality construct is measured in terms of its technical outcome and functional aspects of the audit service market. Following the dominant definition of service quality in the marketing literature, the perceptions of supervisory board members on the technical and functional attributes of audit service quality are used in this study to measure service quality. Audit service quality is measured using the two dominant service quality measurement models, the gap model (SERVQUAL) and the performance-only model (SERVPERF).
AUDIT SERVICE QUALITY
Audit service quality has been one of the most important issues facing the audit profession. Investors, lenders, and other stakeholders need reliable information generated by companies for sound economic decision-making. Generally, external auditors give services in the areas of information risk management, attestation of
historical financial statements, systems design and development, and internal control assessments for efficiency and effectiveness. The value of these services depends, among other things, on the quality of the audit firm that executes the engagement. Despite its importance and the various approaches used to examine it, audit quality is not explicitly defined and little is known about the factors that are perceived to affect it. Like in many other services, audit quality is characterised by a strong ambiguity that makes it hardly observable, definite, and measurable (Wooten 2003; Herrbach 2001). Audit service is characterized by intangibility of output for which precise specifications for the uniform quality of its output are difficult, if at all possible, to set. It is also characterized by inseparability of the provision and consumption of the service. And finally, different users of, and parties to, the service may have different expectations and perceptions for the same service. The above characteristics make it impossible for users like supervisory directors to make an ex ante assessment of factual audit quality because of limited access to important variables (Knapp 1991). Several studies have applied a behavioural approach in understanding and measuring audit service quality (e.g., Duff 2004; Morton 1998; Warming-Rasmussen and Jensen; Dassen 1995; Carcello, Hermanson, and McGrath 1992). Following these studies, we identify attributes of audit quality based on the perception of one group of audit service users, supervisory board members of large and medium corporations in the Netherlands. We then investigate which attributes are the most important determinants of perceived overall audit quality. Therefore, this paper, in part, tries to answer the questions “what are the determinants of perceived overall audit quality?”
Http://escipub.com/journal-of-theoretical-applied-economics/ 8
technical audit quality to the risk of detecting and disclosing material misstatements in the financial statements (DeAngelo 1981). Accordingly, DeAngelo (1981) defines audit quality as the likelihood that material misstatements in the financial reports will be discovered (auditor competence) and that auditors will report these misstatements (auditor independence).
DeAngelo’s (1981) definition seems to imply that audit quality is assessed based on the perception of the market as to whether a given auditor is competent and independent enough to minimize the cost associated with agency conflict. Following this argument, it is the perception of the principal (mainly supervisory directors as representatives of shareholders) and not the preparers of accounting information that is more important in evaluating audit quality. However, because competence and independence are difficult to observe, third parties often use surrogates to relate them with these unobservable quality dimensions. Some of the surrogates used in these studies are: audit firm size/brand name reputation (Krishnan and Schauer 2000; Craswell, et al.
1995; Knapp 1991; Palmrose 1988; DeAngelo 1981); auditor tenure (Carcello and Nagy 2004a; Vanstraelen 2000; Knapp 1991); industry specialisation (DeFond et al. 2000; Deis and Giroux 1992); audit fee premium (Simon 1997); auditor litigation (Palmrose 1988); and voluntary membership in peer review programs (Deis and Giroux 1992). As a result, these studies do not take into account the functional (relational) aspect that is inherent to the provision of audit services as there seems to be a continuous nature of relationship between a client and an audit firm. For the supervisory directors, this relationship is mostly apparent at the time of communicating the findings of the audit, when the supervisory directors need clarifications on certain issues and questions, as well as in the auditor’s role in crisis situations. The engagement partner plays a greater role here as contact of the supervisory
directors is usually with the audit partner rather than with the audit team. Therefore, the definition of quality in terms of the agency problem should thus be integrated with the functional aspect of quality.
An integrated literature review in the economics of auditing and expectation-gap studies has enabled us to identify attributes of auditor competence (detection ability) and independence (willingness to report). Furthermore, from the behavioural audit quality and marketing literature we identified those attributes that determine the functional aspect of the audit service process. Therefore, we measure audit service quality in terms of auditor competence, auditor independence, as well as functional dimensions.
As part of the development of a valid measure of quality attributes, Churchill (1979) suggests that an experience group be involved in the attributes identification procedure. Consequently, the attributes we identified were presented to two highly experienced supervisory directors and seven audit partners for discussion on their relevance for supervisory directors’ perception of audit service quality. A total of 76 attributes of audit service quality were presented to the experience group for discussion. The experience group indicated that the attributes identified have different levels of relevance for supervisory directors. Accordingly, the items that most of the interviewees agreed to be highly (and moderately) relevant are selected for our survey.
the attributes that are incorporated in the final survey instrument.
HYPOTHESES ON THE DETERMINANTS OF OVERALL AUDIT QUALITY
Functional audit quality
The perceptions of supervisory directors can be influenced by the interactions they have with the audit firm’s personnel (mainly with the audit partner). Theoretical and empirical studies (Morton 1998; Dassen 1995; Bojanic 1991; Lehtinen and Lehtinen 1991; Parasuraman et al.
1988 and 1985; Grónroos 1984) have argued that there is a positive relationship between functional audit quality attributes and the overall assessment of audit quality. Indeed functional quality may be important to the extent of offsetting technical quality problems (Saleh and Ryan 1991). Thus, we hypothesise in this study that:
HYPOTHESIS 1A: Functional quality dimensions
identified using the gap model (SERVQUAL) will have a significant positive correlation with perceived overall audit quality.
HYPOTHESIS 1B: Functional quality dimensions
identified using the performance-only model (SERVPERF) will have a significant positive correlation with perceived overall audit quality.
Technical audit quality
Ensuring technical audit quality is one of the mechanisms for minimizing the effect of the agency problem that arises because of information asymmetry. As representatives of the principal (stakeholders), it is an essential part of the supervisory board’s oversight role to ensure the provision of an objective disclosure of financial information (Jensen and Meckling 1976). Therefore, a higher perception of auditor performance on the technical quality dimensions will have a positive effect on the supervisory directors’ assessment of overall audit quality. Dassen found a positive relationship between the detection ability of auditors and overall assessment of audit quality for both clients and
bankers (Dassen 1995). Marketing literature also suggest a positive influence of technical quality on the assessment of overall quality (Sweeney, et al.
1997). Therefore, we hypothesise that:
HYPOTHESIS 2A: Technical audit quality
dimensions identified using the gap model (SERVQUAL) will have a significant positive correlation with perceived overall audit quality
HYPOTHESIS 2B: Technical audit quality
dimensions identified using the performance-only model (SERVPERF) will have a significant positive correlation with perceived overall audit quality.
Auditor independence
Independence is the second dimension of DeAngelo’s (1981) conceptualisation of two dimensional audit quality. National and regional corporate governance codes and best practices (e.g., Commission of the European Communities (2004); Tabaksblat Committee in the Netherlands (2003); Smith committee of the UK (2003); and the Sarbanes-Oxley Act of 2002 in the US) also require that the audit committee recommend the (re)appointment of the external auditor and ensure his independence. Hence, it seems logical to expect that supervisory directors will assess audit quality as high for those auditors who appeared to be independent. Thus:
HYPOTHESIS 3A: Perceived dimensions of auditor
independence identified using the gap model (SERVQUAL) will have a significant positive correlation with assessed overall.
HYPOTHESIS 3B: Perceived dimensions of auditor
independence identified using the performance-only model (SERVPERF) will have a significant positive correlation with assessed overall.
RESEARCH METHOD Questionnaire
Http://escipub.com/journal-of-theoretical-applied-economics/ 10
companies. In developing our questionnaire the items of the gap model are adapted by including quality attributes pertaining to the core functions of the audit service, excluding items which, exploratory interviews on the identification of audit quality attributes have suggested to be irrelevant for the our target users of the audit service (supervisory directors), rewording and changing some of the items in the gap questionnaire to enable them reflect the audit function. Using a 7-point Likert scale, the questionnaire is designed to provide data on:
• The desired expectation of supervisory directors with regard to the 52 audit quality attributes.
• The perception of supervisory directors about their auditors’ performance with regard to the 52 audit quality attributes.
• Supervisory directors’ assessment of overall quality of their auditors using a single scale measure of ‘7’ for excellent and ‘1’ for poor.
• Supervisory directors’ opinion on the independence of their auditors. The assessment is made using two experimental questions on auditor independence. These questions ask whether their auditors would issue a qualified opinion or report to the audit committee if and when certain irregularities discovered are not resolved by the management.
The questionnaire was pre-tested on four supervisory directors to see if it has been presented in a realistic, understandable, and easy to fill-in manner. The participants in the pre-test were able to give us information on the difficulty they encountered in filling-in the questionnaire. All the respondents suggested that the questionnaire was realistic.
1 According to a respondent, there has been an increased interest
on the roles of supervisory directors in corporate governance in the Netherlands. As a result, supervisory directors are being
Sample and Response
The EURONEXT-Amsterdam and the REACH (Review and Analysis of Companies in Holland) databases were used to select 1000 supervisory directors who would participate in the survey. For the purpose of identifying the names and addresses of these 1000 supervisory directors, 382 large listed and non-listed companies were selected (151 listed companies from the EURONEXT-database and 231 from the REACH-database). Each of these participants was provided with an envelope containing the questionnaire, a covering letter, a self-addressed reply card, and a self-addressed return envelope. The survey instrument was sent in the summer of 2003 to about 1000 supervisory directors and resulted in 69 usable responses. Given the length of the survey questionnaire and the trend of low response rate in surveys that target supervisory directors in the Netherlands, a response rate of about 7 percent1 is not surprising.
Data analysis
In this study we have used descriptive statistical methods (mean and standard deviation) to measure customers’ expectation and perception scores. Factor analysis is, then, made in order to reduce the large number of quality attributes into manageable dimensions. These dimensions are then, regressed as independent variables against the dependent variables ‘overall service quality’ and ‘behavioural intensions’.
Reliability and validity
Ensuring the reliability and validity of the measurement indicators of a concept is crucial for the quality of the research results and inferences made from them. A measurement is reliable when one obtains much the same result on different occasions (de Vaus 1996). However, due to practical reasons, it is often not possible to get
responses from the same people in different occasions. Thus, de Vaus (1996) suggests that, alternatively, the best way to create reliable indicators is to use multiple-item indicators to measure the one concept and look for consistency of a person’s response on the different items. This provides a statistic measure of the overall reliability of the scale called ‘Cronbach (coefficient) alpha’ with index ranging between 0 and 1. This statistic is the most commonly accepted measure for assessing the internal consistency of a multi-item measurement scale (Nel, Pitt, and Berthon 1997; Churchill 1979). The higher the alpha the more reliable the measurement scale is with an alpha of 0.70 and above being considered as reliable as a rule of thumb (de Vaus 1996). In this study, we used alpha to measure the reliability of our scales and the results are reported in the next section. The result show that all factors extracted using the two quality measurement models indicated good internal consistency among the variables within each dimension.
The items (attributes) we included and measurement instrument used should also be able to capture the construct we intend to measure (audit service quality). This is what is referred to as the construct validity of the measure. Construct validity pertains to the extent to which a particular measure is rooted in theoretical foundation (de Vaus 1996). The
literature review made from the service marketing in and the economics of auditing is for the purpose of identifying attributes of audit service quality that are based on sound theoretical and empirical foundation.
RESULTS
Dimensions of Audit Quality
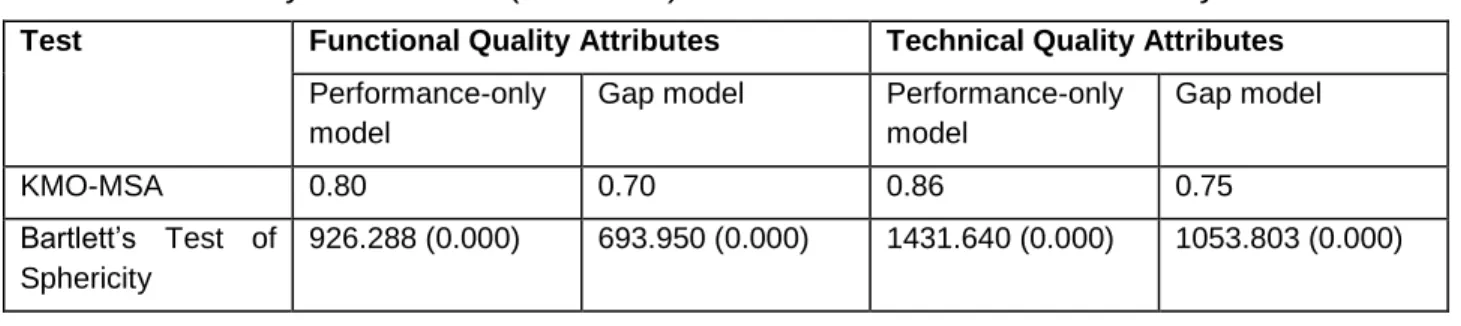
We conduct factor analysis on the 52 quality attributes to reduce them to a manageable number of quality dimensions which are needed for further analysis. The factor analysis is made separately for the technical and functional dimensions because of low response rate. Low response rate limited the use of factor analysis because of large number of variables per respondent (Hair et al. 1998). The suitability of the variables for factor analysis is measured using Bartlett’s test of sphericity and KMO measure of sampling adequacy (MSA). The values of these statistics indicate the appropriateness of the variables in the two models for factor analysis (see table 1). Principal components analysis is used in order to get a simplified and uncorrelated variables explaining the quality construct (Hair et al. 1998; Kim and Mueller 1994). Only variables with factor loadings above 0.45 are accepted as belonging to a factor2. These dimensions are then
regressed as independent variables against the dependent variables ‘overall audit quality’ to test our hypotheses.
Table 1: Suitability of variables (attributes) in the two models for factor analysis
Test Functional Quality Attributes Technical Quality Attributes
Performance-only model
Gap model Performance-only model
Gap model
KMO-MSA 0.80 0.70 0.86 0.75
Bartlett’s Test of Sphericity
926.288 (0.000) 693.950 (0.000) 1431.640 (0.000) 1053.803 (0.000)
2 There is no absolute rule as to how high a variable’s correlation
Http://escipub.com/journal-of-theoretical-applied-economics/ 12
No. of variables 23 22 23 22
No. of factors 5 4 4 4
Rotation method Equamax Varimax Equamax Equamax
Dimensions of audit quality identified using gap (SERVQUAL) model
Factor analysis on the gap scores resulted in eight factors equally divided between functional quality factors and technical quality factors. The factors are subjectively labelled in an attempt to find an explanation that best reflects the properties shared by the set of variables (attributes) within
each factor. An attempt has been made to reduce the subjectivity of the factor labelling by involving more people (academicians and practitioners) in the labelling process. Table 2, panels A and B presents the factor solutions for functional attributes and technical attributes respectively.
Only one functional factor (Professionalism) with
an alpha of 0.60 violated the minimum 0.70 rule of thumb.
Table 2: Factor solutions for Gap (SERVQUAL) variables; Panel A: Functional factors
FACTORS
Variables
Factor Loadings
Cronbach’s Alpha
Cumulative Variance
RELIABLE AUDIT PROCESS
Regulatory Knowledge 0.774 0.84 17.6
Good overall reputation 0.735
Meet deadline 0.699
Provisions to keep clients up-to-date 0.681
Audit firm's formal quality procedures 0.648
Knowledge of the internal and external environment of the client 0.613
Ability to be expressive 0.549
EASY-TO-DEAL-WITH
Accessibility of Auditor to executive directors 0.660 0.75 31.8
Responsive to the needs of executive directors 0.658
Audit effectiveness 0.641
Reliable in handling client service problems 0.615
Accessibility of auditor to supervisory board 0.566
Responsive to the needs of supervisory board 0.550
PROVIDING QUALITY INSIGHTS
Comments on the quality of forecasts and targets 0.813 0.76 44.9
Comments on the quality of executive directors 0.773
Provision of other services 0.644
Bench mark comparisons on the quality of internal control
0.578
Pro-active advice 0.556
Reasonable audit fee 0.715 0.60 55.6
Active participation in the audit by audit partner 0.646
Maintain error free record 0.551
Use of client's internal audit 0.549
Panel B: Technical factors
FACTORS
Variables
Factor Loadings
Cronbach’s Alpha
Cumulative Variance
WHISTLE BLOWING (PUBLIC AGENT)
Report material management fraud to the public 0.874 0.89 19.8
Report illegal acts to the public 0.854
Report going concern problems to the public 0.796
Report material errors in the financial statements to the public 0.784
Report material employee fraud to the public 0.761
Report earnings management to the public 0.710
Report material deficiencies in internal control to the public 0.629
DETECTION OF FRAUD AND ILLEGAL ACTS
Detect material management fraud 0.890 0.88 36.7
Detect illegal acts 0.859
Detect material employee fraud 0.854
Report material management fraud to the supervisory board 0.524
SUPERVISORY BOARDS’ WATCHDOG
Report going concern problems to the supervisory board 0.775 0.82 51.9
Detect going concern problems 0.665
Provide early warnings of company problems to the supervisory board
0.630
Report illegal acts to the supervisory board 0.610
Report material employee fraud to the supervisory board 0.569
INTEGRITY IN FINANCIAL REPORTING PROCESS
Detect earnings management in the financial statements 0.775 0.83 66.6
Report material errors in the financial statements to the supervisory
board 0.602
Report earnings management to the supervisory board 0.593
Detect material deficiencies in internal control 0.580
High level of integrity 0.563
Report material deficiencies in internal control to the supervisory board
0.530
Http://escipub.com/journal-of-theoretical-applied-economics/ 14
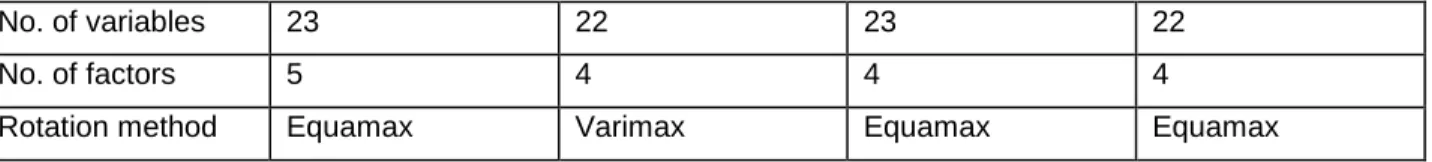
Factor analysis using scores from the performance-only model resulted in five functional
and four technical quality factors. The factors are shown in table 2, panels A and B for functional attributes and technical attributes respectively. The panels in the table list the reliability of the
factors as measured by Cronbach (alpha)
coefficient (de Vaus 1996) and the variance
accounted for by the factors. The minimum 0.7 alpha rule of thumb was violated by two functional factors (responsiveness and accessibility).
Table 3: Factor solution for performance-only variables;
Panel A: Functional factors
FACTORSa
Variablesb
Factor Loadings
Cronbach’s Alpha
Cumulative Variance
RELIABLE AUDIT PROCESS
Maintain error free record 0.749 0.87 15.8
Knowledge to answer supervisory board’s questions 0.687
Audit effectiveness 0.650
Meet deadline 0.634
Responsive to the needs of supervisory boards 0.589
Ability to be expressive 0.554
COMPANY AND INDUSTRY KNOWLEDGE (Knowledge Dissemination)
Knowledge of the internal and external environment of the client 0.740 0.86 31.0
Use of client's internal audit 0.686
Provisions to keep clients up-to-date 0.650
Regulatory Knowledge 0.618
Use of international contacts and resources 0.588
Active participation in the audit by audit partner 0.587
Industry specialist 0.468
RESPONSIVENESS
Reliable in handling client service problems 0.772 0.69 44.4
Responsive to the needs of executive directors 0.714
Reasonable audit fee 0.470
PROVIDING QUALITY INSIGHTS
Comments on the quality of forecasts and targets 0.890 0.78 55.7
Comments on the quality of executive directors 0.882
Bench mark comparisons on the quality of internal control 0.593
ACCESSIBILITY
A provision for private session 0.640 0.58 66.1
Good overall reputation 0.622
Accessibility of Auditor to executive directors 0.618
Accessibility of Auditor to supervisory boards 0.458
Note: a Labels in capital letters are factors extracted
Panel B: Technical factors
FACTORS
Variables
Factor Loadings
Cronbach’s Alpha
Cumulative Variance
WHISTLE BLOWING (Public Agent)
Report material management fraud to the public 0.917
0.95 24.5
Report illegal acts to the public 0.912
Report material deficiencies in internal control to the public
0.909
Report earnings management to the public 0.881
Report material employee fraud to the public 0.861
Report going concern problems to the public 0.839
Report material errors in the financial statements to the public
0.820
DETECTION AND REPORTING OF FRAUD AND ILLEGAL ACTS
Report material management fraud to the supervisory board 0.881
0.93 45.1
Report illegal acts to the supervisory board 0.847
Report material employee fraud to the supervisory board 0.725
Detect illegal acts 0.719
Detect material management fraud 0.685
Detect material employee fraud 0.623
Report going concern problems to the supervisory board 0.575
INTEGRITY IN FINANCIAL REPORTING PROCESS
Report material deficiencies in internal control to the supervisory board
0.807 0.91 65.1
Report material errors in the financial statements to the supervisory board
0.741
Detect earnings management in the financial statements 0.708
High level of integrity 0.686
Detect material deficiencies in internal control 0.682
Report earnings management to the supervisory board 0.643
Detect going concern problems 0.612
Detect material errors in the financial statements 0.592
INDEPENDENT ATTITUDE
Independent of all stakeholders 0.814 n.a. 74.6
Hypotheses Testing on the Determinants of Overall Audit Quality
An OLS regression model is used to test hypotheses H1, H2, and H3. This model has overall audit quality as the dependent variable.
Http://escipub.com/journal-of-theoretical-applied-economics/ 16
the variables taken as
predictors of the dependent variable. Stage 1 will take all functional, technical, and independence variables; stage 2 will have technical audit quality (auditor competence and independence) factors as independent variables; and stage 3 will take only functional factors as independent variables. The model is stated as follows:
OAQx =c + a0FAQpx + a1TAQpx + a2INDpx
Where:
OAQx =Overall audit quality statement for case x;
c=Constant;
FAQpx =Functional audit quality factor score p for
case x;
TAQpx =Technical audit quality factor score p for
case x;
INDpx =Independence statement (factor score) p
for case x;
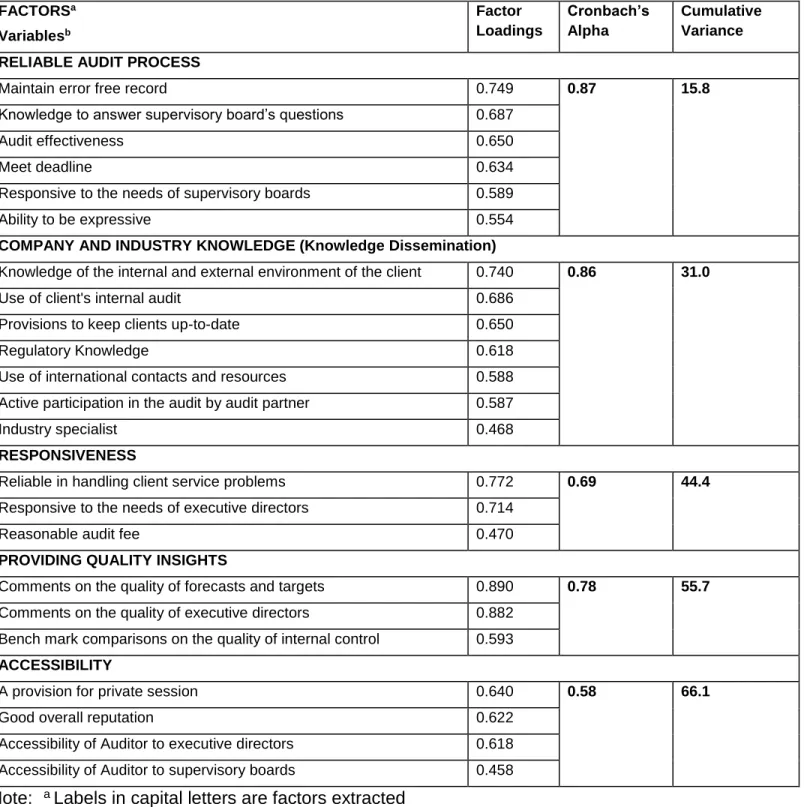
The Gap Model
Table 4 shows the results of the regression model for the gap model variables. The table shows that the gap model variables in the three stages of the regression model explain a significant variance of overall audit quality. Again, the highest prediction is acquired when all the functional, technical, and auditor-independence variables are selected at the same time (stage 1). Unlike the performance-only model, the most important determinants of overall audit quality in the gap model are functional quality dimensions (reliable audit process, easy-to-deal-with, and professionalism) and auditor independence dimension.
Table 4: Determinants of overall audit quality using gap (SERVQUAL) factors
Model 1: Dependent variable is overall audit quality
Gap (Performance minus
Expectations) factors
Stage 1 Stage 2 Stage 3
B1 sig. B sig. B sig.
(Constant) 4.029 *** 4.235 *** 5.324 ***
Reliable audit process (H1) 0.409 *** - - 0.438 ***
Bring to the attention of supervisory board/audit committee (H3)
0.221 *** 0.188 ** - -
Easy-to-deal-with (H1) 0.397 *** - - 0.435 ***
Professionalism (H1) 0.262 *** - - 0.316 ***
Providing quality insights -0.044 - - -0.017
Whistle blowing/Public agent -0.002 -0.013 - -
Detection of fraud and illegal acts (H2)
0.015 0.216 ** - -
Supervisory boards' watchdog
(H2/H3)
-0.004 0.190 * - -
Qualified opinion -0.073 -0.140 - -
Integrity in financial reporting process (H2/H3)
-0.018 0.399 *** - -
Observations 69 69 69
Adj R-squared 0.496 0.330 0.429
***, **, *: Significance level at 0.01, 0.05, and 0.10 respectively (two-tailed)
Note: H1, H2, H3 in parentheses next to the variables indicate that these hypotheses are supported.
Three technical dimensions were also found to be statistically significant determinants of overall audit quality. These are ‘integrity in financial reporting process’, ‘supervisory directors’ watchdog’, and ‘detection of fraud and illegal acts’. The first two dimensions incorporate aspects of auditor independence because they concern both the detection and reporting of errors and irregularities. However, the impact of these dimensions was camouflaged by their multicollinearity with some of the functional dimensions (mainly with the ‘reliable audit process’ dimension). Once more, those variables which are found to be statistically significant are positively related to overall audit quality. Thus, in the gap model, the hypothesized relationships (H1A, H2A, and H3A) are supported. Overall audit quality is positively influenced by several of the identified functional, technical, and independence quality dimensions.
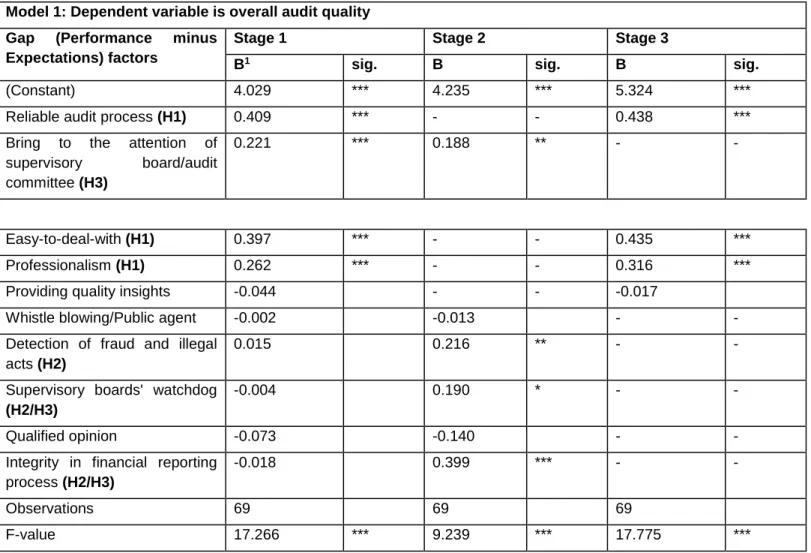
The Performance-only Model
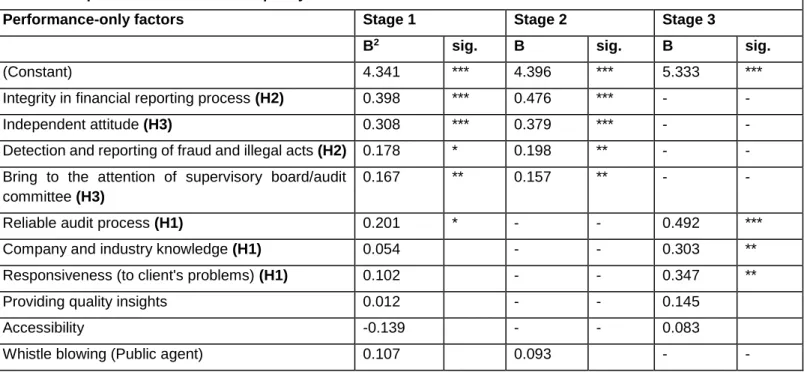
The results of the regression model at the three stages of the model are presented in table 5. The table shows that the variables in the three stages of the model explain a significant variance of overall audit quality. The adjusted R-squaredfor all three stages are rather high. The highest prediction is acquired when all of the independent variables are selected at the same time (stage 1). The results in table 5 show that, when performance-only variables are considered, the determinants of overall audit quality are mainly related to the auditor’s detection ability and independence. The auditor’s personal character in terms of his reliability (accuracy and dependability) in the audit process also appears to be important for supervisory directors. In general, the technical quality attributes are found to be the most important determinants of overall audit quality.
Table 5: Determinants of overall audit quality using performance-only factors
Model 1: Dependent is overall audit quality
Performance-only factors Stage 1 Stage 2 Stage 3
B2 sig. B sig. B sig.
(Constant) 4.341 *** 4.396 *** 5.333 ***
Integrity in financial reporting process (H2) 0.398 *** 0.476 *** - -
Independent attitude (H3) 0.308 *** 0.379 *** - -
Detection and reporting of fraud and illegal acts (H2) 0.178 * 0.198 ** - -
Bring to the attention of supervisory board/audit committee (H3)
0.167 ** 0.157 ** - -
Reliable audit process (H1) 0.201 * - - 0.492 ***
Company and industry knowledge (H1) 0.054 - - 0.303 **
Responsiveness (to client's problems) (H1) 0.102 - - 0.347 **
Providing quality insights 0.012 - - 0.145
Accessibility -0.139 - - 0.083
Http://escipub.com/journal-of-theoretical-applied-economics/ 18
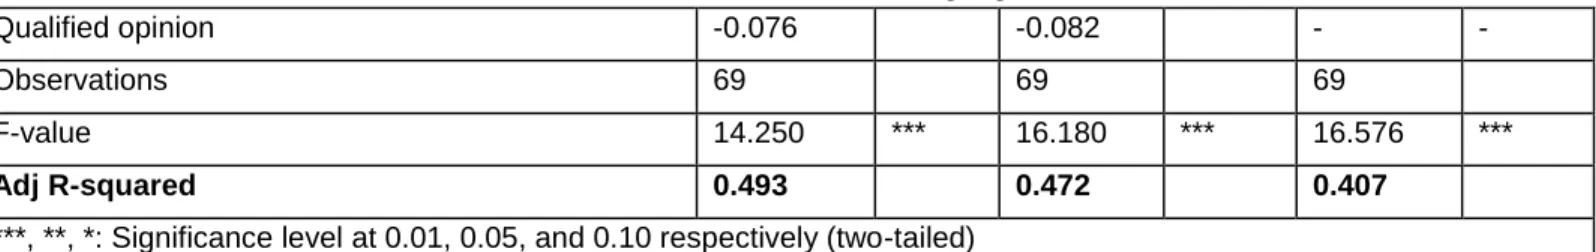
Qualified opinion -0.076 -0.082 - -
Observations 69 69 69
F-value 14.250 *** 16.180 *** 16.576 ***
Adj R-squared 0.493 0.472 0.407
***, **, *: Significance level at 0.01, 0.05, and 0.10 respectively (two-tailed)
Note: H1, H2, H3 in parentheses next to the variables indicate that these hypotheses are supported.
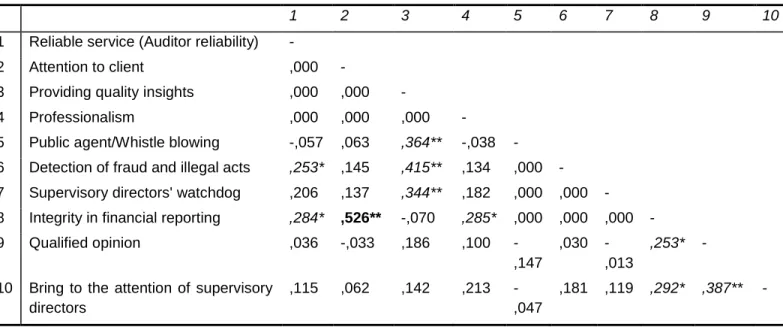
It should be noted, however, that there was significant multicollinearity between the ‘integrity in financial reporting process’ and the ‘responsiveness’ dimensions (see table A of appendix I). And thus, this multicollinearity has probably masked the impact of the ‘responsiveness’ dimension on overall audit quality. In addition, there was some degree of multicollinearity between the dimensions ‘independent attitude’ and ‘company and industry knowledge’. Consequently, the latter’s impact was not revealed in stage 1. Stage 3 shows that this is indeed the case as the ‘responsiveness’ and the ‘company and industry knowledge’ dimensions became significant predictors when only the functional dimensions are selected in the regression model. Thus, stage 3 appears to hint the importance of these two functional dimensions in supervisory directors’ assessment of overall audit quality. All of the statistically significant dimensions influence overall audit quality in the hypothesized direction. Thus, in the performance-only model also, the three hypotheses with regard to the determinants of overall audit quality (H1B, H2B, and H3B) are supported.
Comparison of the Two Quality Measurement Models
Construct Validity
The items (attributes) we included and measurement instrument used should be able to capture the construct we intend to measure (audit service quality). Construct validity pertains to the
extent to which a particular measure is rooted in theoretical foundation (de Vaus 1996). An integrated literature review has been made for the purpose of identifying attributes of audit quality that are based on sound theoretical and empirical foundation. To this effect, literature on audit quality, audit expectation gap, and service marketing were consulted. Following Churchill (1979), the identification of valid quality attributes from theoretical and empirical literature was augmented by exploratory interviews with experience group.
The process of construct measure validation also involves ensuring the convergent and discriminant validity of the measure. According to Churchill (1979), convergent validity evidences the extent to which a measure correlates highly with other methods designed to measure the same construct. And discriminant validity is the extent to which a measure is novel and not simply a reflection of some other construct. An examination of the correlation matrix in table 6 indicates that the gap model, the performance-only model, and overall service quality are highly correlated with each other showing that the two measurement models possess convergent validity. Again, the performance-only and the gap models showed discriminant validity by having relatively lower correlation with three measures of behavioural intentions of customers which are non-quality concepts.
1 2 3 4 5 6
1 Performance-only model 1
2 GAP model .790 1
3 Overall audit quality .648 .545 1
4 Recommend auditor to be retained .250 .100 .329 1
5 Recommend the purchase of other services .248 .193 .203 .191 1
6 Recommend our auditor to a friend .437 .347 .713 .386 .353 1
Predictive power
Consistent with previous service quality studies (e.g., Richard and Allaway 1993; Dassen 1995) and based on the suggestion by de Vaus (1996), we analysed the power of the two quality measurement models on the basis of the coefficient of determination (R2) of model 1. A
summary of the adjusted R2 for the three models
is given in table 7. As may be recalled from the sections on hypotheses testing for overall audit quality, the regression model was applied under three alternatives of independent variables (three stages).
Table 7: The predictive power of the two models
Model
Adj. R-squared for three alternatives of independent variables Functional, technical,
and independence variables
Technical and independence variables
Functional variables
Performance-only model 0.493 0.472 0.407
Gap model 0.496 0.330 0.429
The regression model revealed that the explanatory power for the two quality measurement models is improved when they incorporate both functional and technical (and independence) quality dimensions. Contrary to the findings of Cronin and Taylor (1992), the gap model outperformed the performance-only model in explaining perceived overall audit quality when all the variables are considered at the same time. Nevertheless, the difference was marginal. When only the technical and auditor-independence variables are considered, the performance-only model has a much higher explanatory power than the gap model. This is perhaps due to the fact that technical dimensions mainly consist of items that
are predefined by statutory and professional audit standards and that the expectations of users has less importance in their measurement. In contrast, the gap model explains slightly more of the variance when only the functional variables are considered.
Http://escipub.com/journal-of-theoretical-applied-economics/ 20
performance-only model can also be used with very little loss of explanatory power.
CONCLUSIONS AND IMPLICATIONS
Our statistical analyses indicated that for both the performance-only and the gap models the functional, technical, and independence factors are positive determinants of overall audit quality. In the search for a suitable quality measurement model for the audit service, the results indicated that both the performance-only model and the gap model have done quite well. The argument by Cronin and Taylor (1992) that the gap model has low explanatory power compared to the performance-only model did not materialise in our study. In fact, the gap model has a slightly better predictive power than the performance-only model in two of the three alternatives of independent variables selection (when all independent variables are selected at the same time and when only functional variables are selected). However, the performance-only model performs well above its counterpart when the variables in consideration are the traditional duties of the auditor as well as auditor independence (technical dimensions). And finally, our analysis indicated that the service marketing models for the measurement of quality would be improved when core outcome (technical) variables are incorporated.
Our results are limited by multicollinearity between some technical and functional quality factors. This is caused by the low response rate that did not allow us to conduct factor analysis on all the functional and technical variables at the same time (see appendix I, table A and table B).
REFERENCES
Babakus, E. and. Boller, G. W (1992), “An Empirical Assessment of the SERVQUAL Scale”, Journal of
Business Research, Vol. 24, pp. 253-268.
Bojanic, D. C. (1991), “Quality Measurement in Professional Services Firms”, Journal of Professional Services Marketing, Vol. 7 (2), pp. 27-36.
Bolton, R. N. and Drew, J.H. (1991), “A Multistage Model of Customers’ Assessment of Service Quality and Value”, Journal of Consumer Research, 17, pp. 375-384. Boshoff, C., Mels, G. and Nel, D. (1994), “The Relative Influence of Service Quality in the Banking Industry”,
South African Journal of Business Management,
(March), Vol. 25, Issue 1.
Buttle, F. (1996), “SERVQUAL: review, critique, research agenda”, European Journal of Marketing, Vol. 30, No. 1, pp. 14.
Carcello, J.V. & Nagy, A.L. (2004a). “Audit firm Tenure and Fraudulent Financial Reporting”. Auditing: A Journal of Practice and Theory, 23, pp. 55-69.
Carcello, J. V., Hermanson, R. H., and McGrath, N. T., (1992), “Audit Quality Attributes: The Perceptions of Audit Partners, Preparers, and Financial Statement Users”, Auditing: A Journal of Practice and Theory,
(Spring) Vol. 11, No. 1, pp. 1-15.Caruna et al. 1998. Carman, J. M. (1990), “Consumer Perceptions of Service Quality: An Assessment of the SERVQUAL Dimensions”,
Journal of Retailing, Vol. 66, (Spring), pp. 33-55.
Caruna, A., B. Ramaseshan, M. T. Ewing, and Rouhani F. (1998), “Expectations about Management Consultancy Services: Testing the Assumptions of Equivalence Across, Australian and Singaporean Firms”,
Journal of Professional Services Marketing, Vol. 18 (1), pp. 1-10.
Churchill, JR. G. A. (1979), “A Paradigm for Developing Better Measures of Marketing Constructs”, Journal of
Marketing Research, Vol. XVI, pp. 64-73.
Commission of the European Communities (2004), “Proposal for a Directive of the European Parliament and of the Council on statutory Audit of Annual Accounts and Consolidated Accounts and Amending Council Directives 78/660/EEC and 83/349/EEC”, COM (2004) 117, Brussels.
Craswell, A. T., Francis, J. R, and Taylor S. L. (1995), “Auditor Brand Name Reputations and Industrial Specialisations”, Journal of Accounting and Economics,
20, pp. 297-322.
Cronin, J. J. & Taylor, S. A. (1992). “Measuring Service Quality: A Re-examination and extension”, Journal of Marketing, 56, pp. 55-68.
Dassen, R. J. M. (1995), “Audit Quality: An Empirical Study of the Attributes and Determinants of Audit Quality Perceptions” (Dissertation, University of Maastricht) de Vaus, D. A. (1996), “Surveys in Social Research”,
DeAngelo, L.E. (1981a), “Auditor Size and Audit Quality”,
Journal of Accounting and Economics, 3, pp. 183-199.
DeFond, M. L. Francis, J. R., and Wong T. J. (2000), “Auditor Industry Specialisation and Market Segmentation: Evidence from Hong Kong”, Auditing: A Journal of Practice and Theory, 19, (Spring), pp. 49-66. Deis, D. R. Jr., and Giroux, G. (1992), “Determinants of Audit Quality in the Public sector”, The Accounting Review, 67(3), pp. 462-479.
Duff, A. (2004), “Auditqual, Dimensions of Audit Quality”,
The Institute of Chartered Accountants of Scotland, Antony Rowe Ltd, Great Britain.
Francis, B. (1996), “SERVQUAL, Review, Critique, Research Agenda”, European Journal of Marketing, Vol. 30, Issue 1, p8, 25p.
Grapentine, T. (1998), “The history and future of service quality assessment: connecting customer needs and expectations to business process”, Marketing Research, Vol. 10, No 4, pp. 5-10.
Grónroos, C. (1984), “A Service Quality Model and its Marketing Implications”, European Journal of Marketing,
No. 4, pp. 36-44.
Hair, Jr. J. F., Anderson, R. E., Tatham, R. L. and W. C. Black (1998), “Multivariate Data Analysis”, 5th ed.,
Prentice-Hall International, Inc. U.S.A.
Herrbach, O. (2001), “Audit Quality, Auditor Behaviour, and the Psychological Contact”, The European
Accounting Review, 10: 4, pp. 787-802.
Jensen, M.C. & Meckling, W.H. (1976). “Theory of the Firm: Managerial Behaviour, Agency Costs, and Ownership Structure”, Journal of Financial Economics, 3, pp. 305-360.
Kim, J. and Meuller, C. W. (1994), “Factor analysis and
Related Techniques”, Edited by M. S. Lewis-Beck, Sage
Publications Inc.
Knapp, M. C. (1991), “Factors that Audit Committee Members Use as Surrogates for Audit Quality”, Auditing: A Journal of Practice and Theory, Vol. 10, No. 1, pp. 35-51.
Krishnan, J. and Schauer, P. C. (2000), “The Differentiation of Quality Among Auditors: Evidence from the Non-for-Profit Sector”, Auditing: A Journal of Practice and Theory, Vol. 19. No. 2, pp. 9-25.
Landrum, H., Prybutok, V. R. Kappelman, L. A., and Zhang, X. (2008), SERVCESS: A Parsimonious Instrument to Measure Service Quality and Information System Success. The Quality Management Journal, 15(3), 17-25.
Lehtinen, U. and. Lehtinen, J. R (1991), “Two Approaches to Service Quality Dimensions”, The Service Industries Journal, Vol. 11, No. 3, (July), pp. 287-303. Morton, A.M. (1998), “Audit Service Quality”: An
Empirical Investigation, PhD. Dissertation, University of Sydney.
Mosahab, R., Mahamad, O. and Ramayah T. (2010), Service Quality, Customer Satisfaction and Loyalty: A Test of Mediation, International Business Research, Vol. 3, No. 4; October, pp. 72-80.
Nagata, H., Satoh, Y. Gerarrd, S. and Kytómaki, P. (2004), “The dimensions that construct the evaluation of service quality in academic libraries”, Performance
Measurement and Metrics, Vol. 5, No. 2, pp 53-65.
Nel, D., Pitt, L. F. and Berthon, P. R. (1997), “The SERVQUAL Instrument: Reliability and Validity in South Africa”, South African Journal of Business Management, Vol. 28, Issue 3, pp. 113 (10p, 6 charts).
Oliver, R. L. (1989), Processing of the Satisfaction Response in Consumption: A suggested Framework and Research Propositions, Journal of Customer
Satisfaction, Dissatisfaction, and Complaining
Behaviour, 2, pp. 1-16.
Palmrose, Z. (1988), An Analysis of Auditor Litigation and Audit Service Quality, The Accounting Review, Vol. LXIII, No. 1, pp. 55-73.
Parasuraman, A., Zeithaml, V. A., and Berry, L. L. (1994), Reassessment of Expectations as a comparison Standard in Measuring Service Quality: Implications for Further Research, Journal of Marketing, Vol. 58, (January), pp.111-124.
Parasuraman, A., Berry, L. L., and Zeithaml, V. A., (1991a), Perceived Service Quality as a customer-based Performance Measure; An Empirical Examination of Organisational Barriers Using an Extended Service Quality Model, Human Resource Management, Vol. 30, No. 3, (Autumn), pp. 335-64.
Parasuraman, A., Zeithaml, V. A., and Berry, L. L. (1991b), Refinement and Reassessment of the SERVQUAL Scale, Journal of Retailing, Vol. 67, No. 4, (Winter), pp.420-450.
Parasuraman, A., Zeithaml, V. A., and Berry, L. L. (1990), An Empirical Examination of Relationships in Extended Service Quality Model, Marketing Science Institute, Cambridge, MA.
Http://escipub.com/journal-of-theoretical-applied-economics/ 22 Parasuraman, A., Zeithaml, V. A., and Berry, L. L. (1985),
A Conceptual Model of Service Quality: Implications for Future Study, Journal of Marketing, 49 (Fall), pp. 41-50.
Ravichandran, K., Mani, B. T., Kumar, S. A. and Prabhakaran, S. (2010), “Influence of Service Quality on Customer Satisfaction: Application of SERVQUAL Model”, International Journal of Business and
Managemen,t Vol. 5, No. 4; pp. 117-124.
Richard, M. D. and Allaway, A. W. (1993), “Service Quality Attributes and Choice Behaviour”, Journal of Service Marketing, Vol. 7., no. 1, pp. 59-68.
Sadchev, S. B. and Verma, H. V. (2002), “Customers Expectations and Service Quality Dimensions Consistency”, Journal of Management Research, Vol. 2, No. 1, (April), pp. 43-52.
Saleh, F. and C. Ryan (1991), “Analysing Service Quality in the Hospitality Industry Using the SERVQUAL Model”,
Service Industries Journal 11, (July), pp. 324-343. Simon, D. T. (1997), “Additional Evidence on the Large Audit Firm Fee Premium as an Indicator of Auditor Quality”, Journal of Applied Business Research (Fall), Vol. 13, p21, 9p.
Smith R. (2003), Audit Committees, Combined Code Guidance, The Financial Reporting Council, UK.
Stank, T. P., Goldsby, T. J. and Vickery, S. K. (1999), “Effects of Service Supplier Performance on Satisfaction and Loyalty of Store Managers in the Fast Food Industry”, Journal of Operations Management, 17, pp. 429-447.
Sweeney, J. C., Soutar, G. N. and Johnson, L. W. (1997), “Retail Service Quality and Perceived Value”, Journal of
retailing and Consumer Services, Vol. 4, No. 1, pp.
39-48.
Tabaksblat Committee (2003), “The Dutch Corporate Governance Code: principles of good corporate governance and best practice provisions”; www.commissiecorporategovernance.nl.
Teas, R. K. (1993a), “Expectations, Performance Evaluation, and Consumers Perceptions of Quality”,
Journal of Marketing, Vol. 57, (October), pp. 18-34. Teas, R. K. (1993b), “Consumer Expectations and Measurement of Perceived Service Quality”, Journal of Professional Service Marketing, Vol. 8, No. 2, pp. 33-53. Urdang, B. S. and Howey, R. M. (2001), “Assessing Damages for Non-performance of a travel Professional— a Suggested Use of SERVQUAL”, Tourism
Management, 22, pp. 533-538.
Vanstraelen, A. (2000), “Impact of Renewable Long-term Audit Mandates on Audit Quality”, The European
Accounting Review, 9: 3, pp. 419-442.
Warming-Rasmussen, B. & Jensen, L. (1998). Quality Dimensions in External Audit Services-An External User Perspective. The European Accounting Review, 7, 65-82.Watkins, Hillison, and Morecroft 2004).
Watts, R. L. and Zimmerman J. L. (1981), “The Market for Independence and Independent Auditors”, Working Paper, University of Rochester.
Woo, K. and Ennew C. T. (2005), “Measuring Business-to-Business Professional Service Quality and its Consequences”, Journal of Business Research, 58, pp. 1178-1185.
Wooten, T. C. (2003), “Research about Audit Quality”,
The CPA Journal, Vol. 73, Issue 1, pp. 48-51.
Zeithaml, V. A. (2000), Service Quality, Profitability, and the Economic Worth of Customers: What We Know and What We Need to Learn, Journal of the Academy of Marketing Science, Vol. 28, No. 1, pp. 67-85.
Zeithaml, V. A., Berry, L. L, and Parasuraman, A., (1996), “The behavioural Consequences of Service Quality”,
Journal of Marketing, Vol. 60 (April), pp. 31-46.
Zeithaml, V. A., Parasuraman, A., and Berry, L. L., (1990), “Delivering Quality Service”, New York Free Press. NY.