The Development of B2b E- Commerce Readiness Assessment Model for SMEs: Identification of Barriers Using AHP Method
Norjansalika Janom
Faculty of Computer Science and Mathematics, Universiti Teknologi MARA Shah Alam
Selangor, Malaysia [email protected]
Mohd Shanudin Zakaria Graduate School of Business National University of Malaysia,
Bangi, Malaysia [email protected]
Abstract
The implementation of inter-organizational systems like business- to- business e-commerce (B2B e-e-commerce) is being categorized as a system with high degree of difficulty since it involves complexity of the multiple relationships and interactions between trading partners. Companies need to consider their own strengths and weaknesses before making decisions to explore new B2B e-commerce without weakening the existing traditional marketing channels. The main aim of this paper is to generate understanding on the development of weighting score of internal and external barrier indicators which impact the B2B e- commerce development of the Small Medium Enterprise (SMEs) in agro- based industry. The analytical process hierarchy (AHP) has been used to establish ranking so that key elements can be determined. The AHP is used due to the fact that its utility outweighs other research methods in terms of providing a more accurate and consistent judgment. Thus, companies able to identify their readiness level for implementing B2B e-commerce and every aspect needed to improve them selves before implementing the applications.
Keywords: B2B E-Commerce, Small Medium Enterprises (SMEs), Barriers, E- Readiness and AnalyticalProcess Hierarchy (AHP)
Introduction
comparisons in B2B e-commerce area, composite indicator (CI) of B2B e-commerce readiness index that is built upon a number of individual barrier indicators is needed. Since the aggregation methods of indicators could lead to different CI values, the quality and reliability of a CI depend heavily on the underlying aggregation scheme (Bobko et al 2007, Zhoa et al 2007b; Hermans et al 2009). The process of obtaining such an index requires different weighted approaches which are methodologically challenging.
The e- readiness assessment metrics that we develop in this research involve the collection of various critical barriers about B2B e-commerce. There is then a need to combine all of this information to produce a model that able to assess B2B e-commerce readiness implementation of the organization. The tasks of combining different indicators to make predictions or arrive at composite B2B e-commerce readiness assessment score has confronted researcher with issues of selecting the most suitable weighted approach. It has been noted that, the weighting of indicators when generating a composite score is an element that need to be looked at, as there are many approaches can be used, including empirical regression weights/statisticaltechnique, weights based on archival information, unit weights and weights directly based on subject matterexpert judgments (Bobko et al 2007). However, this research focuses on Analytic Hierarchy Process (AHP) approach and the description of the steps involved in using the approach.
There are two fundamental approaches to this article. We will first analyze and synthesis the existing literature on the relationships between AHP method with other methods as well as the logic of these methods. Then, the development of B2B e- commerce readiness assessment model using AHP approach will be presented, followed by demonstration of assessment from five SMEs to reaffirms the usefulness of AHP methods in determining measures for B2B e-commerce readiness.
Background
Even though the paper focuses on AHP method, critical analyses on the other available methods are given as guidance to other researchers. In selecting the most suitable approach to establish ranking and assigning weights, there are three different techniques can be used which are assigning equal weights, assigning subjective weights or through statistical techniques.
Equal weights
that use this method of weighting. However, Budhiraja and Sachdeva (2002) argued that the technique is not advisable as the parameters should not having equal level of importance. In addition, according to Einhorn and Hogarth (1975), comparing with statistical method of multiple regression, unit weight always outperform regression weight during validation process, as the method are not associated with sampling error. This is because they are developed a priori and not on a sample data (Bobko et al 2007). However, it should be noted that unit weights are likely to be superior weighting strategies to regression weighting in small samples for example below 75 and likely to be similar in moderately sized samples up to 200. For larger sample, it is believed that regression weights are better (Bobko et al 2007; Dorans and Drasgow, 1978).
Objective weights
In a practical vein, Budhiraja and Sachdeva (2002) mentioned that the determination of weights for each e- readiness barriers can be effectively done through statistical technique of analysis based on the observed values or known as objective weights. The technique assigns weights to parameters based on the observed values. Zhoa et al 2007 suggested the use of weighted product (WP) method called multiplicative optimization model to determine the weight for sub- indicators during the process of constructing the CIs. The method seems to be a better choice since it allows each entity to select a set of weights which are most favourable for itself, thus, avoids the subjectivity in determining the weights for sub-indicators (Zhoa et al 2007c) Principal Component Analysis (PCA) is another technique of assigning objective weight to the parameters. Based on the objective of the analysis which is to identify and classify the critical factor of B2B e- commerce from the perspective of agro based industry, analytical process through statistical technique of factor analysis can be used (Fathian et al 2008 and Kim and Mueller, 1978). The other method to generate weights is through associating Principle component analysis with regression analysis. CIs that are developed by statistical procedures are believed more flexible, adaptable, modifiable over time while it sustains its original structure (Hanafizadeh et al 2009).
Subjective weights
indicator determine its weight. From this, rankings based on the order of preferences can be determined. The experts’ opinion technique is deployed by various composite indices. Example of these indices are the composite indicator of e- business readiness of European Enterprises by OECD and the joint research center (JRC) (Tarantola et al, 2006). The Network Readiness Index (NRI) is another example that uses a combination of “hard” data from reputable institutions and "soft" data from senior business executives around the world under Institute for Management Development's (IMD) Executive Opinion Survey (EOS). Another example of composite indices that based on the opinions of the experts to determine the weights of the different dimensions are Economist Intelligent Units (EIU), Digital Access Index (DAI) and National Informatization Quotient (NIQ). Even though, the method has been widely used, there are several significance limitations of this method. For example, in some cases there are not enough experts in the particular field which the outcomes of the composite index are not robust. Moreover, the use of this method was limited when there are large number of indicators and questions (Hanafizadeh et al, 2009)
However, from the various weighting methods which each has their own strengths and constrains, possibly the hardest decision is to determine what weighting method should be used and in what situation will one method be more suitable than another?
The AHP Method
This research looks for method to help in setting priorities and weights, when both qualitative and quantitative aspects of a decision need to be considered. According to Hermans et al (2009), AHP and BA belong to the same family of participatory methods which possibly makes the choice between of lesser impact. However, method like AHP which serves to quantify relative priorities of factors and alternatives within a specific scale based on human judgment are used n this research (Lee et al., 1995; Hafeez et al., 2000) . But again these processes are based on individual perceptions with reference to the credibility and the quality of their perceptions. The consistency test employed by this method can screen out inconsistent responses thus, respondents who could not provide consistent judgments logically would not achieve the consistent comparison test.
the complex decisions in various fields of management science, economics, finance, politics, and sports (Saaty and Vargas, 1991; Stein and Ahmad, 2008).
Over the past few years, AHP has been used widely for aiding in the decision making process in determining the best selection alternatives involving the identification of critical factor in the IT projects (Shiraz and Manesh, 2010), development of road safety index (Hermans et al 2009), identifying software compatibility problem (Kaarslan and Gundogar, 2008), determination of individual key capabilities (Hafeez and Essmail, 2007), e- learning implementation problem (Begicevic et al 2007), rating system development to rate individual’s credibility (Ekstrom, Bjornsson and Nass 2003), determination of e- readiness indicator rankings (Huang et al 2004; Fotouhiyehpour 2004), measurement for business performance (Cheng et al 2001), evaluation of various ethical situations (Stein and Ahmad, 2008) and many others. In fact, according to Vaidya and Kumar, the method is a well known method and been used widely since 1980’s. Their comparative studies of 150 papers on the usage of the application of AHP, proved that the methods has been widely accepted in social, economical, engineering, education, political, manufacturing, psychology and others. Even though, there was an argument that AHP is not actually a practical approach since most of the results are so close together, thus the effect of weighting in the analysis is not really clear, the advantages far out weight its weaknesses (Hafeez and Essmail ,2007). It is believed that AHP is a powerful tools for comparing alternative design concepts and can easily be understood and applied by the managers.
This paper is intended to demonstrate the development of barriers assessment model to measure B2B e- commerce readiness of SMEs using AHP approach. At the end of the research, five field studies of SME were conducted to illustrate and test the usefulness of the proposed e-readiness assessment framework.
The Development of E-Readiness Assessment Framework
It should be noted that the process of constructing B2B e-commerce readiness index is complex and consists of several phases. In each phase, the researcher is left with methodological choices that might influence the organizational readiness ranking. As there is no agreement or a prior knowledge on the best or ideal method for developing composite indicator, several techniques for indicators selection, weighting and aggregation need to be considered. As mentioned earlier, AHP includes both the rating and comparison methods of two or more alternatives. AHP begins with defining a hierarchical structure of the problem. According to Cheng and Li (2001), in general AHP involves eight-steps method as shown below.
Step 1. Decision problem: weighting the barriers
this research, we would like to use AHP to determine the key factors of B2B e-commerce readiness, rank it and assign weight to each specific barrier. For this, AHP is used to evaluate internal and external B2B e-commerce barriers. The barriers are arranged in a proper hierarchy classification of different levels constituting goal, criteria and sub-criteria. The top level considers the decision objective of the situation. The intermediate levels of the hierarchy consist of decision criteria/sub-criteria.
Step 2. Setting up the decision hierarchy based on developed model
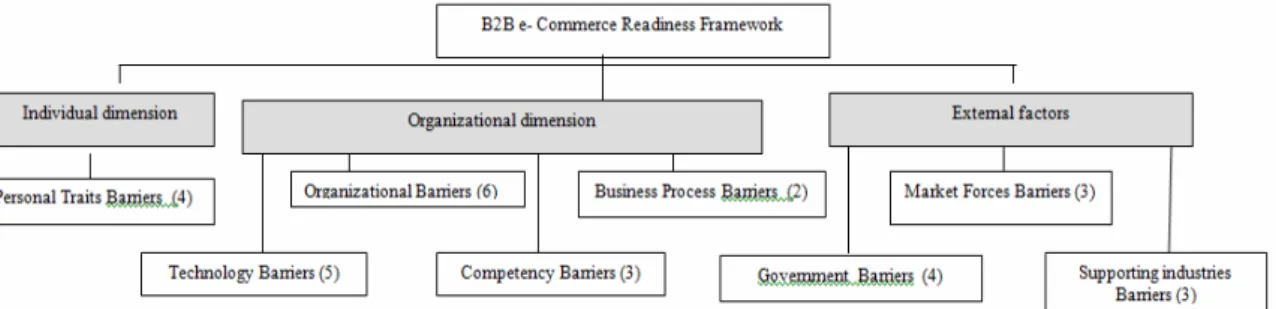
We map out the complexity of various barriers into different levels or components and synthesizing the relations of the components. In this research, the decomposition of the barriers refers to the aggregation of similar criteria into different groups, while the synthesis of relations is the integration of them in a systematic way. The model is represented by three dimensions of individual, organizational and environmental, and each of these dimension has its own barriers. The individual dimension is based on individual personal traits, while internal dimension constitute barriers from the aspects of competencies, technology and business process, whilst external dimension consists of several criteria of market forces, supporting industries and government aspects. Overall, the framework contains 30 issues of B2B e-commerce readiness. Figure 2 shows the top three levels consist of dimensions, aspects and issues of the framework. The numbers in bracket represent the total indicators identified under each classification.
Figure 1.The First Three Level Hierarchical B2B E-Commerce Readiness Assessment Model
According to Cheng et al 2001, the formation of the hierarchy is based upon two assumptions, without which a problem cannot be dealt with using AHP:
(1) It is expected that each element of a level in the hierarchy would be related to the elements at the adjacent levels. AHP recognizes the interaction between elements of two adjacent levels.
(2) There is no hypothesized relationship between the elements of different groups at the same level.
has not been determined. AHP method is used to calculate relative weights of these dimensions and criteria.
Step 4. Data collection from the selection panel
Data are obtained by direct questioning experts who are actively involved in the B2B e-commerce development project from agro- based industry. The selection of the experts are based on two criteria such as: (1) knowledgeable and experience in e- commerce related areas thus able to provide an overview and insight of B2B e-commerce from different perspectives (2) have experience and background in agro- based industries. Based on these criteria, we managed to get six experts from various agro based industry backgrounds. A questionnaire is designed to collect data that are useful to assign weights to the elements of B2B e-commerce readiness hierarchy. The weight of the indicators is determined using an Analytic Hierarchy Process (AHP) method by Saaty (1980) based upon experts’ judgment. This involves the employment of the pair-wise comparison matrix that will be described in the next step.
Step 5. Employing the pair-wise comparisons
The elements of each level of the decision hierarchy are rated using the pair-wise comparison. A pairwise comparison matrix is formed with regard to Saaty’s scale to show their relative importance to one another, which are from 1= equal importance to 9 absolute importance (Hatton, 2008; Davis 2005). After all elements have been compared with the priority scale pair by pair, a paired comparison or judgment matrix is formed.
Personal trait indicators under individual dimension (Table I) is used to illustrate the priority rating process. This matrix is composed of four rows and four columns (i.e. a 4 x 4 matrix). In this table, as the barriers A.1 and A.2 are expected to be equal in weight, a “1” is assigned to both positions. Then, as barrier A.4 dominates over barrier A.1, a whole number 5 is entered in row A.1 column A.4, and the reciprocal (i.e. 1/5) is entered in row A.4 column A..1. “1” is also assigned when the same element is compared in row and column. (A.1 – A.4 are the numbering represent personal trait barriers as shown in Table II).
Table 1
Pair Wise Comparison of Personal Traits (A) Aspects Level 3
(1)
A.1 (2)
A.2 (3)
A.3 (4)
A.4 (5)
Relative weight (6)
A.1 1 1 1 5 0.32 A.2 1 1 1 5 0.31 A.3 1 1 1 5 0.31
A.4 1/5 1/5 1/5 1 0.06
Step 6. Estimating relative weights of elements on each level in the hierarchy
After comparing data in couples, the weight of each element is computed through a number of numerical calculations. The “Eigenvalue” approach is used to estimate the relative weight of decision elements and aggregate the relative value of decision elements to come out with priority list of alternatives (Karaarslan and Gundogar, 2008; Begicevic et al 2006; Huang et al 2004). As shown in Table I, the relative weights of the elements are listed in column 6.
Step 7. Calculating the degree of consistency in order to validate the results
It is known that people are often inconsistent in answering questions, and thus one of the important tasks of AHP is to calculate the consistency level of the estimated vector. Consistency ratio (CR) is used to measure the consistency in the pair-wise comparison. Saaty (1994) has set the acceptable CR values for different matrices’ sizes; the CR value is:
1. (1) the CR value is 0.05 for a 3-by-3 matrix; 2. (2) 0.08 for a 4-by-4 matrix; and
3. (3) 0.1 for larger matrices.
If the consistency level falls into the acceptable range, the weight results are valid. Referring to Table I again, the CR value is 0.00, which is smaller than the acceptable value with a 4-by-4 matrix. If the CR is greater than the acceptable value, this empirically reveals excessive intransitivity of preferences. CR provides a very good estimation of the consistency of the respondents in answering the questions.
Table 2
Final Weights and CR Values for the Barriers
E-readiness indicators Final weight to each barrier
CR
value
A1. Indicators related to personal traits
1. Feeling of discomfort about B2B EC e-commerce due to unfamiliarity
with the technology 0.32
2. Lack of entrepreneurial mentality to respond to the fast pace of B2B
market change 0.31
3. ‘Wait- and- see’ attitude of top management on the success of B2B EC
other organizations 0.31
4. Unsafe feeling to give out financial information over the internet/
network 0.06
0.00
B. Barriers related to organizational features
5. Lack of vision, goal and plan on B2B online system application 0.21
6. Unfamiliarity with B2B e-commerce business model, processes,
solutions and benefits 0.21
7. Lack of resources allocation (budget, human resources etc) and its
investment justification. 0.21
8. Lack of recognition on the B2B e- commerce to improve and provide
value to business 0.21
9. The difficulty and complexities of B2B system policies and procedures 0.10
0.06
10. Organization wants to get fast return on their investment in technology 0.06
C. Barriers related to competencies
11. Lack of experience and technical knowledge on B2B online transaction 0.46 12. The available management and technical training on B2B system is not
suitable and difficult to understand 0.45
13. Unwillingness of organization to adopt changes due to B2B system
implementation 0.09
0.00
D. Barriers related to technology
14. Limited B2B e-commerce infrastructure (limited bandwidth, hardware
and software) 0.44
15. B2B e-commerce is perceived as relatively difficult or complex
technology 0.22
16. Inadequate and ineffective planning to handle online security and
technology failures 0.22
0.06
17. Integration or conversion of current technology to B2B technology is
difficult, ineffective and costly 0.06
18. Difficulty to choose suitable B2B e-commerce technology and standard 0.06
E. Barriers related to business process
19. Traditional character of industry, which values and recognize personal
Final weight to CR E-readiness indicators
each barrier value
20. Product complexity that required detail inspections and descriptions 0.39 F. Barriers related to market forces
21. Lack of B2B e-commerce knowledge, understanding, and critical mass
among trading partners 0.47
22. Lack of infrastructure, and guidelines for trading partners to implement
B2B e-commerce 0.47
23. Internal fear of opening corporate systems to trading partners 0.06
0.00
G. Barriers related to supporting industries
24. Lack of robust and stable internet/ network connection & services
25. Unreliable and ineffective application service providers to provide
affordable and quality services or products related to B2B e- commerce
0.72 0.22
26. The cost and complexity of moving enormous amounts of information
to and from the outsource site 0.06
0.07
H. Barriers related to government
27. Inadequate B2B e-commerce legal related to online communications,
transactions and agreements 0.61
28. Existing trade and access barriers to do B2B e-commerce across
national borders
29. Lack of industry standard procedures, policy and guidelines to
implement B2B e-commerce
30. Unstable economic and political climate in the country that hinders
B2B e- commerce grows
0.13
0.13
0.00
Step 8. Calculating the relative weights of those ratings with acceptable degree of consistency for the selection criteria
The relative weights of all selection criteria of this example were calculated, which were used to calculate the scores for B2B e- commerce readiness of the organization. (as shown in Table V). Adopted from the method used by Huang et al 2004, researcher use a 5 point likert scale of:
1. strongly not agree 2. not agree 3. neutral, 4. agree , and 5. strongly agree
The assessment is based on the barriers face by the organization which might hinder their readiness in implementing the B2B e- commerce application. Thus, the higher the score, the lower their readiness levels. The organization, assess their readiness for each criterion based on the above likert scale and calculated the final score for e-readiness measurement. The formula for calculating the final score for each organization is shown below:
Final score = (AHP score N) (X1) …… + (AHP score n)(X30)
take e- readiness assessment from personal traits aspect (A.1) until government aspect (H.30) of company A, based on the formula, the calculation score of readiness is below: E- readiness score = 0.32(3) + 0.31(3) + 0.31(3) + 0.0.06(3) + 0.21(3) …… + 0.13(2)
Table III demonstrates the rating results of B2B e- commerce readiness of the organization. As mentioned earlier, the higher the score, the lower the lower the organization readiness level. Thus, from the table, it shows that the organization E is the most ready as the organization has the lowest final score. This shows that organization E, faces the least barriers. The AHP method gives the e- readiness assessment a more objective approach to determine their readiness in B2B e- commerce implementation compared to non- weighted mean scores.
Table 3
The rating results for the organization’s B2B e- commerce readiness
Readiness indicators
& its AHP weight
Organization AOrganization B
Organization
C
Organization
D
Organization
E
1 0.32 3 4 3 5 3
2 0.31 3 3 2 5 3
3 0.31 3 2 3 3 3
A.
3 0.06 3 2 4 5 3
5 0.21 3 3 5 4 3
6 0.21 3 3 4 5 3
7 0.21 3 3 3 5 3
8 0.21 3 3 4 3 3
9 0.10 3 3 4 5 3
B.
10 0.06 3 3 4 3 3
11 0.46 3 3 4 3 3
12 0.45 4 3 4 5 4
C.
13 0.09 4 4 4 5 4
14 0.44 4 4 4 4 3
15 0.22 2 4 4 4 3
16 0.22 4 4 2 4 3
17 0.06 3 4 3 5 3
D.
18 0.06 3 4 3 5 2
19 0.61 2 3 4 4 2
E.
Readiness indicators
& its AHP weight
Organization AOrganization B
Organization
C
Organization Organization
D E
21 0.47 3 2 4 4 3
22 0.47 4 3 4 5 4
F.
23 0.06 3 3 4 5 3
24 0.72 3 4 4 5 4
25 0.22 3 4 4 3 4
G.
26 0.06 1 4 1 5 4
27 0.61 3 4 4 5 3
28 0.13 3 4 4 4 3
29 0.13 3 4 1 5 2
H.
30 0.13 2 4 4 5 2
TOTAL SCORE 24.98 26.18 29.62 34.01 24.69
Conclusion
References
Azimi, A., M.S, and Manesh, F.S, 2010, A new Model to Identify and Evaluate Critical Success Factors in the IT Projects: Case Study: Using RFID Technology in Iranian Fuel Distribution Systems, International Journal of Information Science and Management, Special Issue January/June 2010, pp. 99- 112.
Begicevic, N., Divjak, B., and Hunjak, T., 2007, Development of AHP model for decision making of e-learning implementation, Journal of Information Technology and
Organizational Sciences, Vol. 31, No. 1, pp. 13- 24.
Behavior and Human Performance, Vol. 21, pp. 316-345.
Bobko, P., Roth, P.L., and Buster, M.A., 2007, The usefulness of unit weights in creating composite score: a literature review, application to content validity and meta – analysis,
Organizational Research Methods, Vol. 10, No. 4, pp. 689- 709.
Cheng, E.W.L., and Li, H., 2001, Analytical Hierarchy Process an approach to determine measures for business performance, Measuring Business Excellence, Vol. 5, No. 3, pp. 30- 36.
Competencies Using Analytical Hierarchy process, Management Research News, Vol. 30, No. 8, pp. 530- 547.
Dorans, N., and Drasgrow, F., 1978, Alternative weighting schemes for linear prediction,
Organizational
Einhorn, H., and Hogarth, R., 1975, Unit weighting schemes for decision making,
Organizational Behavior and
Ekstrom, M. A., Bjornsson, H.C., and Nass, C. I, 2003, Accounting for rater credibility when evaluating AEC subcontractors, Construction Management and Economics, 1466-433X, Vol. 21, No. 2, pp. 197 – 208.
Ekstrom,M.A., and Bjornsson, H. C, 2007, A rating System for AEC e- bidding that Accounts for Rater Credibility.
Fathian, M., Akhavan, P., Hoorali, M., 2008, E-Readiness Assessment of Non-Profit ICT SMEs in a Developing Country: The Case of Iran, Technovation, In Press, Corrected Proof.
Fotouhiyehpour, P., 2008, Assessing the Readiness for Implementing e-CRM in B2B Markets using AHP Method, Master thesis, Lulea University of Technology.
Gorusch, R. L., 1983, Factor Analysis, Hillsdale, NJ: Lawrence Erlbaum Associates.
Guadagnoli, E., and Velicer, W. F., 1988, Relation of sample size to the stability of component patterns. Psychological Bulletin, Vol. 103, pp. 265-275.
Hafeez, K and Essmail E. A., 2007, Evaluating Organization Core Competences and Associated Personal
Thinking in Management.
Hanafizadeh, P., Moosakhani, M., and Bakhshi, J., 2009, Selecting the strategic best practices for business process design, Business Process Management Journal, Vol. 15, No. 4, pp 609- 627.
Hatcher, L., 1994, A Step-by-Step Approach to Using the SAS® System for Factor Analysis
and Structural Equation Modeling, Cary, N.C.: SAS Institute, Inc.
Hermans, E., Bossche, F. V. D., and Wets, G., 2009, Uncertainty assessment of the road Safety Index, Reliability Engineering and System Safety, Vol. 94, pp 1220 – 1228. Huang, J. H., Huang, W. W., Zhoa, C. J., and Huang, H., 2004, An E-Readiness
Assessment Framework and Two Fields Studies, Communications of the Associations
for Information Systems, Vol.14, pp. 364-386, 2004.
Human Performance, Vol. 13, pp 171-192.
indicators, Ecological Economics, Vol. 62 , pp. 291-297.
Karaarslan, N., and Gundogar, E., 2009, An application for modular capabilit- based ERP software selection using AHP method, International Journal of Advance
Manufacturing Technology, Vol. 42, No. 9- 10.
Kim, J., and Mueller, C.W., 1978, Introduction to factor analysis: What it is and how to do it . Newbury Park, CA: Sage Publications.
Lee, H., Kwalk, W. and Han, I. , 1995, Developing a business performance evaluation system: a hierarchical mode, The Engineering Economist, Vol. 40, No. 4, pp. 343-57. Osborne, J. W. And Anna B.C., 2004, Sample size and subject to item ratio in principal
components analysis. Practical Assessment, Research & Evaluation, Vol. 9, No. 11. Saaty, T., 1980, The Analytic Hierarchy Process, McGraw-Hill, New York, NY.
Saaty, T.L., and Vargas, L.G., 1991, Prediction, Projection and Forecasting, Boston: Kluwer Academic Publishers.
Stein, E. W., and Ahmad, N., 2009, Using the analytical hierarchy process (AHP) to construct a measure of the magnitude of consequences component of moral intensity,
Journal of Business Ethics, Springerlink January 7, 2009. Available: SpringerLink,
http://www.springerlink.com/content/67688150j2r3m103/. [Accessed August 25, 2009] Szczypinska and Piotrowski E.W., 2009, Inconsistency of the judgment matrix in the AHP method and the decision maker’s knowledge, Physica A:Statistical Mechanics and its Applications, Vol. 388, Issue 6, pp. 907- 915.
Tarantola, S., Nardo, M., Saisana, M., and Gatelli D., 2006, A new estimator for sensitivity analysis of model output: an application to the e- business readiness composite indicator, Reliability Engineering and System Safety, Vol. 91, pp. 1135- 1141.
Yang, J and Lee, H., 1997, An AHP decision model for facility location selection, Journal
of Facilities, Vol. 15, No. 9/10, pp. 241- 254.
Zhou, P, Ang, B.W., and Poh, K.L., 2007, A multiplicative optimization model for constructing composite indicators, Proceedings of the 2007 IEEE International
Conference on Industrial Engineering and Engineering Management (IEEM).
Zhou, P., Ang, B.W., and Poh, K.L., 2007(b), A mathematical programming approach to constructing composite
Zhou, P., Ang, B.W., and Poh, K.L., 2007(c), Composite indicators for measuring systems performance: an information theoretical aggregation approach, in Proceedings of Asia-