The Asian Journal of Technology Management Vol. 4 No. 1 (2011) 41-55
Technologic
lore: Does
Innovation Facilitate Growth of Firm Size?
Department of Management Studies, Indian Institute of Science, Bangalore
ABSTRACT
ntributed to their growth.
ey words: SMEs, technological innovations, sles growth, bangalore, india
*
al Innovation and Growth of SMEs In Banga
M H Bala Subrahmanya*
This paper probes the drivers, dimensions, achievements and outcomes of technological innovations carried out by SMEs in the auto-components, electronics and machine tool sectors of Bangalore in India. Thereafter, it probes the relationship between innovation and growth of SMEs by (i) estimating correlation between innovation sales and sales growth; (ii) calculating innovation sales for high, medium and low growth innovative SMEs and doing one way ANOVA, and (iii) ascertaining the influence of innovation sales, along with investment growth and employment growth on sales growth by means of multiple regression analysis. The paper brings out substantial evidence to argue that innovations of SMEs co
K
F
Small and Medium Enterprises (SMEs) have been considered one of the “driving forces” of modern economies due to their multi-faceted contributions in terms of technological innovations, employment generation, export promotion, etc. Of these, ability of SMEs to innovate assumes significance because innovation lends competitive edge to firms, industries and ultimately, economies. Therefore, technological innovation has the potential to spur growth of individual enterprises at the micro level and aggregate industries and economies at the macro level. Given the above, this paper attempts to understand issues such as what factors drive SMEs to innovate, what is the 0B1. Introduction
novation in South Asia and the highest ranked global hub in the entire Asia (UN
*
Correspondence author. Email: [email protected]
nature of SME innovations, what are the achievements of SME innovations and what are the outcomes of these achievements. Overall, this paper attempts to address the question – does SME innovation facilitate the growth of firm size? This question has been probed in the context of SMEs in auto components, electronics and machine tool sectors in the city of Bangalore, the only global hub of technological in
DP, 2001).
This paper structure contains five sections. Section 2 deals with review of literature leading to the identification of research gaps and formulation of a theoretical framework. Section 3 describes the objectives, scope, sampling and method of study adopted and section 4 presents
the characteristics of technological innovations of SMEs. The relationship between innovation and growth of SMEs is examined in section 5 and summary and conclusions are described in
2. Review of Literature and Theoretical Fram
ustries have the unrealized innovation potential (Chaminade and Van-Laur
very
com h is propelled by
num
rnal factors might vary from firm to firm or from industry to indu
ation performance in the bio-technology industry of South Korea (Kang and Lee,
factors of opportunities that SMEs can seize from its environment (Radas and Bozic, 2009).
section 6.
ework
Technological innovation is a key factor in a firm’s competitiveness. Technological innovation is unavoidable for firms which want to develop and maintain a competitive advantage and/or gain entry in to new markets (Becheikh, et.al. 2006). Among firms of different sizes, SMEs are generally more flexible, adapt themselves better, and are better placed to develop and implement new ideas. The flexibility of SMEs, their simple organizational structure, their low risk and receptivity are the essential features facilitating them to be innovative (The World Bank, 2010). Therefore, SMEs across ind
idsen, 2006).
There is substantial evidence to show that a number of SMEs in a wide variety of sectors do engage in technological innovations, and that these innovations are likely to be an important determinant of their success (Susman, et al, 2006). However the ability and innovative capacity of SMEs varies significantly depending on their sector, size, focus, resources and the business environment in which they operate (Burrone and Jaiya, 2005). Particularly innovation in the manufacturing sector is a
plex process whic
erous factors (Becheikh, et al, 2006). This leads us to the question – what drives manufacturing SMEs to carry out technological innovations? If a firm has to technologically innovate, it should have in-house technological competence in the form of technically qualified and motivated entrepreneur or manager with innovative ideas and technically skilled employees. Similarly, there must be market
demand for the innovated products in the form of explicit customer demand or implicit market opportunities. Of course, the relative importance of these internal as well as exte
stry or even from time to time.
Important internal factors that contribute to the development of innovative capabilities of SMEs are owner’s technical education and prior work experience, technical skills of the workforce, and investment in R&D and training (Romijn and Albaladejo, 2002). Ciemleja and Lace (2008) attributed the innovative activity of SMEs to the education level of managers. Technical education background and work experience of entrepreneurs in the same industry generate necessary technological capability and thereby facilitate the technological innovations of small firms (Bala Subrahmanya, 2007). Academic experience of the owner manager turned out to be an important determinant of SME innov
2008).
By and large, empirical studies underline the importance of both internal and external factors as the driving forces of innovation. These studies strongly indicate that neither internal competence of the firm alone nor customer requirements alone will drive a firm to undertake innovations. Innovation will emerge only when a technically competent firm is able to identify and respond to customer requirements by developing and/or improving products/processes.
new ways of delivering them to custo ers.
ival. However these studies are not conclusive.
consider both product and process innovations.
The above discussion leads to the next question – do SMEs necessarily engage themselves in product innovations or process innovations or both? In practice, SMEs might undertake: (i) only process innovations in the form of material substitution, change in technical process of manufacturing, etc. to achieve cost reduction or quality improvement or (ii) only product innovations in the form of changing product shapes/dimensions/sizes or introducing improved or new products, or (iii) both. Given their organizational simplicity, SMEs may implement process innovations faster and at lower switching costs than large firms. In addition, due to limited resources and small scale production, SMEs may find it easier to follow an innovation strategy aimed at obtaining incremental innovations such as process innovations. Indeed there is empirical evidence supporting the view that SMEs are process innovation oriented (Castillejo, 2004). Blumentritt (2004) found that US SMEs pursued process innovation more than developing new products and those SMEs spent more time in developing new ways of producing products or services and
m
On the other hand, some other studies which focused on new product development suggested that product innovation activities are the cornerstone of better performed firms, and those with aggressive growth ambitions (Mosey, et al, 2002; Mosey, 2005). Bala Subrahmanya (2001) in the context of North-East England found that SMEs are predominantly engaged in
product innovations. Mosey (2005) further suggested that manufacturing SMEs by repeatedly introducing innovative new products opens up new market niches, which is essential to their surv
Martinez-Ros (1999) found that product and process innovations are interdependent and closely linked. Barnett and Storey (2000) found that SMEs emphasized process innovations as much as product innovations. This was further supported by Georgellis, et al (2000) who showed that the degree of innovation in processes closely associated with degree of innovation in new products and services. Lumiste, et al (2004) found that Estonian SMEs were engaged in developing their products together with processes. However, Becheikh, et al (2006) based on review of literature covering empirical studies on innovation in the manufacturing sector, found that researchers have primarily focused on product innovations in SMEs, and therefore recommended that future research should
their innovations in Australia (CRA Inter
oes not lead to growth rather there is a need to develop methods to asse
and services. However they did not study whether the s
served that innovation is of crucial importance for a handful of ‘superstar’
fast-ion of innovative firms have penetrated the export market relative to non-inno
national, 2007).
If SMEs are able to reduce costs, improve quality, improve product shapes/dimensions, increase range of products and as a result increase the share of innovated products in their total sales, does that directly contribute to the growth of firm size in the form of growth of sales turnover, investment and employment? In other words, does innovation contribute to SME performance directly? Roper (1997) comparing the innovation strategies of German, UK and Irish SMEs, observed that there is a strong association between innovation and turnover growth. But Edwards, et al (2001) argued that growth is not necessarily dependent on those factors attributed to “innovative potential”. Of course, they further stated that this does not mean that innovation d
ss the relationship.
Bala Subrahmanya (2001) observed that SMEs of North East England pursued radical innovations as a strategy of firm growth though he did not explicitly probe the relationship between innovation and growth. Danneels and Kleinschmidt (2001) claimed that innovative products present great opportunities for SMEs in terms of growth and expansion into new areas though they did not study the relationship between innovation and growth. Lumiste, et al (2004) found that innovation helped Estonian SMEs to improve their performance in terms of market share and diversified range of goods
ize of those SMEs changed over time. Of the empirical studies, Engel, et al (2004) and Coad and Rao (2008) have explicitly focused on probing the relationship between innovation and growth in the context of SMEs of craft dominated industries in Germany and high-tech sectors in the US, respectively. The estimation results, based on probit model, emphasized a positive impact of innovation output on sales turnover change of SMEs (Engel,
et al, 2004). Innovative sales secure small firm market position and offer some opportunities for growth. Coad and Rao (2007) probed the relationship between innovation and sales growth for incumbent firms in high-tech sectors. A firm, on average, might experience only modest growth and may grow for a number of reasons that may or may not be related to innovativeness. But using a quantile regression approach, they ob
growth firms.
However, all of these studies are related to industrialized countries and therefore their relevance to an industrializing country like India might be questioned. Two empirical studies on Indian SMEs conducted in this decade have significant relevance here. The first one was confined to Karnataka state in India, which covered 648 micro enterprises on a sample basis and 1358 small scale enterprises on a Census basis across all industries in the manufacturing sector (Bala Subrahmanya, et al, 2001). The study found that 258 (about 40%) micro enterprises and 716 (about 53%) small scale enterprises had undertaken technological innovations primarily due to external factors such as competition, technological change and customer requirements and internal factor of self-motivation. They were involved in both product and process innovations though emphasis was relatively more on product innovations than on process innovations. The major achievements of their innovations comprised competitiveness enhancement in the form of improved quality, reduced rejection, improved product designs, increased output, etc. A higher proport
vative firms.
production and new ways of organizing administration. More than half of the increase in market share, competitiveness, profitability and reduction in costs due to innovation occurred due to three types of innovation – new products, new
tion and growth. It is towards filling up this research gap that we have unde
ul innovation to emerge a combination of both internal and external factors may be required.
that we have set the objectives of the study.
Figure 1. Innovation and Growth of SMEs
3. Objectives, Scope and Method of study processes and new services.
The above discussion brings out that no empirical study has explicitly probed the relationship between innovation and firm growth in the Indian context. Further, Indian studies done so far, have clubbed SMEs of different sectors together and thus lacked sector-specific focus. Moreover, these studies focused on a particular year for data collection and therefore, cross-sectional in nature. But the impact of innovation, as argued by Coad and Rao (2008), will not be instantaneous rather there would be considerable lags between innovation and its achievements and outcomes. Therefore, there is a need to focus on SMEs of specific sectors and over a period of time, to understand and analyze the nature and system of innovation in SMEs and probe the relationship, if any between innova
rtaken this study.
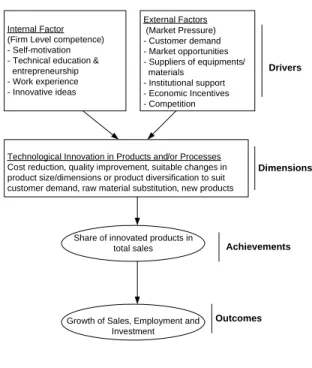
To put the research problem in the right perspective, we propose the following theoretical framework. There are four primary issues concerning innovation and growth of SMEs: (i) Driving forces, (ii) Dimensions, (iii) Achievements, and (iv) Outcomes (Figure 1). What factors drive SMEs to innovate? Are they internal factors or external factors or both? Internal factors could be self motivation, technical education background, work experience and innovative ideas of entrepreneurs. On the other hand, external factors such as customer requirements, information given by suppliers of equipments/materials, market opportunities, availability and accessibility of institutional support, economic incentives, competition, etc might also prompt some entrepreneurs to undertake innovation. However, for a successf
What kind of innovations do SMEs undertake? Are they exclusively product focused or process focused or do they necessarily have to undertake both together? Firms might focus on development of new products with either old or new technology, or on improvement of existing products by changing the shapes/designs or on quality improvement and cost reduction through substitution of raw materials, etc. What are the achievements of innovation by SMEs? If innovation is successful, whether new products or improved products emerged due to product or process innovations, the share of such innovated products is likely to increase in the total sales of the firm. If this happens, such firms would be able to achieve growth in their sales turnover, investment and employment resulting in the growth of firm size. It is with the above theoretical framework
Internal Factor (Firm Level competence) - Self-motivation - Technical education & entrepreneurship - W
External Factors
(Market Pressure) - Customer demand - Market opportunities - Suppliers of equipments/ materials
- Institutional support - Economic Incentives - Competition
ork experience - Innovative ideas
Technological Innovation in Products and/or Processes Cost reduction, quality improvement, suitable changes in pr uct size/dimensions or product diversification to suit cu demand, raw material substitution, new products
od stomer
Share of innovated products in total sales
Drivers
Dimensions
Achievements
Outcomes
Growth of Sales, Emplo ent and Investment
The study has the following objectives:
• To ascertain the innovation
and growth of sales turnover of SMEs
rises engaged in R&D and innovations.
and adequate to study the aforesaid objectives.
yielded a Cronbach’s α (alpha) of 0.653.
ation nal is, ANOVA and regression analysis.
cal Innovations of SMEs: a cteristics
characteristics of innovative SMEs
• To probe the relationship between innovation
These objectives are studied with respect to (i) auto components, (ii) electronics, and (iii) machine tool manufacturing SMEs in Bangalore Urban and Rural districts of Karnataka state in India. Karnataka was the pioneer in the field of industrialization and an industrially progressive state in the country. Bangalore, the capital city of Karnataka state, is one of the 46 ‘global hubs of technological innovation’ and the highest ranked global hub in Asia (UNDP, 2001). Among the districts of Karnataka, Bangalore Urban and Bangalore Rural districts had the highest proportions of Small Scale Industrial (SSI) enterp
Similarly, among the two-digit level industries (as per National Industrial Classification, 1987) machinery & equipments (35-36) and transport equipments & parts (37) industries had the highest proportions of SSI enterprises engaged in R&D and innovations (Bala Subrahmanya, et al, 2001). The former comprises electronics and machine tools industries and the latter includes auto component industry, among others. Bangalore region is industrially more developed with a relatively high concentration of engineering and electronics industries in the country today (Bala Subrahmanya, 2005). Therefore, we felt that the three identified sectors in Bangalore Urban and Rural districts would be appropriate
a
We developed a semi-structured questionnaire containing about 60 questions/items covering characteristics of SMEs, entrepreneurial background, driving forces, dimensions, objectives, sources, frequency, dimensions, achievements and outcomes of technological innovation,
recognitions won, proportion of innovated products in total sales and data on economic variables such as employment, investment, sales turnover, etc. The validity and reliability of the questionnaire was ensured based on the knowledge and experience of the authors, discussions held with industry experts and representatives of SME associations. Further, based on a pilot study covering about 10 enterprises each in the three sectors, we did an item analysis for the questions excluding those which are (i) opinions on policies, (ii) dichotomous questions, and (iii) descriptive questions, which
Ch
In the absence of an official database, we relied on the databases of SME associations like Karnataka Small Scale Industries Association, Bangalore and Peenya Industries Association, among others. Accordingly, with the validated questionnaire, we approached about 150 to 200 SMEs in each of the sectors and gathered primary data from 72 auto component SMEs, 67 electronic SMEs and 75 machine tool SMEs. Only those SMEs which have come up prior to 2001/02 were covered by the study. The quantitative data were gathered for a period of five years from 2001/02 to 2005/06. Data collection was done during January – December 2007. While the first objective was analyzed descriptively making use of frequency tables for innovative SMEs, the second objective was analyzed in terms of percentage growth of economic variables for both innovative and non-innovative SMEs. The third objective was analyzed for innovative SMEs using correl
ys
4. Technologi ra
as well as electronic SMEs and 70% of machine tool SMEs have come up in the 1980s and after whereas the rest had come up earlier. The entrepreneurs of about 50% of the SMEs in auto, about 43% in electronics and about 60% in machine tool sectors were in the age group of 30 to 40 years. Technical education background in the form of diploma or degree (BE/ME/Ph.D) is a significant feature of entrepreneurship of these SMEs: entrepreneurs of 70% of auto, 69% of electronics and 81% of machine tool SMEs were technically qualified. What is more significant is that it was to gain self-employment by implementing their innovative ideas and/or to exploit market opportunities that majority of these entrepreneurs have set up their firms. Their size characteristics revealed that size structure of the SMEs was more skewed towards micro and small enterprises than towards medium sized enterprises.
relative to electronics and machine tool sectors.
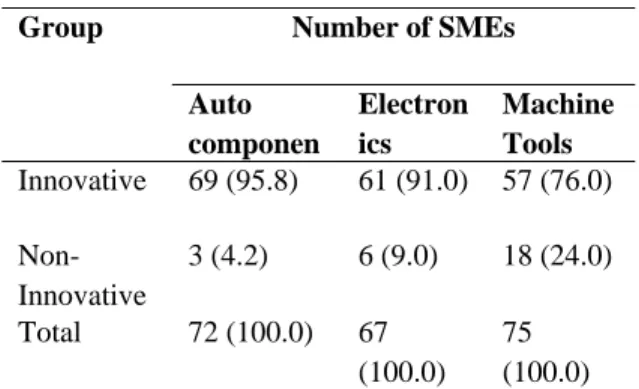
Table 1. Innovati s and Non Innovative SMEs
Group Number of SMEs
Give this, it would be appropriate to know how many of the SMEs in the three sectors are innovative and how many not. Majority SMEs are innovative in all the three sectors (Table 1). A greater proportion of SMEs in the auto sector is innovative
ve SME
Auto componen
Electron e
ics
Machin Tools
Innovative 69 (95.8) 61 (91.0) 57 (76.0)
Non-Innovative
3 (4.2) 6 (9.0) 18 (24.0) Total 72 (100.0)
0.0) 67
(100.0) (10 75 * Figures in brackets are percentages
the driving forces of their innovations (Table 2). Table 2. Drivers of Innovations
Innovation
Number of SMEs
SMEs are generally known for informal innovations. That is they carry out their innovations along with their day-to-day manufacturing operations within the same premises. The obvious reason is resource
constraint. The same holds good for the SMEs in Bangalore in all the three sectors. About 95% of the SMEs in auto and machine tool sectors and 77% of the SMEs in the electronics sector carry out innovations informally, without any exclusive innovation department. Given this, it is important to know the driving forces of innovation. A sizable majority of the SMEs identified both internal and external factors as
Drivers of
Auto components
tron
ools Elec
ics
Machin e T
Internal 6 10 2
factors
External 18 13 25
& al
45 38 30
Total 69 61 57
factors Internal Extern
However, a considerable number of SMEs in the machine tool sector has also identified external factors as the only driving force of their innovations. Those who have attributed their innovations exclusively to internal factors are not many. By and large, it is clear that both internal factors such as self-motivation, technical education background, work experience and innovative ideas of entrepreneurs on the one hand, and external factors such as customer requirements, information given by suppliers of equipments and materials, competition, etc. are responsible for majority SMEs to innovate. This implies that both firm level technological competence (technology push) and market demand (demand pull) are important if innovations have to emerge.
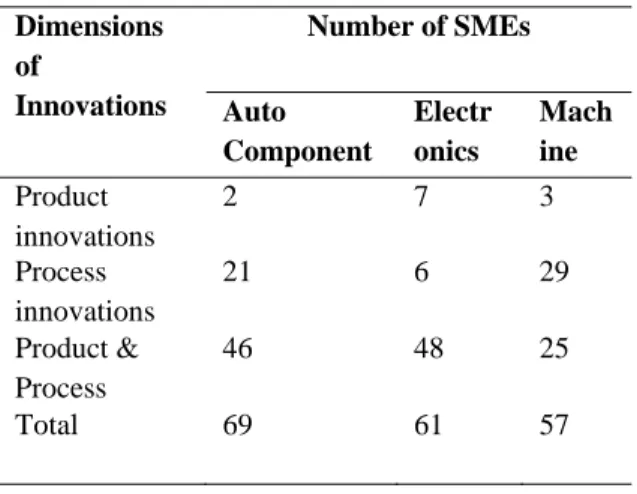
SMEs in auto and electronic sectors have undertaken both product and process focused innovations whereas majority machine tool SMEs have undertaken process based innovations (Table 3). Product focused innovations comprised introduction of new products and/or improvement of existing products through changing product designs and dimensions or quality improvement to suit customer requirements. Process based innovations involved introduction of new process technology for existing products, adoption of cost reduction techniques, etc.
Table 3. Dimensions of SME Innovations
ensions
Innovations
Number of SMEs Dim
of
Auto
Component ics
h Electr
on
Mac ine
Product innovations
2 7 3
Process innovations Product &
21 6 29
s
46 48 25
Total 69 61 57
Proces
What did SMEs achieve out of their innovations is an important issue. Only if they are able to convert their product and process innovations into sales, their innovations will be fruitful otherwise not. Irrespective of whether new or improved products emerged due to improved designs, quality improvement, cost reduction, material substitution, introduction of new or improved processes, innovative firms must be able to sell such innovated products in the market as part of their total sales. More successful innovative firms might realize a higher share of innovated products in total sales compared to less successful innovative firms. Table 4 presents the distribution of innovative SMEs in terms of varying ranges of innovative products in total sales. A higher percentage of innovative SMEs have succeeded in converting their innovations into sales in auto-component
sector relative to electronic and machine tool sectors. Among those SMEs which have succeeded in converting their innovations into sales, majority accounted for a share of innovated products in total sales in the range of
Table 4. Sh roducts in Total Sales (2005/06)
nge
shares
components
Electronics e
Tools
10% to 25% in all the three sectors. are of Innovated P
Ra of
Auto Machin
Nil 6 9 15
Up to 5% 15 17 12 >5% up
to 10%
14 8 9
>10% up to 25%
29 21 15
>25% up to 50%
5 6 6
T l No SMEs
69 61 57
ota of
from going for obtaining product and process patents.
Table 5. Recognition achieved due to Innovations Recognition Auto compone Electron ics Machi ne Produ ct Patent
National 0 2 3 Internatio
nal
0 0 0 Proces
s Patent
National 0 0 0 Internatio
nal
0 0 0 Citatio
ns
National 2 3 5 Internatio
nal
0 1 1 Award
s
National 16 6 28 Internatio
nal
0 0 1 Total Innovative
SMEs
69 61 57
Finally, it is interesting to find out the outcomes of innovation achievements of these SMEs. If innovative SMEs are able to convert their innovations into sales, they might be able to increase their sales turnover and increase capacity utilization or energy utilization or manpower utilization or improve inventory management or enter international market. The relative rankings of innovative SMEs are given in Table 6. It is clear that majority of the SMEs in all the three sectors have identified increase in sales turnover as the most significant outcome of their innovation achievements indicating that innovation has helped them to achieve growth in sales.
Table 6. Innovation Outcomes
Outcom es
Rank 1 Rank 2 Rank 3 Comp
osite Rank A * E * M * A * E * M * A * E * M * A * E * M * Sales turnover 3 3 3 4 3 1
7 6 3 6 5 3 1
. 4 1 . 4 1 . 2
Exports 1 5 2 6 6 4 1 2 2 2 . 0 1 . 8 2 . 0
P & M utilizatio n
1 1
4 9 1 3
1 2
9 2 3 1 0 1 7 2 . 3 2 . 2 2 . 2 Material utilizatio n
9 1 1 1 2 2 3 1 4 2 3 1 3 1 5 6 2 . 1 2 . 1 1 . 8 Energy utilizatio n
2 2 1 5 3 6 9 5 1 3 2 . 4 2 . 3 2 . 6 Manpow er utilizatio n
7 7 4 1 5 1 4 1 1 1 2 1 2 1 1 2 . 1 1 . 8 2 . 3 Inventor y manage ment
5 1 0 0 3 2 5 4 3 2
. 0 2 . 4 2 . 6
*A = Auto components, E = Electronics and M = Machine tools
composite ranks for each of the innovation outcomes for all the three sectors. The composite rank of each innovation outcome is calculated as follows: The number of SMEs of each rank is multiplied by that rank and the summation of the scores for the three ranks is divided by the summation of the number of SMEs for the three ranks. For example, under the auto component sector, 33 SMEs gave sales turnover rank 1, seven SMEs have rank 2 and six SMEs gave rank 3. Therefore, the summation of the scores for the three ranks = 33 X 1 + 7 X 2 + 6 X 3 = 65 and the summation of the number of SMEs for the three ranks = 33 + 7 + 6 = 46. Therefore, the composite rank of sales turnover for the auto component sector = 65/46 = 1.413. Similarly, composite ranks have been calculated for the remaining innovation outcomes. Even composite ranks clearly indicate that sales turnover increase is the most significant outcome of innovative SMEs in all the three sectors.
To sum up, it is the combination of internal and external factors which drive majority SMEs to undertake both product and process innovations. As a result, many of them have been successful in selling innovated products in varying proportions of their total sales. Though the recognitions won, particularly in terms of patents is not noteworthy, a considerable number of them have won national awards. More significantly, more than half of the innovative SMEs have achieved sales growth due to their innovations. In this context, a comparative growth analysis in terms of sales, investment and employment for innovative and non-innovative SMEs is appropriate.
5. Innovation and Growth of SMEs
The core objective of this paper is to ascertain the relationship between innovation and firm growth in the identified SME sectors. The central hypothesis underlying our analysis is that innovations are positively associated with firm performance in the form of growth of sales
turnover. If innovation helps a SME to improve sales performance, the following may hold good:
1.There is a positive relationship between percentage of innovated products in total sales and rate of growth of sales of innovated SMEs.
2.Higher growth SMEs will have higher shares of innovated products in total sales relative to medium growth SMEs, which in turn will have higher shares of innovated products in total sales compared to low growth SMEs.
3.Share of innovated products in total sales, along with rate of growth of capital as well as that of labour, has a significant influence on the rate of growth of sales turnover of innovative SMEs.
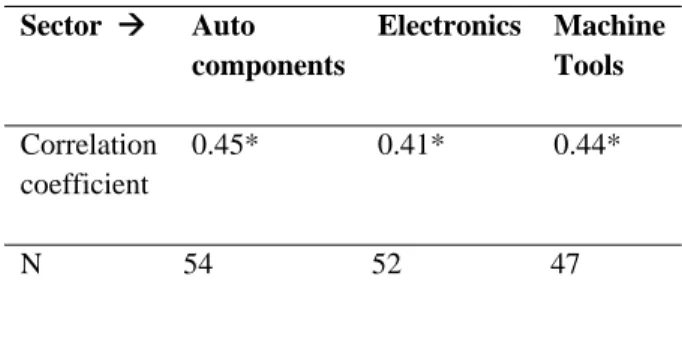
At the outset, we would like to explore whether there is any relationship between shares of innovated products in total sales innovation sales and sales growth of innovative SMEs. To ascertain the answer, we probed whether there is any statistically significant positive correlation between Compound Average Rate of Growth (CARG) of sales and percentage of innovated products in total sales. The results of the correlation analysis are presented in Table 7. The results indicate that there is indeed a statistically significant positive correlation (at 0.01 level) between sales growth and percentage of innovation sales in total sales.
Table 7. Correlation between Sales Growth and Innovation Sales
Sector Æ Auto components
Electronics Machine Tools
Correlation coefficient
0.45* 0.41* 0.44*
N 54 52 47
This being the case, higher growth SMEs should have higher shares of innovated products in total sales compared to lower growth SMEs. To know whether this holds good, we divided the innovative SMEs of each sector into three groups: (i) high growth SMEs, (ii) Medium growth SMEs, and (iii) Low growth SMEs. This is done by dividing the range of CAGR of sales of innovative SMEs by three and calculated the average share of innovated products in total sales for each group. The results clearly indicate that higher growth innovative SMEs, on average, have higher share of innovated products in total sales compared to medium growth innovative SMEs, which in turn, on average have higher share of innovated products in sales, compared to low growth innovative SMEs in all the three sectors (Table 8).
Table 8: Shares of Innovated Products in Total Sales
Gro up
Auto compon ents
Electron ics
Machine Tools
N o of S M Es
% of IPs * in Sal es
N o of S M Es
% of IPs * in Sal es
N o of S M Es
% of IPs* in Sales
High grow th
12 25. 00
10 20. 50
10 16.30
Gro up
Auto compon ents
Electron ics
Machine Tools
Medi um grow th
20 18. 15
18 14. 50
28 9.00
Low grow th
22 10. 32
24 9.2 1
9 4.89
*IPs = Innovated Products
To further ascertain the difference in the shares of innovated products in total sales between the three groups of SMEs in the three sectors, we did one-way Analysis of Variance (ANOVA) for the three sectors separately. The calculated F values of all the three sectors are statistically significant (Table 9). These results substantiate that the difference in the percentage shares of innovated products between high, medium and low growth innovative SMEs is statistically significant in all the three sectors. Given the relationship between share of innovated products in total sales and sales growth, we would like to know whether the former has any influence on enterprise growth. To ascertain the influence, we have carried out regression analysis with the following equation:
variables of labour and capital, we have not used any interaction term for the present analysis.
Table 9: ANOVA Results for Percentage share of Innovated Products in Sales
Auto components Sector
Sources of variatio n
Sum of squares
Degrees of freedo m
Mean squares
F ratio
Between groups
1212.48 2 606.240 7
3.57*
Within groups
8645 51 169.509 8 Total 9857.48
1
53
Electronics Sector
Sources of variatio n
Sum of squares
Degrees of freedo m
Mean squares
F ratio
Between groups
1023.35 2 511.674 8
5.93*
Within groups
4229.32 4
49 86.3127 3 Total 5252.67
3
51
Machine Tool Sector
Sources of variatio n
Sum of squares
Degrees of freedo m
Mean squares
F ratio
Between groups
490.151 2 245.075 5
2.35* * Within 4580.27 44 104.097
groups 5 1
Total 5070.42 6
46
* Significant at 0.05 level ** Significant at 0.10 level
The results of the regression analysis are given in Table 10. The regression model is statistically significant as indicated by the F value and the explanatory variables together (Adjusted R2) explain about 45% of the variation in the rate of growth of sales. We have ensured that all the assumptions of the multiple regression model held good. Both the sector dummies (Ds1 and Ds2) are not statistically significant. Even firm size dummy (Ds) is significant only at 0.20 level implying that initial firm size did not make much of a difference to the growth of sales in the three SME sectors.
Table 10: Influence of Innovation Sales on Enterprise Growth
Dependent variable: Sales Growth
Variables Coefficients
Kg 0.30 (4.39)*
Lg 0.49 (6.79)*
ISp 0.50 (4.02)*
DS 4.11 (1.30)**
Sector D1 -2.38 (-0.83) Sector D2 -3.16 (-1.11) Intercept 2.96 (1.22)
Adj R2 0.45
F 27.43* N 195
Figures in brackets are t values. F value is significant at 0.05 level
* Significant at 0.05 level **Significant at 0.20 level
6. Summary and Conclusions
This paper has ascertained the driving factors, dimensions, achievements and outcomes of technological innovations carried out by SMEs in the auto, electronics and machine tool sectors in Bangalore. Finally, it has explored and analyzed the relationship between innovation and growth with respect to innovative SMEs of the three sectors.
A substantial proportion of SMEs in all the three sectors are innovative, mostly informally. Most of the innovative SMEs attributed the origin of their innovations to a combination of
(i) firm level technological capability owing to internal factors such as self-motivation, technical qualification, knowledge, experience and innovative ideas of entrepreneurs, and (ii) market pressure due to external factors like customer requirements and demand, information provided by suppliers of equipments and materials, market opportunities and competition. Thus, both ‘technology push’ and ‘demand pull’ have contributed to the emergence of innovations.
The major objective of SME innovations was enhancement of competitiveness in the form of quality improvement, cost reduction, extension of product range and replacement of phased out products, apart from penetrating the international market. Accordingly, they have primarily focused on both product and process innovations in the auto and electronics sectors and process innovations in the machine tool sector. What is significant is that a substantial majority of the innovative SMEs could convert their innovative efforts into sales as they realized varying proportions of innovated products in their total sales. This has enabled majority of them to achieve sales growth more than anything else. However, hardly anybody could obtain international patents and the recognitions are largely confined to winning of awards from large enterprise customers and financial institutions.
industrializing economy like India. Secondly, it has analyzed the objective based on the much needed time series data covering a period of five consecutive years and not based on just cross section data pertaining to a single year. Therefore, it offers much empirical credence to argue that innovation does facilitate the growth of firm size.
Given these findings, the study has some important policy implications. Firstly, the study throws light on the need to promote innovations among SMEs through policy support. India has recently formulated a draft innovation policy to promote innovations in Indian economy in general and industry in particular. There is a greater need to implement the innovation policy with a focus on strengthening the internal technological capability of SMEs, as a means of promoting their innovative abilities and competitiveness. SME sector being the second largest in terms of employment generation and exports, enhancing their competitiveness would be beneficial not only to the sector but also to the entire economy. Secondly, encourage SMEs to cultivate “patenting culture” since majority of the innovators have hardly gone for obtaining patents. This could be largely a reflection on the low quality (incremental nature) of their innovations. In that case, policy support to enable SMEs to upgrade the quality of their innovations from mere incremental to radical, would go a long way in promoting the competitiveness of the sector as well as that of Indian economy.
References
Barnett, E and Storey, J. (2000). Managers’ accounts of innovation processes in Small and Medium-sized Enterprises. Journal of Small Business and Enterprise Development, Vol. 7 No.4, pp 315-324.
Bala Subrahmanya, M H. (2001). Technological Innovations in Small Firms in the North East of England: Dimensions and Implications. The
International Journal for Entrepreneurship and Innovation, London, Vol. 2 No.3, pp 141-152. Bala Subrahmanya, M H. (2005). Technological Innovations in Small Enterprises: A Comparative Perspective of Bangalore (India) and Northeast England (UK). Technovation, Vol. 25 No. 3, pp 269-280.
Bala Subrahmanya, M H. (2007). The Process of Technological Innovations in Small Enterprises: The Indian Way. International Journal of Technology Management, Special Issue on “The Process of Innovation: The Asian Way”, Vol. 39 Nos.3/4, pp 396-411.
Bala Subrahmanya, M H, M Mathirajan, P Balachandra and M N Srinivasan. (2001). R&D in Small Scale Industries in Karnataka, Research Project Report, Department of Science & Technology, New Delhi.
Becheikh, N, Landry, R, Amara, N. (2006). Lessons from Innovation Empirical Studies in the Manufacturing Sector: A Systematic Review of the Literature from 1993-2003. Technovation, Vol. 26 Issue 5/6, pp 644-664.
Blumentritt, T. (2004). Does Small and mature have to mean dull? Defying the ho-hum at SMEs. Journal of Small Business Strategy, Vol. 25 No.1, pp 27-33.
Burrone, E, Jaiya, G S. (2005). Intellectual Property (IP) Rights and Innovation in Small and Medium-Sized Enterprises, World Intellectual Property Organization, Geneva.
Castillejo, J A M, Barrachina, M E R, Llopis, A A and Llopis, J A S. (2004). On the Role of Process Innovations on SMEs Productivity, University of Valencia, Valencia, Spain.
Ciemleja, G and Lace, N (2008). The factors determining innovation-based attitude of Latvian SMEs towards sustainability, paper presented at 5th International Conference on Business and Management, 16-17 May, Vilnius, Lithuania.
Coad, A, and Rao, R. (2008). Innovation and Firm Growth in High-Tech Sectors: A Quantile Regression Approach. Research Policy, Vol. 37 No.4, pp 633-648.
CRA International (2007). SME Trends and Achievements, Kingston, Australia.
Danneels, E and Kleinschmidt, E J. (2001). Product innovativeness from the firm’s perspective: Its dimensions and their relation with project selection and performance. The Journal of Product Innovation Management, Vol. 18, pp 357-373.
Engel, D, Rothgang, M and Trettin, L. (2004). Innovation and their Impact on Growth of SME – Empirical Evidence from Craft Dominated Industries in Germany, Paper presented at the EARIE 2004 Conference in Germany.
Georgellis, Y, Joyce, P and Woods, A. (2000). Entrepreneurial action, innovation and business performance: The small independent business. Journal of Small Business and Enterprise Development, Vol. 7 No.1, pp 7-17.
Kang, K N and Lee, Y S. (2008). What affects the innovation performance of SMEs in the biotechnology industry? An empirical study on Korean biotech SMEs. Biotechnology Letters, Vol. 30, pp 1699-1704.
Lumiste, R, Lumiste, R and K Kilvits. (2004). Estonian Manufacturing SMEs Innovation Strategies and Development of Innovation Networks, 13th Nordic Conference on Small Business Research.
Martinez-Ros, E. (1999). Explaining the Decisions to Carry out Product and Process
Innovations: The Spanish Case. The Journal of High Technology Management Research, Vol. 10 No.2, pp 223-242.
Mosey, S (2005). Understanding new-to-market product development in SMEs. International Journal of Operations & Production Management, Vol 25 No.2, pp 114-130.
Mosey, S, Clare, J N and Woodcock, D J. (2002). Innovation decision making in British Manufacturing SMEs. Integrated Manufacturing Systems, Vol. 13 No.3, pp 176-183.
NKC (National Knowledge Commission). (2007). Innovation in India, Government of India, New Delhi.
Radas, S and Bozic, L (2009). The antecedents of SME innovativeness in an emerging transition economy. Technovation, Vol. 29, pp 438-450.
Romijn, H and Albaladego, M (2002). Determinants of innovation capability in small electronics and software firms in southeast England. Research Policy, Vol. 31, pp 1053-1067.
Roper, S. (1997). Product Innovation and Small Business Growth: A Comparison of the Strategies of German, UK and Irish Companies. Small Business Economics, Vol. 9, pp 523-537. The World Bank (2010): Innovation Policy: A Guide for Developing Countries, Washington, DC.