This titl&is no'n indexed in Scopus
---SCCPI.PLANNING MALAYSIA
Geospatial Analysis in Urban Planning Volume II (2013), Page I - 22
IMPACTS OF URBAN LAND USE ON CRIME PATTERNS THROUGH GIS APPLICATION
Abstract
Ahmad Nazri Muhamad Ludin1, Norsiah Abd. Aziz2, Nooraini Hj Yusoff & Wan Juliyana Wan Abd Razak4 1
•2·3&4Centrefor Innovative Planning and Development (CiPD) Faculty of Built Environment
UNlVERSITI TEKNOLOGI MALAYSIA
Land use planning plays a crucial role in creating a balance between the needs of society, physical development and the ecosystem. However, most often poor planning and displacement of land uses particularly in urban areas contribute to social ills such as drug abuse and criminal activities. This research explains the spatial relationship of drug abuse and other criminal activities on urban land use planning and their implications on the society at large. Spatial statistics was used to show patterns, trends and spatial relationships of crimes and land use planning. Data on crime incidents were obtained from the Royal Malaysia Police Department whilst cases of drug abuse were collected from the National Anti-Drug Agency (AADK). Analysis of the data together with digital land use maps produced by Arnpang Jaya Municipal Council, showed the distribution of crime incidents and drug abuse in the area. Findings of the study also indicated that, there was a strong relationship between petty crimes, drng abuse and land use patterns. These criminal activities tend to concentrate in residential and commercial areas of the study area.
Keywords: Drug abuse, land use planning, GIS/spatial statistics, criminal activities
1
Ahmad Nazri M11ha111ad Ludin, Norsiah Abd. Aziz. Nooraini Hj Yuso.ff & Wan Juliyana Wan Abd Razak Impacts of Urban Land Use 011 Crime Pa1tems through GIS Application
INTRODUCTION
Fear of crime and insecurity are realities of urban life. Criminal activities and drug abuse in particular, continue to raise concerns in most developing countries.
Between 1980 and 2004, the total crime index in Malaysia increase by 90% and most of which are related to prope1ties (Sidhu 2006). Malaysia is ranked 50 out of 60 countries in terms of total crime per capita with an average of 6.97 per I ,OOO people (Nations Master 20 I 0). Vasudevan (2004) ranked the top 6 issues
in Malaysia to be crime and public safety (46%), followed by social and moral problems (12%), economy (9%), domestic policies (7%), unemployment (4%) and education (4%).
Cities as socioeconomic hubs attract people of diverse interests and backgrounds including those susceptible to perpetrate criminal activities. Criminal activities are complex phenomena, and researchers agreed that there is a link between criminal activities with physical and social space. Opportunity
theory implies that crime density and population density are conceptually related,
in that the probabilities of predatory interactions between individuals and their property increase as a function of persons per unit area (Harries 2006). Crime
opportunity takes place when the offender finds a target in suitable situation without a capable guardian in the urban physical environment (Tabagin et al. 2008; Chainey and Ratcliffe 2005; Klinkenber 2008). Criminal pattern theory reveals that offenders tend to concentrate in areas familiar to them and through
their day-to-day activities watch for an easy target and an open space for a quick and easy escape route before committing a crime. Population density and total
area are expected to influence the influx of crime incidence in housing scheme. This fact is suppo1ted by Gymfi (2002) through a crime pattern study in Ghana where crime is highest in developed and densely populated regions. Hence, there is a relationship between crime, the offender and the environment.
Generally, it is a criminal activity to use, own, produce or distribute
drugs classified as having the potential to be abused. Drug abuse is closely related to crime due to its consumption without legal prescription. It affects individual behaviour and/or habit, and is potential for violence and petty crimes
such as snatch theft. Drug abuse and unemployment are among the driving
factors for the increase of snatch theft crime (Allen 2005). In fact, 50% of snatch
thefts that occurred in Kuala Lumpur in 2009 are believed to be committed by drug addicts (Utusan Online 2009).
Due to the increasing rate of crime each year, the Malaysian government
in January 2012 has introduced and launched Government Transformation
Programme (GTP). This programme is designed to provide all Malaysians the
PLANNING MALAYSIA Geospatial Analysis in Urban Planning
access to improved public services irrespective of race, religion and region. GTP
is created based on public concerns about some major issues that affected the
nation. The focus of attention under GTP is the implementation of the National Key Result Area or NKRA. NKRA involves 7 key areas and the performance of each area is evaluated through specific Key Performance Index (KPI). In order to measure and improve the efficiency and quality of government services, one of the NKRA initiatives is on reduction of crime.
Following the NKRA initiatives, the Federal Town and Country Planning Department introduced a Safe City Programme and embrace Crime Prevention
through Environmental Design (CPTED) concept with the objectives to reduce crime incidence and improve the quality of life (JPBD 2010). Under this programme, the safe city is defined as a city that is free of any threats physically,
socially and mentally, and is a protected environment. While, CPTED basically emphasises on the idea that proper design and effective use of the built environment can lead to a reduction of crime incidence (Schneider & Kitchen 2013).
Hence, this research attempts to evaluate the relationship and influence of
land use planning on the distribution patterns of drug abuse and criminal activities. Spatial statistics techniques are used to generate spatial analysis model and hotspot areas. Arnpang Jaya Municipal Council (AJMC) is selected as the
study area because it has one of the highest population densities in Selangor. This study focuses on theft and snatch theft with the assumption that these crimes are often drug related crimes.
THE RELATIONSHIP BETWEEN CRIMINAL ACTIVITIES, DRUG ABUSE AND LAND USE
Suryavanshi (2001) contends that there is a relationship between land use, urban form, routine activities and crime. Figure 1 shows the relationship between land use and opportunities for crime through two other important factors namely
Ahmad Nazri Muhamad Ludi11, Norsia/1 Abd. Azi:, Nooraini HJ Yuso.ff & Wan Juliyana Wan Abd Razak Impacts of Urban Land Use 011 Crime Pal/ems through GIS Application
Land Use
Land use types Zone patterns - Transportation
corridors
- Transit routes
Building design Design guidelines
Development regulations
l
Urban Form_
I
- Dynamic character
- Urban
Rural
Suburbanization
r:
t
I
_
Routine Activities
I - Types and location of
activities - Presence/absence
of guardians - Knowledge I
awareness of
offenders
Opportunities for Crime
Minimum risk Minimum effort Maximum reward
Specific crime in
speci fie places (situational)
Figure I: Theoretical Relationship between Land Use and Opportunities for Crime Source: Suryavanshi (2001)
Drug Abuse and Criminal Activities
Brochu ( 1995) and Fisher et al. ( l 999) observed that individuals whom have
developed an extreme dependency on drug tend to be involved in criminal activities such as prostitution, theft of property and fraud. Karofi (2005) argued that drug abuse and criminal behaviours are closely related to subculture, socio
-economic factors and rural-urban migration. He further explained that subculture
is a situation where an individual lives among drug addict friends that later ends up in drug trafficking and consumption. Thus, for a continuous supply of drugs, criminal acts are committed as an easy earning. In addition, socio-economic
factors such as poverty, broken homes, environment and urbanization, and rural
-urban migration also contribute to criminal acts. The pressure of life coupled
with the increasing standard of living in urban areas has resulted in these
individuals to choose the easy way out in fulfilling their needs regardless of the impact and consequences of their actions on the community.
Criminal Activities and Land Use
As land use change with new development and redevelopment, the structure of urban form will change as well (Brantinghams 1981; Felson 1987). Urban forms are dynamics; any change in land use may bring about other changes to nearby areas. For instance, the development of a new community facility may change the
routine activities of the community involved. According to Felson ( 1987) routine activities would create crime opportunities for the offender. Property crimes are higher at places where there are dispersed shopping and strip commercial developments. Commercial areas in cities have been found to be prone to
burglaries and thefts while residential areas are conducive to crimes such as
PLANNING MALAYSIA
Geo5patial Analysis in Urban Planning
sexual offence and murders. Studies have also indicated that child-sex offences and juvenile crimes are much higher near areas where high schools are located (Suryavanshi 2005).
GIS Application in Crime Pattern Analysis
Crime patterns can be analysed and explained using GIS because it offers a medium to analyse criminal activities data for a better understanding of the factors that influence crime offenders. It could also be used to generate a model that would predict potential crime spots. GIS could be applied for the analysis and the mapping of crime data for both academic research and practical law enforcement (Murray et. al. 2001). This is more so because it offers tools for the
modelling of statistical surfaces that facilitate approximate visualisations of point
densities (Harries 2006). The level of analysis achieved using GIS could determine even the density of crime within every spatial scale. Spatial statistics function can be utilized to help authorities such as the police department to map
crime scene. This would further assist the authority to understand crime behaviours and find the best action to prevent crime. The methodology employed could assist authorities to better understand the pattern of crime spatially and
predict potential crime. Thus, preventive measures can be taken through proper physical planning for new development areas while 'target hardening' measures can be taken for existing developed areas. GIS provide an alternative tool that can aid policy makers, decision makers and the security operatives in particular discharge their core responsibility of ensuring peace and security in the society. The integration of spatial statistics technique and GIS can assist local authorities and police departments to identify hotspots for crime incidence.
CASE STUDY: MAJLIS PERBANDARAN AMPANG JAYA
The study area, Majlis Perbandaran Ampang Jaya (MPAJ) or Ampang Jaya Municipal Council covers Mukim Ampang, Mukim Hulu Kelang and part of Mukim Setapak, and is approximately 14,350 hectares. The adjoining councils
include Dewan Bandaraya Kuala Lumpur, Majlis Perbandaran Selayang and
Majlis Perbandaran Kajang. The map showing MPAJ and its neighbouring
municipalities is shown in Figure 2. The population of MPAJ is estimated at 600,000 people in 2007 (Department of Statistics, Malaysia) or 12.7% of the total
Ahmad Nazri Muhamad Ludin, Norsiah Abd. Aziz, Nooraini HJ Yusojf & Wan Juliycma Wan Abd Razak Impacts of Urban Land Use on Crime Pat/ems through. GIS Application
IAWA$AN rcNJAotltAH MAJUS PEHANDAIAH U.lAYAHG
WllAYAH l'El.SEICtJTUAN
lUAlAIUMl'Ut OAEtAH HUl.U LANGAJ
Figure 2: Location of Arnpang Jaya Municipal Council
Source: Draft Local Plan of Ampang Jaya Municipal Council 2020
Table 1: Majlis Perbandaran Arnpang Jaya by Planning Blocks (BP)
Planning Blocks Area (Hectare)
BP I : PANDAN INDAH 2,056
BP 2: AMPANG 1,880
BP 3: TAMAN MELAWATI 1,823
BP 4: CONSERVATION AREA
(Hulu Gombak Reserve Forest) 8,591
Total 14,350
Source: Draft Local Plan Majlis Perbandaran A111pa11g .!aya 2020
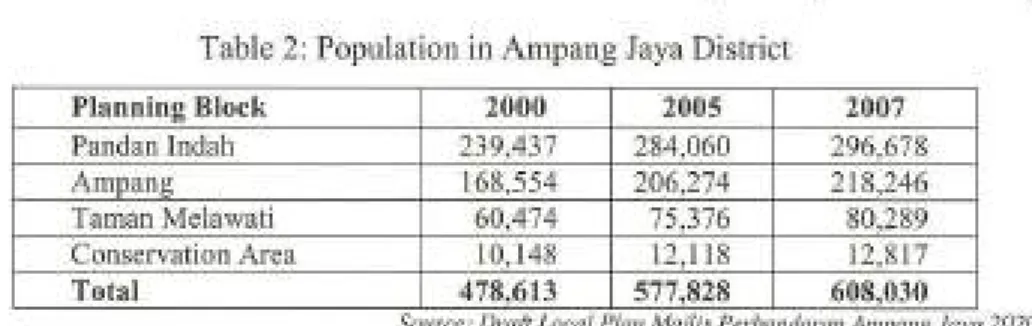
Ampang Jaya has a population of 608,030 people in 2007 (Dept of Statistic, Malaysia). The district registered a relative increase in population from 478,613 in 2000 to 577,828 people in 2005. Table 2 shows the population distribution by planning blocks for 2000, 2005 and 2007.
PLANNING MALA YSL4 Geosparial Analysis in Urban Planning
Table 2: Population in Ampang Jaya District
Planning Block 2000 2005 2007
Pandan lndah 239,437 284,060 296,678
Am pang 168,554 206,274 218,246
Taman Melawati 60,474 75,376 80,289
Conservation Area 10,148 12,118 12,817
Total 478,613 577,828 608,030
' '
Source: Draft Local Plan Ma1lts Perbandaran Ampang Jaya 2020
METHODOLOGY
Data Collection
Digital data on land use were obtained from MPAJ, while data on crimes were acquired from the Police District Headquarters of Ampang J aya. Data on drug abuse were obtained from National Anti-Drug Agency (AADK). A total of 2,062 cases of crime recorded in 2008 were plotted manually using ArcGIS 9 .2 as an individual point, geocoded by X and Y coordinates with the necessary attributes. Estimates on locations were made when the exact location of the crime were not recorded. Beyond these coordinates each point has additional attributes
illustrating time, date, day, type of crime, type of drugs, location, small planning block and housing scheme. Figure 3 shows the spatial distribution and the patterns of crime incidents in MP AJ. These are classified into four crime incidents namely, (i) theft, (ii) snatch theft, (iii) night time burglary, and (iv) day time burglary.
Ahmad Nazri Muha111ad Ludi11, Norsiah Abd. Aziz, Noorai11i HJ Yuso!f & Wan Juliya11a Wan Abd Razak Impacts of Urban Land Use 011 Crime Pallerns through GIS Applicmion
Injluencingfactors analysis
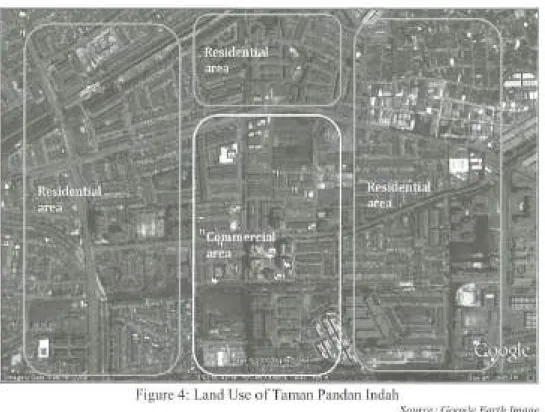
This analysis was executed based on the results from the hotspot analysis for theft, snatch theft and drug abuse. Figure 4 show the land use verification of
Taman Pandan Indah based on Google Earth image. Taman Pandan Indah
consists of 40% residential area and 60% commercial. The hotspot locations of
theft, snatch theft and drug abuse is overlaid with the Google Earth image to
facilitate the analysis of influencing factors to criminal incidents.
Figure 4: Land Use ofTarnan Pandan lndah
Source: Google Earrh Image
Movement Pattern Analysis
The movement analysis is conducted using Mean Centre and Standard
Deviational Ellipse (SOE) technique. The mean centre is the point whose coordinates are the mean x-coordinate and mean y-coordinate for all the features in the study area. The SOE technique is a measurement of the difference between
the average distance and the distance from a given feature to the mean centre.
Based on reported offences, SOE would identify the direction criminal offenders select their target area. The measurement can be obtained using equation ( 4):
Li
cxi-x)
2 +Li cxi-x)2SD =
n n
PLANNING MALAYSIA Geospatial Analysis in Urban Planning
Eq. (4)
The SDE is employed to indicate the geographic centre, distribution, orientation and directionality that exist for each crime, especially in understanding how the crime trans-change overtime in day and time categories. Standard deviation ellipse is a logical extension of the standard distance circle (Furley 1927) which can capture the directional bias in a point distribution (Wong & Lee 2005). In movement pattern analysis, both theft and snatch theft are analysed by day and time categories. Day category is divided into two subcategories which are weekdays and weekends, whilst time categories are divided into five subcategories in 24-hour time format as shown in Table 3.
T bi 3 a e T" 1me F rame S u categones b
ID Time Frame
I 0000-0359
2 0400-0859
3 0900-1659
4 1700-1959
5 2000-2359
FINDINGS
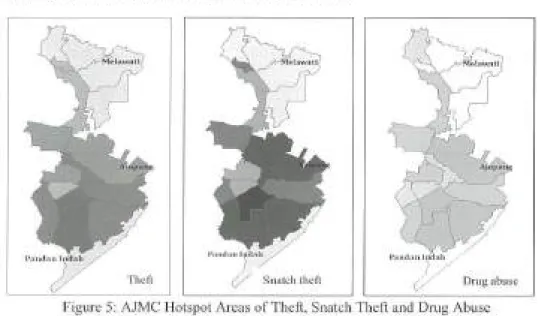
Most of the hotspot areas for theft, snatch theft and drug abuse were detected in the southern region of MP AJ especially in Pandan Indah, whilst, the cold spot areas are distributed in the north of study area as shown in Figure 5. A further
Ahmad Nazri Muhamad Ludin, Norsiah Abd. Aziz, Nooraini 1-1) Yusoff & Wan Juliyana Wan Abd Razak lmpacrs of Urban Land Use on Crime Pa/ferns rhrough G/S Application
Drug abuse
Figure 5: AJMC Hotspot Areas of Theft, Snatch Theft and Drug Abuse
Snatch theft
Drug
abuse
Figure 6: Hotspot Location based on overall reported Theft and Snatch Theft in MPAJ
PLANNING MALAYSIA
Geosparial Analysis in Urban Planning
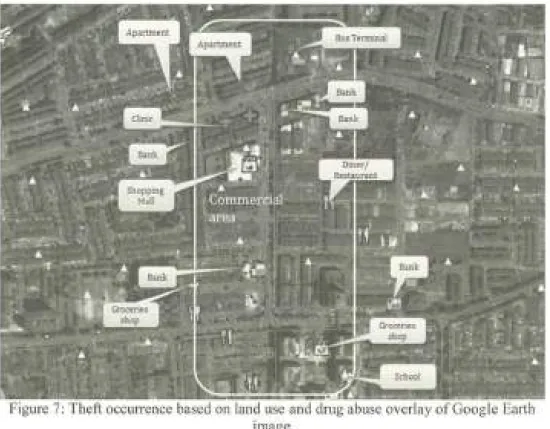
Based on the results of the hotspot analysis for theft, snatch theft and
drug abuse, the influencing factor analysis was conducted on Google Earth image
of Taman Pandan Indah. Taman Pandan Indah was selected due to the high number of reported cases recorded for the entire MPAJ. In Figure 7 and 8, the hotspot location of crimes are indicated as cross marks and drug abuse
distributions are indicated as small circle dots. The hotspot area is in the
commercial centre comprising of banks, clinics, restaurants, and a shopping mall.
A feature with a high value may denote some form on concentration in crime
incidence, but may not be a statistically significant hotspot.
. . . iiiiiiiiiiiiiiiiiiiiiiiiiiiiiiiiiiiiiiiiiiiiiiiii·
Ahmad Na:ri Muhamad Ludin, Norsiah Abd. Aziz. Nooraini HJ Yusofl & Wan Juliyana Wan Abd Ra:ak lmpacls of Urban Land Use on Crime Pa11ems 1/iraugh GIS Applicalion
Figure 8: Snatch Thell Occurrence based on Land Use and Drug Abuse factor overlay of
Google Earth 1 magc
Based on the influencing factor analysis, planning of the land use is a
major contributing factor other than the likely availability of a victim. The findings of the study indicate that, drug abuse and criminal patterns are related to
land use. The movement pattern analysis indicate that crime patterns in MPAJ tend to concentrate more in Pandan lndah and Ampang planning block.
As shown in Figure 9(a) and (b), the current tendency for all crimes are in the southern region of the ellipse. Similarly, the pattern of drug abuse
distribution was found to be near theft and snatch-theft locations. This supports the contention that, there is a relationship between drug abuse, crime and land use. Main roads, pedestrian bridges, commercial facilities such as banks,
shopping complexes, bus stands and restaurants appear to be the preferred locations for criminals to find their victims. The direction and concentration of crime as indicated by the SDE for both crimes seem to disclose that busy traffic
and large crowds which present a high possibility of likely victims in open and strategic areas are relative opportunity elements for crime incidents.
Both theft and snatch theft are more frequent on weekdays compared to
weekends, where 563 theft and 322 snatch theft cases arc reported during 2008.
PLANNING MALAYSIA
Geospatial Analysis in Urban Planning
Figure 9(A): The Direction of Ellipses of Theft and Snatch Theft based on Day category
Theft·tme CJ•
CJz CJ3 CJ•
5
Ahmad Na:ri M11/w111ad Ludin, Norsiah Abd. A:i:. Nooraini Hj Yusoff & Wan J11/iya11a \Van Abd Ra:ak
lmpacrs of Urban Land Use on Crime Pal/em.» rlirougli GIS Applicarion
The mean centre technique clearly defined the movement pattern of theft
and snatch theft by time. As the daily activities of likely victims change the
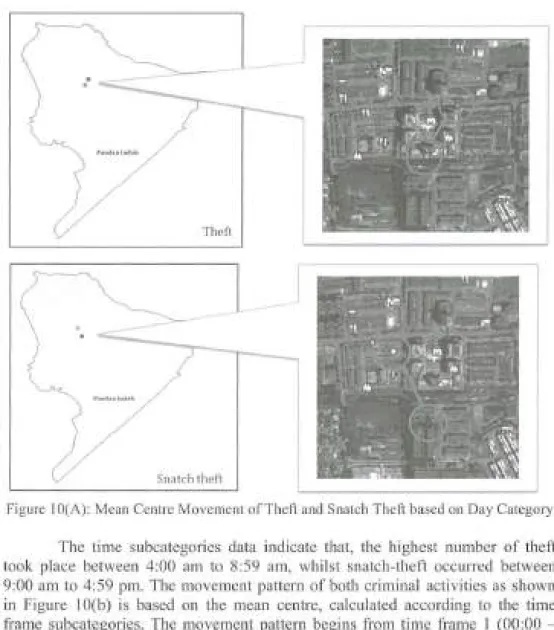
hotspots from crime incidence also changes. Figure I O(a) shows the movement
pattern of both theft and snatch-theft during weekdays and weekends .
• •
0
.
Theft
Snatch theft
I
l
Figure IO(A): Mean Centre Movement of Theft and Snatch Thell based on Day Category
The time subcategories data indicate that, the highest number of theft took place between 4:00 am to 8:59 am, whilst snatch-theft occurred between
9:00 am to 4:59 pm. The movement pattern or both criminal activities as shown in Figure IO(b) is based on the mean centre, calculated according to the time
frame subcategories. The movement pattern begins from time frame I (00:00
-03:59) to time frame 5 (20:00-23:59) as shown in Table 3.
'Is>. •
-•o
..
.
Snatch Theft
-PLANNING MALAYSIA Geospatial Analysis in Urban Planning
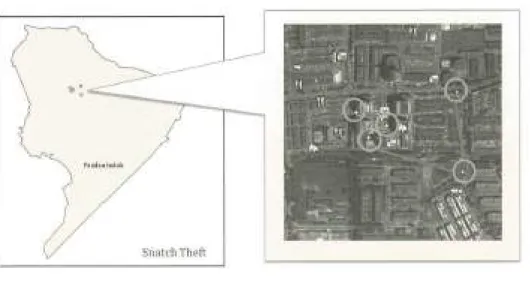
Figure 10 (B): Mean centre movement of theft and snatch theft based on time frame subcategories
The movement patterns in Figure 1 O(b) indicate that the occurrence of both criminal acts originates at residential area close to target spot (restaurant or bank) and as the night progresses to daylight (04:00-08:59), the offenders target the residential area. The offenders then shift their target area to a bigger area of
likely victim located mostly in commercial centre and its surrounding during
daylight (09:00-16:59). As the night progresses (20:00-23:59), the criminal acts
are centred in the commercial areas. From the analysis, it is concluded that the
Ahmad Nazri Muhamad Ludi11, Norsiah Abd. Azi:, Noorai11i HJ YusojJ & Wan Juliyana Wa11 Abd Razak
Impacts of Urban Land Use on Crime Patterns through GIS Applicatio11
CONCLUSIONS
This study shows that there is a measurable link between criminal activities and physical or social space. It supports the opportunity theory which implies that crime density and population density are conceptually related. The mean centre of each crime distribution for MPAJ also identifies with this suggestion. The mean centre of crime is located in Taman Pandan Indah, an urban area with a dense population. The analyses were carried out for each crime based on categories and subcategories. Each category is further split into groups that are weighted. Each day category is weighted according to week-day and weekend subcategories, and the time category is weighted into five subcategories or time frame.
The crime distribution in MPAJ displayed a highly clustered pattern for every crime type. Clustered means crime rates are concentrated in a certain area. The spatial result showed that crime patterns in the study area are clustered with
high value and the land use has a correlation with crime activities. Results from the analysis according to time frame also resulted in significant change of crime pattern. These findings revealed the spatial correlation between types and patterns of criminal activities and land use namely commercial (banks and shopping malls) and residential areas. The opportune spots for criminals are at roads with heavy traffic, pedestrian bridges and bus stops. The temporal GIS dimension of the study has provided a clearer understanding on the pattern of crimes and drug abusers in relation to land use planning.
The integration of spatial statistics and GIS can assist local authorities and police depattments in particular, to identify hotspots for crime incidence.
Implementation of the safe city initiative by the Government and CPTED in
residential layout design is potentially a more effective way to combat urban crime and insecurity of the Malaysian urban society.
REFERENCES
PLANNING MALAYSIA Geospatial Analysis in Urban Planning
Allen C.B. (2005). The Links between Heroin, Crack Cocaine and Crime: Where Does Street Crime Fit in? British Journal of Criminology, Vol. 45 (3), 355-372.
Amler, B., Betke, D., Eger, H., Ehrich, Chr., Hoesle, U., Kohler, A., Kusel, C., Lossau, A. V., Lutz, W., Millier, U., Schwedersky, T., Seidemann, S., Siebert, M., Trux, A., Zimmermann, W. (1999). Land Use Planning: Methods, Strategies and Tools. Universum Verlagsanstalt, Eschborn,
Germany.
Atlas, R.I. (2008). 2lsi Century Security and CPTED: Designing for Critical
Infrastructure Protection and Crime Prevention. Taylor & Francis Group, LLC, Boca Raton, FL.
Brantingham, P. J. and Brantingham, P. L. (1981). Environmental Criminology. Beverly Hills, CA: Sage Publications.
Brantingham, P. J. and Brantingham, P. L. (1984). Patterns in crime. New York City, NY: Macmillan Publishing Company.
Brochu, S., (1995). Drogue et Criminalite. Une Relation Complexe. Collection
Perspectives Criminologiques, Presses de l'Universite de Montreal. Chainey, S. and Ratcliffe, J., (2005). GIS and Crime Mapping. West Sussex,
England: John Wiley and Sons, Ltd.
Clarke R.V. (1992). Situational Crime Prevention: Successful Case Studies. New York, NY: Harrow and Heston Pub I ishers.
Clinard, M.B. and Meier, R. F. (1995). Sociology of Deviant Behaviour. 9 Edition. New York: Harcourt Brace College Publishers.
City of Orlando. (2008). Crime Prevention through Environmental Design: Your
Guide to Creating a Safe Environment. City of Orlando, Orlando,
Florida.
Cohen, L. E. & Felson, M. (1979). Social Change and Crime Rate Trends: A
Routine Activity Approach. American Sociological Review, 44, 588 -608.
Cornish D.B. & Clarke, R.V. (1986). The Reasoning Criminal: The Rational
Choice Perspectives on Offending. New York, NY: Springer Verlag.
Everitt, B. (1974). Cluster Analysis. London: Heinemann Education Books. ESRI, (2007). GIS Technology and Application for the Fire Service. ESRI White
Paper. March 2006. [Accessed 18 July 2011].
Felson, M. (1987). Routine Activities and Crime Prevention in the Developing Metropolis. Criminology, 25 (4), 911 - 931.
Fisher, B., (1999). Illicit Opiates in Toronto: A Profile of Current Users.
Ahmad Nazri Muha111ad L11din, Norsiah Abd. Aziz, Nooraini HJ Yusuf! & Wan Juliyana Wan Abd Razak Impacts of Urban Land Use on Crime Pal/ems through C/S Applicatio11
Freelan, S., (2003). Developing a Quasi-Temporal GIS for Archival Map Data. http://proceedings.esri.com/library/userconf/proc03/p0987.pdf. [Accessed 19 July 2011].
Furley, P. (1927). A Note on Lefever's : Standard Deviational Ellips. American Journal of Sociology 23, 94-98.
Getis, Arthur, and Ord, J. (1992). The Analysis of Spatial Association by Use of
Distance Statistics. Geographical Analysis 24, 189-206.
Grubesic, T. H. and Murray, A. T. (2000). Detecting Hotspots using Cluster
Analysis and GIS. Research Paper for the Center for Urban and Regional
Analysis and Department of Geography, Ohio State University,
Columbus, Ohio.
GTP, (2011). Program Transformasi Kerajaan. Laporan Tahunan 2010. Unit
Pengurusan Prestasi dan Pelaksanaan (PEMANDU), Jabatan Perdana
Menteri.
Gymfi, J. A. (2002). An Analysis of the Broad Crime Trends and Patterns in Ghana. Journal of Criminal Justice 30, 229-243.
Harrsies, K. (2006). Extreme Spatial Variations in Crime Density in Baltimore
County, MD. Ceo.forum 37, 404-416.
Jeffery, C. R. ( 1971 ). Crime Prevention through Environmental Design. Beverly Hills, CA: Sage Publishing Company.
JPBD Johor, (2010). Program Bandar Selamat.
http://www.jpbdjohor.gov.my/v2/index main.php?pm=perkhidmatan&p
=bandarselamat. [Accessed 20 July 2011]
J PBD NS, 20 I 0. Pelaksanaan Program Bandar Se/amat Di Negeri Sembilan.
Buletin Rancang. Buletin Jawatankuasa Perancang Negeri, Negeri
Sembilan Darul Khusus. Bil. l/2010, 10-13.
Karofi, U. A., (2005). Drug Abuse and Criminal Behaviour in Penang, Malaysia: A Multivariate Analysis. Bangladesh e-Journal of Sociology. 2, 1-26.
Klinkenberg, B., (2008). GJS and
Crime.http://www.geog.ubc.ca/courses/geob479/notes/crime/Crime_intro .pdf. [Accessed on August 4, 20 I OJ.
Lawrence, S., Gartin, P., and Buerger, M. ( 1989). Hotspots of Predatory Crime: Routine Activities and the Criminology of Place. Criminology, 27. 27-55.
Murray, A. M. (200 I). Exploratory Spatial Data Analysis Techniques for Examining Urban Crime Implications for Evaluating Treatment. British Journal of Criminology 41(2), 309-329.
Nation Master, (2010). Crime Statistics: Total crimes (per capita) (most recent)
by country. http://www.nationmaster.com/graph/cri_ tot_ cri_percap
-cri me-total-crimes-per-capita. [Accessed February 1, 2010].
PLANNING MALAYSIA
Geospa1ial Analysis in Urban Planning
Navaratnam, V. (1990). Drug Use among Malaysian Youth: Selangor: Jawatankuasa Anti Dadah Negari Selangor, Revised by the National
Drug Research Centre of Drug Research, University Science Malaysia.
NCPC, (2003). Crime Prevention through Environmental Design Guidebook. National Crime Prevention Council, Singapore.
NKRA, 2011. Q & A Enam Bidang Keberhasilan Utama Negara (NKRA). http://p1m.penerangan.g0v.my/index.php?option=com_content&view=art icle&id=4808:pointers-6-bidang-keberhasilan-utama-negara
-nkra&catid= I 6:isu-nasional [Accessed 14 January 2011].
Ord, J., and Getis, A. (1995). Local Spatial Autocorrelation Statistics:
Distributional Issues and an Application. Geographical Analysis, 27,
286-306.
Rogerson, P., Batta, R., and Rump, C. (2003). Detection and Prediction of Geographical Changes in Crime Rates, Executive Summary. U.S Department of Justice.
Roncek, D., and Maier, P. (1991). Bars, Blocks, and Crime Revisited: Linking the Theory of Routine Activities to the Empirical of Hotspots. Criminology 29, 725-753.
SCRIBD, (2011 ). Definisi Oadah. http://www.scribd.com/doc/67814 l 2/ definisi -dadah. [Accessed 20 December 2010].
Schneider, R.H. & Kitchen, T. (2013). Putting Crime Prevention through
Environmental Design into Practice via Planning Systems: A Comparison
of Experience in the US and UK, Built Environment, Vol. 39(1), 9-30
Sidhu, A. S. (2006). Crime Level and Trends in the Next Decade. Journal of the Kuala Lumpur Royal Malaysia Police College, No. 5, 1-13.
Sherman, L. W. (1995). Hotspots of Crime and Criminal careers of Places In:
Eck, J.E., Weisburd, D. (Eds.), Crime and Place, The Police Executive Research Forum, Monsey. Washington, DC, New York: Criminal Justice Press.
Suryavanshi, V. M. (2001). Land Use and Oppo1tunities for Crime: Using GIS as
an Analysis Tool. Master Thesis of Urban and Regional Planning,
Virginia Polytechnic Institute and State University (Virginia Tech),
Blacksburg, VA.
Tabagin, D., Flores, J. C., and Emperador, N. F., (2008). Investigating Crime
Hotspot Places and their Implication to Urban Environmental Design: A
geographic Visualization and Data Mining Approach. World Academy of Sciences, Engineering and Technology, 48, 16-24.
Utusan Online, (2009). 50 peratus kes ragut dilakukan penagih dadah. 17 April 2009.
http://www.utusan.com.my/utusan/info.asp?y=2009&dt=0418&pub=Utu
san_Malaysia&sec=Jenayah&pg=je_05.htm. [Accessed 28 July 2011].
Ah111ad Na<.ri M11/w111ad Ludi11. Norsiah Abd. A:i:. Noorai11i HJ Yusoff & Ww1 J11liya11a Wan Abd Rawk Impacts of Urban Land Use 011 Crime Patterns through GIS Application
The Star, (2008). Snatch-thieves slash Sa111arita11. 26 November 2008. http://scottthong. wordpress.corn/tag/johor-snatch-theft/. [Accessed 28
July 2011].
The Star, (2009). Daughter of Snatch-theft Victim Vows to Seek Revenge. 29 May
2009.
http://thestar.com. my/news/story .asp ?sec=nati on&fi 1e=/20091512 9/nation/ 4005019. [Accessed 28 July 2011].
The Star, (2009). Snatch Theft Victim Badly Injured. 28 November 2009. http://thestar.com.my/news/story.asp?file=/2009/ I I /28/nation/5201609& sec=nation. [Accessed 28 July 20 I I].
The Star, (20 I 0). Tutor Cheats Death in Snatch Theft Incidents. 8 October 20 l 0. http://thestar.com. my/news/story.asp?sec=nation&file=/20101I0/8/nation/
7186936 [Accessed 28 July 2011].
Vasudevan, Y. (2008). Rising Crime Index Has Abdullah Worried. News Straits
Times.
Wong, D. W., & Lee, J. (2005). Statistical Analysis of Geographic Information
With ArcView GIS and ArcGIS. Hoboken, New Jersey: John Wiley and Sons, Inc.
Zin, M.M (2009). Perangi Dadah Bagi Mengatasi Jenayah.
http://www. i ki 111.gov. my/v5/i ndex. php/i magesweb/iki m/fi le/ft le/index.ph p?lg= I &opt=com _ article&grp=2&sec=&key=2031 &cmd=resetall. [Accessed 20 July 20 I I].