Abstract
Different sets of experiments were designed and conducted in a pilot plant to determine the effect of different oper -ating conditions on the process efficiency and deactivation of the catalyst in the naphtha catalytic reforming process. Based on the experimental results, a kinetic model was developed and adapted for the purposes of prediction. The developed model represents the impacts of all input variables – including operating conditions, physical properties of feedstock, and chloride injection – on research octane number (RON), the yields of reformate l, and outlet reactor temperatures. Finally, by applying the model and an optimization algorithm, a pseudo-dynamic optimization of the process was carried out to minimize energy usage and improve the process efficiency by determining an optimum op -erating plan that also maximizes the yields of the average octane number and the liquid product. Also, by minimizing the increasing rate of weight average bed temperature of the reactors, the average energy consumption throughout a definite period was minimized. Finally, it is also estimated that by applying this method, the average conversion and average RON could be improved by 6% and 2.5 units respectively.
Key words:Gasoline Production Process, Deactivation of the Catalyst, Chloride Injection, Kinetic Model, Pseu -do-Dynamic Optimization.
Development of A Procedure to Improve The Efficiency and Yields of The
Gas-oline Production Process Through Pseudo-Dynamic Kinetic Modeling and
Op-timization
Sorood Zahedi Abghari*
Division of Refinery Process Technology Development, Research Institute of Petroleum Industry (RIPI), Tehran, Iran
*Corresponding author:Sorood Zahedi Abghari, Division of Refinery Process Technology Development, Research Institute of Petroleum Industry (RIPI), Tehran, Iran
E-mail addresses: [email protected]
Received 2019-08-23, Received in revised form 2020-01-30, Accepted 2020-03-09, Available online 2020-08-31
Journal of Petroleum Science and Technology
https://jpst.ripi.ir/
Introduction
Diminishing fossil resources for fuel production and growing environmental challenges have revealed the importance of research to develop new ways of mass-producing fuels or improve existing operation processes [1-2]. Moreover, technological deficiencies in the mass production of biofuels and renewable-resource fuels have led to the necessity of fossil fuel processes. Gasoline is one of the most commonly used fuels. The naphtha catalytic reforming process is vital to the production of high-octane gasoline in petroleum refineries from naphtha produced by distillation and hydrocracking units. The feedstock of the process is naphtha with a high amount of normal paraffin feedstock. This feedstock is converted into aromatic- and isoparaffin-enriched products by converting n-paraffins and naphthenes into the aforementioned species using bifunctional catalysts such as Pt-Sn/Al2O3 and Pt-Ge/Al2O3 in three or four reactors [3]. In addition, liquefied petroleum gas (LPG) and hydrogen are by-products of this unit. Reactor
inlet temperature, reactor pressure, and feed flow rates are the main operating variables in this unit [3-5]. The challenges related to the operation and management of this process include prolonging the life of the catalyst, producing gasoline with a constant and high-octane number, increasing the yield of the reformate, and reducing energy consumption.
[17], hydrodesulfurization (HDS) [18], and hydrocracking [19], different kinds of modeling (e.g., rigorous modeling) were applied to manage operating challenges. Also, as with other processes, FCC data-driven models such as the adaptive neuro-fuzzy inference system (ANFIS) and artificial neural network (ANN) were applied to investigate the catalytic reforming process [20-29]. The models were developed to estimate the impacts of various operating variables on outputs or to predict the physical properties and specifications of feedstock or products.
In this research, on an attempt to improve the quality of gasoline and minimize the average energy consumption of the catalytic reforming process, a kinetic model was developed that can estimate the effects of all main variables – including feed flow rate, reactor pressure, reactor inlet temperature, and the flow rate of chloride injection (as a main less studied operating variable). Different sets of experimental results and industrial information are applied to investigate the rate constants of the developed kinetic model. Eventually, the kinetic model and successive quadratic programming (SQP) optimization algorithm is applied to conduct a pseudo-dynamic optimization algorithm to determine the optimum operating plan in terms of gasoline quality maximization, process efficiency improvement, and energy consumption minimization.
Materials and Methods
The Experimental Pilot Plant, Apparatus, and Procedures
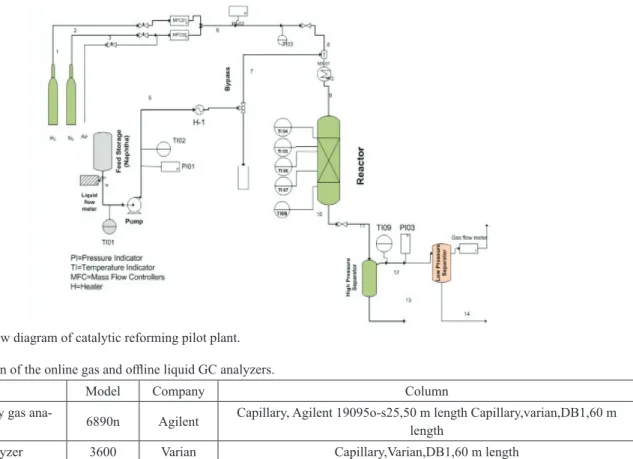
The experiments were carried out in the pilot setup illustrated in Figure 1. This setup was designed to conduct experiments related to the naphtha catalytic reforming process. The
operating pressure and temperature were below 735 psig and 1112 °F, respectively. The effective volume of the reactor containing the catalyst was 1.22 in3.
Hydrocarbon and hydrogen with specific ratios were mixed before being fed into the reactor. Moreover, to purge the system, nitrogen was injected into the system. Also, to burn the coke, thus preventing severe damage due to a sudden temperature rise, and to improve catalyst activity, a mixture of air and nitrogen was injected into the system at an appropriate temperature and atmospheric pressure after purging the system with nitrogen. To ensure a satisfactory decoking efficiency, the decoking procedure started at a temperature of 752 °F. The reactor temperature was gradually raised to a maximum value of 860 °F.
To start the pilot plant to carry out the experiments, the feed flowed through the reactor at operating pressure and then reached the reactor temperature once inside the reactor. The reactor was designed to apply a temperature profile to the reactive mixture. However, the experiments in this research were conducted under isothermal conditions. The reactor output stream is passed through a condenser from liquid products using two subsequent separators. One of them operated at high pressure, and the other at low pressure. The gaseous product of the condenser section was then transferred to the online analyzer to determine the composition of the product. Also, an offline GC was utilized for the analysis of liquid products. The specifications of the gas and liquid GC analyzer are given in Table 1. The X-ray diffraction (XRD) and X-ray fluorescence (XRF) analyses revealed that the selected catalyst was a bi-functional catalyst consisting of platinum and rhenium with a γ-Al2O3 structure. It should be mentioned that the experiments were run at the industrial hydrogen overfeed molar ratio of 5 to 5.5.
Fig. 1 Schematic flow diagram of catalytic reforming pilot plant.
Table 1 Specification of the online gas and offline liquid GC analyzers.
Name Model Company Column
Extended refinery gas ana
-lyzer 6890n Agilent Capillary, Agilent 19095o-s25,50 m length Capillary,varian,DB1,60 m length
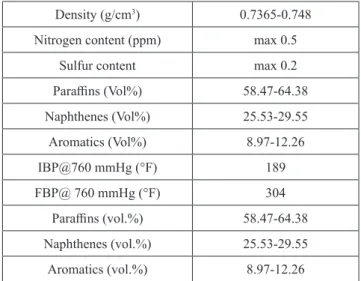
The specifications and composition of the utilized naphtha are given in Table 2. The specifications indicated in this table include density, sulfur content, paraffins, naphthene, and the true boiling point (TBP) curve based on ASTM D86. The specifications also include nitrogen and sulfur content determined based on ASTM D4629 and ASTM D5453, respectively. Based on the data, the initial boiling point is 189 °F, and the final boiling point is 304 °F.
Table 2 Specifications of naphtha feedstock.
Density (g/cm3) 0.7365-0.748
Nitrogen content (ppm) max 0.5
Sulfur content max 0.2
Paraffins (Vol%) 58.47-64.38
Naphthenes (Vol%) 25.53-29.55
Aromatics (Vol%) 8.97-12.26
IBP@760 mmHg (°F) 189
FBP@ 760 mmHg (°F) 304
Paraffins (vol.%) 58.47-64.38
Naphthenes (vol.%) 25.53-29.55
Aromatics (vol.%) 8.97-12.26
The UOP 703 and thermogravimetric methodology were applied to determine the amount of coke formed during the catalyst activation experiments.
Industrial and Experimental Data
Different sets of data were generated by conducting the experiments and those gathered from the industrial processes
Table 3 Natural and coded levels of design factors.
Coded level -1.68 -1 0 +1 +1.68
Natural level
X1: Temperature(°F) 806 835 878 921.2 950
X2: Pressure (psig) 397 411.6 434 456 470.4
X3: feed flow rate (lbmol/hr) 0.000302 0.000392 0.000454 0.000545 0.000606
that were carried out during the research. At first, by running the pilot plant, eighteen experiments were conducted based on the central composite design (CCD) methodology to determine the impacts of reactor temperature, reactor pressure, and feed flow rate on the output.
The operating conditions of the experiments are demonstrated
in Table 3, which presents wider ranges compared with
an industrial scale. Moreover, to determine the catalyst deactivation and coke formation rates, a set of time-consuming coking experiments was carried out.
The design matrix and the results of the experiments are demonstrated in Table 4. The compositions of reformates are chosen as the response variables of the experiments. The experimental results, illustrated in Table 4, show the noteworthy achievements for the naphtha catalytic reforming process and the implemented reaction networks. Indeed, the maximum observed values of aromatic, naphthenes, and paraffins are 83.34, 21.31, and 61.08 (vol.%), respectively. Meanwhile, the minimum amounts of the aforementioned components are 21.40, 2.27, and 12.82 (vol.%), respectively. Experiments 1, 2, 14, and 17 illustrated that an increase in the feed flow rate resulted in a decrease in the aromatic concentration and an increase in the naphthene composition. Moreover, experiments 1 and 3 showed that increasing the pressure raised the aromatic and paraffin concentrations while the amount of naphthenes decreased. The effect of temperature is shown in experiments 9 and 10. It is illustrated that raising the temperature increased the aromatic content, while naphthene and paraffin contents decreased. The experiments 17 and 18 revealed that simultaneous decline in temperature, pressure, and feed flow rate from coded level “0” to coded level “-1” decreased the aromatic and paraffin content and naphthenes composition.
Table 4 The Design matrix and results (compositions of reformates).
No 1 2 3 4 5 6 7 8 9
X1 -1 -1 -1 -1 1 1 1 1 -1.68
X2 -1 -1 1 1 -1 -1 1 1 0
X3 -1 1 -1 1 -1 1 -1 1 0
Aromatics (wt.%) 26.74 25.09 27.87 25.20 75.18 70.52 78.78 73.33 21.4
Naphthenes (wt.%) 15.56 18.42 14.16 17.24 3.12 3.52 2.82 3.94 21.31
Paraffins (wt.%) 58.73 57.86 59.35 59.06 22.72 27.23 20.43 24.68 56.1
No 10 11 12 13 14 15 16 17 18
X1 1.68 0 0 0 0 0 0 0 -1
X2 0 -1.68 1.68 0 0 0 0 0 -1
X3 0 0 0 -1.68 1.68 0 0 0 -1
Aromatics (wt.%) 83.34 35.26 35.75 47.99 31.7 35.68 35.81 35.13 26.38
Naphthenes (wt.%) 2.27 2.95 2.90 2.77 5.95 2.68 3.00 2.47 14.62
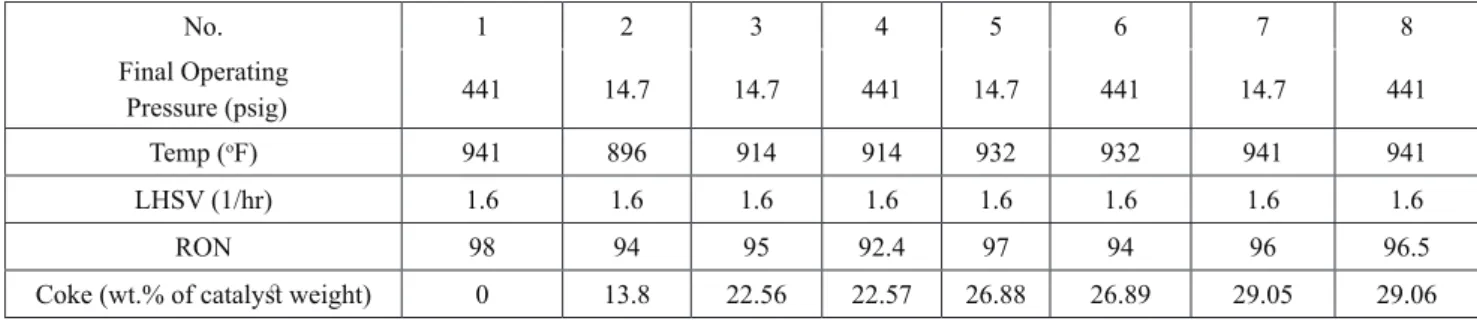
However, the results of experiments 8 and 17 illustrated that when the amount of the operating variable was simultaneously decreased from coded level “1” to coded level “0”, the aromatic and naphthenes exhibited a decreasing trend. However, paraffin shows an upward trend. The results of experiments 8, 17, and 18 show that the major variation in aromatic content happened while the operating variables simultaneously decreased from coded level “1” to “0”. Experiments 15 to 17 were designed based on the CCD methodology to predict the replicability of the experiments. The maximum deviations between the aromatic and paraffin contents of these experiments were 1.936% and 0.58%, respectively. However, the maximum detected deviation of naphthene is 0.53 (wt.%). The negligible deviation between these experiments supports the replicability of the experiments. Moreover, a comparison between experiments 15 to 17 and experiment 18 shows that decreasing all of the operating conditions led to a decrease in the aromatic and paraffin contents. However, the naphthene content increased. In Table 5, the results of the coking rate experiments are illustrated. The research octane number (RON) was also tested for each experiment to determine the effect of the coking rate on the activation of the catalyst. Ultimately, the results showed that accelerating the coking production reactions decreased the RON. This is due to a decrease in the catalyst activation, which consequently slowed down the aromatic production reactions.
Experiments 4 and 8 were designed to determine the effect of coke on the activation of the catalyst. In these experiments, coke was formed in experiments 3 and 7. Coke was accumulated at an operating pressure of one bar and the temperature set for experiments 3 and 7 during a five-day operating period. After the coke formation period, the pressure was increased to 30 bars to determine the productivity of deactivated catalysts under operating conditions. The operating period in these experiments with high operating pressure was two days.
Due to the impossibility of determining the effect of injecting chloride species on the production of light hydrocarbons, the quality of reformates in the pilot plant, and the necessity of the analysis and prediction of the conversion and product yields in industrial processes, the industrial data were also gathered and utilized. Indeed, an industrial data bank that
included six years of operating information was applied.
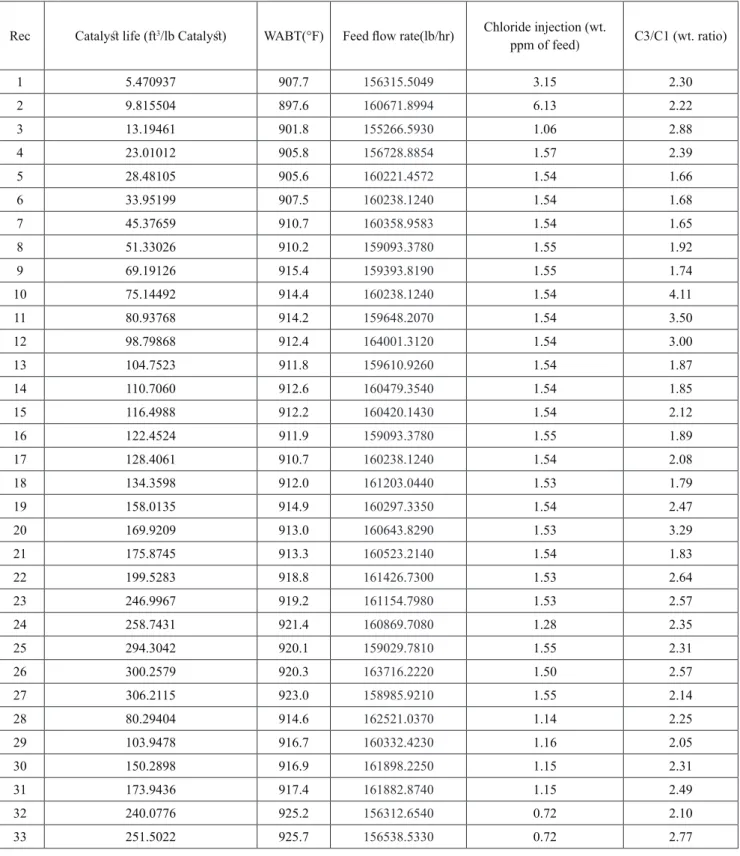
Table 6 demonstrates parts of the industrial data, including weight average bed temperature (WABT), feed flow rate, and chloride injection (wt ppm of feed) as the input variables, as well as the ratios of produced light hydrocarbons, including C3/C1 ratio, which was mainly influenced by the chloride injection rate. The aforementioned ratio simplifies the investigation of the impact of chloride injection on the formation of light hydrocarbons and the activation of catalysts.
Moreover, the developed model assisted in investigating the effects of feed flow rate, reactor inlet temperature, reactor inlet pressure, and chloride injection rate on the RON, reactor outlet temperature, the yield of reformate, and the product distribution of the reactor in the industrial-scale process. The industrial-scale process investigated in this research was a semi-regenerative process located in the Tehran Refinery complex. It has three fixed bed reactors that are packed with 18965, 31191, and 49237 lb of catalysts. The hydrotreated naphtha feed with a maximum flow rate of 157422 lb/hr was heated up to the reaction temperature before entering each reactor. The pressure of the feed stream was increased to between 367 and 441 psig. The outlet stream of the third reactor was cooled and passed through a flash drum and a distillation column to make the liquid gasoline product with a definite RON and Reid vapor pressure (RVP).
Modeling
Kinetic Modeling
To determine the effect of different input variables on the pilot-scale and to analyze the phenomena in the industrial-scale reactor, a kinetic model was developed. This model was developed based on four pseudo-components, including paraffins, naphthenes, aromatics, coke, and eight species (hydrogen, methane, ethane, propane, and normal and iso butanes and pentanes). The proposed kinetic model (Figure 2) was designed to be simple and accurate enough to be implemented in different complex models, such as computational fluid dynamic (CFD) models and time-consuming procedures, such as optimization. P, N, A, and C in this kinetic model represent paraffins, naphthenes, aromatics, and coke, respectively.
Table 5 Activity tests to determine coke and catalyst activity.
No. 1 2 3 4 5 6 7 8
Final Operating
Pressure (psig) 441 14.7 14.7 441 14.7 441 14.7 441
Temp (oF) 941 896 914 914 932 932 941 941
LHSV (1/hr) 1.6 1.6 1.6 1.6 1.6 1.6 1.6 1.6
RON 98 94 95 92.4 97 94 96 96.5
Table 6 Industrial data used to determine the impact of chloride injection rate.
Rec Catalyst life (ft3/lb Catalyst) WABT(°F) Feed flow rate(lb/hr) Chloride injection (wt.
ppm of feed) C3/C1 (wt. ratio)
1 5.470937 907.7 156315.5049 3.15 2.30
2 9.815504 897.6 160671.8994 6.13 2.22
3 13.19461 901.8 155266.5930 1.06 2.88
4 23.01012 905.8 156728.8854 1.57 2.39
5 28.48105 905.6 160221.4572 1.54 1.66
6 33.95199 907.5 160238.1240 1.54 1.68
7 45.37659 910.7 160358.9583 1.54 1.65
8 51.33026 910.2 159093.3780 1.55 1.92
9 69.19126 915.4 159393.8190 1.55 1.74
10 75.14492 914.4 160238.1240 1.54 4.11
11 80.93768 914.2 159648.2070 1.54 3.50
12 98.79868 912.4 164001.3120 1.54 3.00
13 104.7523 911.8 159610.9260 1.54 1.87
14 110.7060 912.6 160479.3540 1.54 1.85
15 116.4988 912.2 160420.1430 1.54 2.12
16 122.4524 911.9 159093.3780 1.55 1.89
17 128.4061 910.7 160238.1240 1.54 2.08
18 134.3598 912.0 161203.0440 1.53 1.79
19 158.0135 914.9 160297.3350 1.54 2.47
20 169.9209 913.0 160643.8290 1.53 3.29
21 175.8745 913.3 160523.2140 1.54 1.83
22 199.5283 918.8 161426.7300 1.53 2.64
23 246.9967 919.2 161154.7980 1.53 2.57
24 258.7431 921.4 160869.7080 1.28 2.35
25 294.3042 920.1 159029.7810 1.55 2.31
26 300.2579 920.3 163716.2220 1.50 2.57
27 306.2115 923.0 158985.9210 1.55 2.14
28 80.29404 914.6 162521.0370 1.14 2.25
29 103.9478 916.7 160332.4230 1.16 2.05
30 150.2898 916.9 161898.2250 1.15 2.31
31 173.9436 917.4 161882.8740 1.15 2.49
32 240.0776 925.2 156312.6540 0.72 2.10
Fig. 2 The applied reaction network at the pilot and industrial scales.
The reaction rates of the proposed reaction networks are demonstrated in Equations2 to 6:
1 1 1 3 1 1 1 ) ( ) [ ( * * )]
30total m eq Naphthenes Aromatic Hydrogen
eq
P k
Rate k P P P
k
= ϕ −
(1) 2 2 2 2 2 2 ) [ ( * * )] 30 m total
eq Naphthenes Hydrogen Paraffins eq
P k
Rate k P P P
k
= ϕ −
(2)
3 1 2 3
)i * Naphthenes i Total P Rate k P
= ϕ ϕ
(3)
4 2 6 3 8 4 10 4 10 5 12 5 12
: ; ; ; ; ; ;
i CH C H C H nC H iC H nC H iC H
4 1 2 4
)i * Paraffins i Total P Rate k P
= ϕ ϕ
(4)
4 2 6 3 8 4 10 4 10 5 12 5 12
: ; ; ; ; ; ;
i CH C H C H nC H iC H nC H iC H
1 2
5 1 2 5
*
) A romaticP NaphthenesP total
P P
Rate k
P
= ϕ ϕ
(5)
Equations 2 and 3 refer to the conversion of naphthenes into aromatics and naphthenes into paraffins respectively. However, Equations 4 and 5 represent the rate of hydrocracking naphthenes and paraffins which is required to produce light hydrocarbons, including C1 to C5. Also, Equation 6 is related to the coke formation reaction rates. In the above equations, φ1 and φ2 indicate the impact of catalyst deactivation and the chloride injection rate on the proposed equation rates respectively. The general form of the equation of ki and keq (i.e. reaction rate constants and equilibrium constants) are as follows:
0*exp( )
i eq E
k or k k
RT
= − (6) The general form of the deactivation function rate is considered as follows:
1 α*exp( C DOS* ) β
ϕ = − + (7)
where, C is the amount of coke formed on the catalyst, α and β are the equation constants, and DOS is the days on stream (in days).
Also, based on the industrial information, the general form of the deactivation function rate, φ2 is proposed as follows:
2 α1*f Feed flow rate1 *DOS β1
ϕ = − +
(8)
The impact of chloride injection is a function of the catalyst life and feed flow rate.
Reactor Mmodeling
The assumption of a one-dimensional plug flow reactor is applied for modeling and simulating the reactor of the pilot plant. To develop a proper reactor model, the integrated equations of mass and energy balance are applied as the governing equations. The utilized governing equations are as follows: Mass balance: 1 n i ij j F R w = ∂ = ∂
∑
(9) Energy balance:(
)
11( ) 1 *
n n n
i Pi i ij J
i j
T
FC R H Q
w = = = ∂ = ∆ + ∂
∑
∑ ∑
(10)where i refers to pseudo-components and light species, and j refers to the reaction rates related to the species. The reaction rates are demonstrated by Equations 1 to 6. Fi is the molar flow rate of the ith species, w is the weight of the catalyst in a packed bed, and H is the enthalpy change of the reaction. Also, T denotes the reactor temperature. Because the reactor is assumed to be an isothermal packed-bed reactor in the pilot plant, the energy balance equation (Equation 10) is eliminated for the kinetic estimation in the pilot plant. However, due to the variation of reactor temperature in the industrial reactor, the energy balance equation is considered. The related physical properties, including the heat capacity and enthalpy of the formation, are considered based on the available data [31].
Optimization
Optimizing the operating conditions to achieve a goal is one of the most important objectives of the process research. In the current work, optimization was applied in two steps. In the first step, optimization was utilized to determine the different constants of different reaction rates. For determining the value of rate constants, the following objective functions were applied:
2 2
mod mod exp
1 2
exp
* o el O ind el
O ind
T T Par Par
T Par
ω − +ω − +
2 2
mod exp mod exp
3 4
exp exp
el el
Nap Nap Aro Aro
Nap Aro
ω − +ω −
(11)
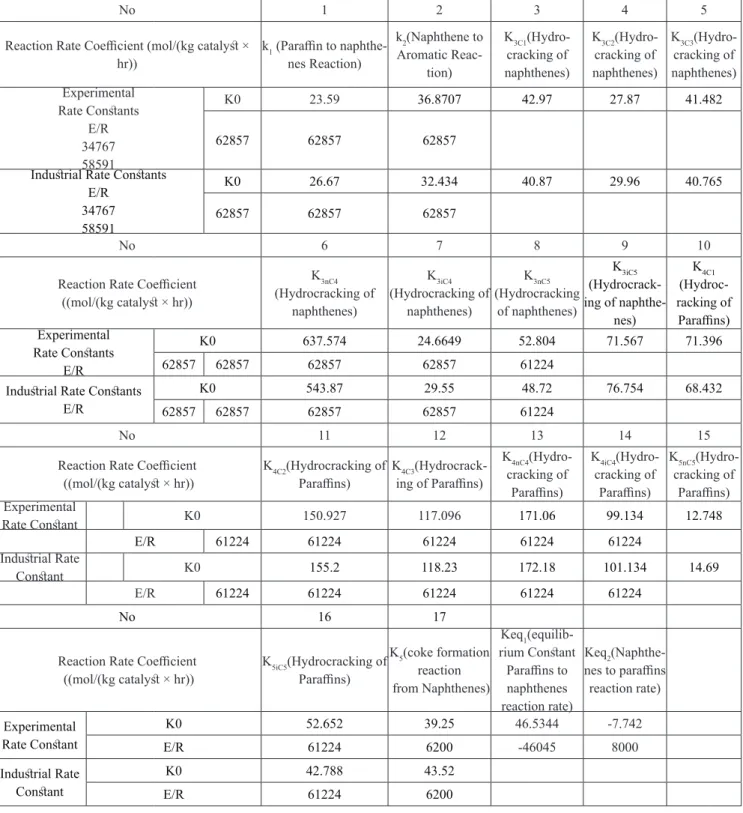
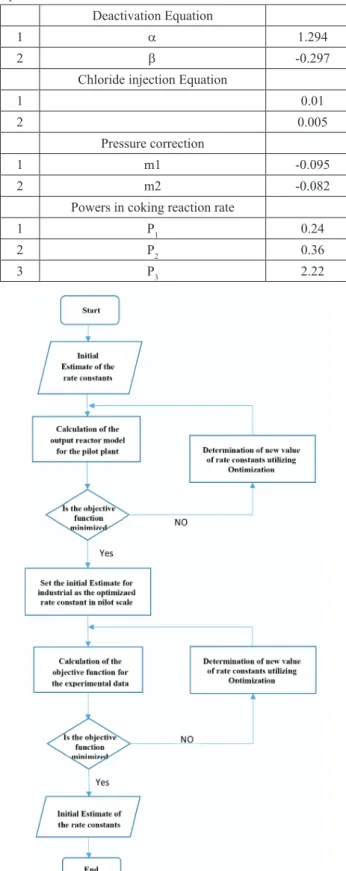
To specify the optimum rate constant, the objective function should be minimized. In fact, by minimizing the objective function, the difference between the calculated and experimental results can be minimized. The values of rate constants and deactivation functions, as well as the chloride injection impact, were calculated using this method, as demonstrated in Tables 7 and 8. To determine the rate constants of the reaction network, an optimization structure was utilized based on a flow chart demonstrated in Figure
Table 7 Rate constants of the reaction network introduced in Figure 2.
No 1 2 3 4 5
Reaction Rate Coefficient (mol/(kg catalyst ×
hr)) k1 (Paraffin to naphthenes Reaction)
-k2(Naphthene to
Aromatic
Reac-tion)
K3C1(Hydro
-cracking of naphthenes)
K3C2(Hydro
-cracking of naphthenes)
K3C3(Hydro
-cracking of naphthenes) Experimental
Rate Constants E/R
34767 58591
K0 23.59 36.8707 42.97 27.87 41.482
62857 62857 62857
Industrial Rate Constants E/R
34767 58591
K0 26.67 32.434 40.87 29.96 40.765
62857 62857 62857
No 6 7 8 9 10
Reaction Rate Coefficient ((mol/(kg catalyst × hr))
K3nC4
(Hydrocracking of naphthenes)
K3iC4
(Hydrocracking of naphthenes)
K3nC5
(Hydrocracking of naphthenes)
K3iC5
(Hydrocrack -ing of
naphthe-nes)
K4C1
(Hydroc
-racking of Paraffins) Experimental
Rate Constants E/R
K0 637.574 24.6649 52.804 71.567 71.396
62857 62857 62857 62857 61224
Industrial Rate Constants E/R
K0 543.87 29.55 48.72 76.754 68.432
62857 62857 62857 62857 61224
No 11 12 13 14 15
Reaction Rate Coefficient
((mol/(kg catalyst × hr)) K4C2(Hydrocracking of Paraffins) King of Paraffins)4C3(Hydrocrack
-K4nC4(Hydro
-cracking of Paraffins)
K4iC4(Hydro
-cracking of Paraffins)
K5nC5(Hydro
-cracking of Paraffins) Experimental
Rate Constant K0 150.927 117.096 171.06 99.134 12.748
E/R 61224 61224 61224 61224 61224
Industrial Rate
Constant K0 155.2 118.23 172.18 101.134 14.69
E/R 61224 61224 61224 61224 61224
No 16 17
Reaction Rate Coefficient
((mol/(kg catalyst × hr)) K5iC5(Hydrocracking of Paraffins)
K5(coke formation
reaction
from Naphthenes)
Keq1(equilib
-rium Constant Paraffins to
naphthenes
reaction rate)
Keq2(Naphthe
-nes to paraffins reaction rate)
Experimental Rate Constant
K0 52.652 39.25 46.5344 -7.742
E/R 61224 6200 -46045 8000
Industrial Rate Constant
K0 42.788 43.52
However, the industrial rate constants will be determined in the second step by considering the pilot plant rate constants as the initial estimate. Undoubtedly, the occurrence of numerous unknown complex phenomena in the industrial scale reactor causes a deviation from the pilot plant rate constants. The channeling phenomenon in the industrial fixed bed may have a strong impact on catalyst efficiency, and it consequently has a strong effect on the apparent rate constant. Table 8 Constants for deactivation and chloride injection impact
equations.
Deactivation Equation
1 α 1.294
2 β -0.297
Chloride injection Equation
1 0.01
2 0.005
Pressure correction
1 m1 -0.095
2 m2 -0.082
Powers in coking reaction rate
1 P1 0.24
2 P2 0.36
3 P3 2.22
Fig. 3 Flow chart of applied optimization structure.
The rate constants are demonstrated In Tables 7 and 8. In Table
7, two different groups of rate constant are demonstrated. The first group is calculated based on experimental data. However, the second group is calculated by minimizing the related objective function shown by Equation 12 based on industrial data.
The rate constants demonstrated in Table 8, including the constants of deactivation equation and pressure correction, are found out to be unique in the pilot plant and industrial scale. However, the constants for the chloride injection equation are determined based on the industrial data. In the second step, the optimization was applied to determine the most suitable operating conditions for achieving a certain goal during a definite operating period. In this step, two different optimization cases were investigated. In the first case, keeping the RON at the maximum value during a certain operating period was assumed as the target. However, in the second case, the target was to reach the maximum allowable RON with a minimum increase in temperature. The objective function for the first optimization case is defined as follows:
2
1
98 1 min
98 n
j
RON Obj Func imize
=
−
− =
∑
(12)
This objective function demonstrates the summation of the normalized difference between the observed RON and the maximum attainable RON. Indeed, each element of the summation phrase in this objective function refers to a specific operating day. Thus, the minimization of this objective function will determine the variation in the operating variables (decision variables) throughout the operating period so that the maximum attainable RON can be observed. This process will also ensure the production of high-quality gasoline.
( )
2
2
1 2
1
98 2 min
98
n
Wabt j
RON
ObjFunc imize ω ω Slope
=
−
− = +
∑
(13) In the above equation, WABT refers to the weight average bed temperature, which is calculated based on the following equation:
1 1 2 2 3 3
1
(
i o)
2(
i o)
3(
i o)
WABT
=
x T
+
T
+
x T
+
T
+
x T
+
T
(14) In which, x1, x2, and x3 refer to the catalyst weight fraction of each reactor. Ti and To refer to the inlet and outlet reactor temperature, respectively. By deactivating the catalyst, the Ti values of the reactors usually are increased to compensate for the negative effect of catalyst deactivation. Consequently, WABT was also increased by increasing the inlet reactor temperature. Therefore, decreasing the increasing rate of WABT throughout the operating period while the RON remains at its maximum level decreased the reactor inlet temperature and average energy consumption rate. Indeed, minimizing the slope of the WABT curve along the operating period and maximizing the RON, the rates of WABT increased, and energy consumption was minimized. Also, it guarantees the quality of the produced gasoline.reactor inlet pressure. To run the optimization algorithm, the initial estimates of these operating variables were fed into the optimization package as inputs. Then, the package, including the optimization algorithm, proper objective functions, and developed model was run to obtain the optimum variables. Due to the predefined objective functions, the results are presented as different curves that show variations among the operating variables versus operating time.
Results and Discussion
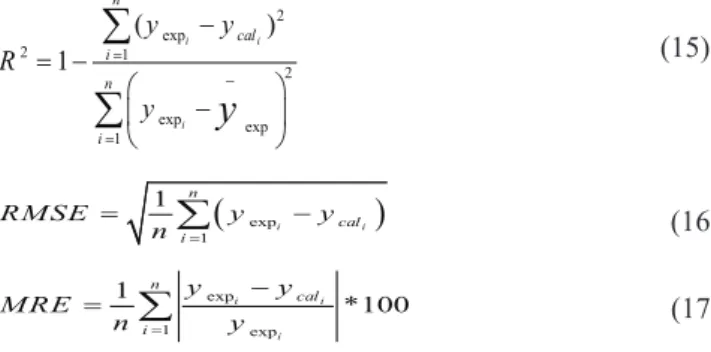
The accuracy of the proposed model was investigated by applying several statistical parameters, including the coefficient of determination (R2), root means square error
(RMSE) and the mean relative error (MRE). The parameters were calculated as per the following equations:
2 exp
2 1
2
exp exp
1
( )
1 i i
i
n
cal i
n
i
y y
R
y
y
=
−
=
− = −
−
∑
∑
(15)
(
exp)
11
i i
n
cal i
RMSE y y n =
=
∑
− (16)exp
1 exp
1 i i *100
i
n
cal i
y y MRE
n = y
−
=
∑
(17)where, yexp and ycal are the experimental and model-predicted values respectively; yexp is the mean of experimental values; and n is the number of samples. The optimal value of R2 is
1.0. However, the desired value for RMSE and MRE is 0. The results of the statistical tests are demonstrated in Table 9. In Figure 4, the scatter diagrams of the developed rigorous model are plotted against the data set of industrial information. Regarding this figure (Figure 4) and Table 8, the developed models are sufficiently accurate due to the high r-squared value, the low RMSE and MRE values.
Determining the effect of different input variables on the quality and quantity of a product is one of the vital steps in the analysis of a petroleum process. An interesting dependence of RON on weight-average inlet temperature (WAIT) and DOS is illustrated in Figure 5.
When the catalyst is fresh or in its early stages, increasing the WAIT could increase the RON to its maximum value. However, an increase in WAIT greater than the optimum value caused a decrease in the RON. When the DOS was increased and became more than 225 days, an increase in the WAIT decreased the RON. Moreover, the decreasing trend of RON during the DOS at a constant WAIT of greater than 926 °F was another factor that is clarified in this figure. Indeed, when the WAIT was less than 926 °F, the RON remained nearly constant.
To consider the impact of feed specification and properties on the process output variables, the mean average boiling point was considered as an index of the feedstock specification. This property is a function of species which exist in the feedstock.
In Figure 6, the dependence of RON on the mean average
boiling point and inlet reactor pressure is illustrated. It illustrates that increasing the mean average boiling point at constant inlet reactor pressure increased the RON value.
Table 9 Statistical results of the developed model for predicting the yields of produced lights, RON, and WABT.
Yields of produced light
hydrocarbon RON WABT
R2 (tunning data) 0.999 0.982 0.999
RMSE (tuning data) 0.1659 0.23 0.102
MRE (tuning data) 0.722 0.76 0.65
R2 (Validation data) 0.983 0.93 0.97
RMSE (validation
data) 0.853 0.42 0.52
MRE (validation
data) 6.2 5.72 2.25
Fig. 4 Comparison between the industrial and developed model re -sults.
Fig. 5 RON vs. DOS and weight average initial reactor temperature at the stable feed flow rate, reactor pressure, and chloride injection.
(a) RON
Fig. 6 RON vs Inlet reactor pressure and mean average boiling
point.
However, by increasing the pressure, the impact of the mean average boiling point on RON decreased. Indeed, increasing the mean average boiling point depends on the boiling point of each species. Since in the boiling range of feedstock, the high values of boiling point belong to naphthenes and aromatics [31], increasing the mean average boiling point relates to an increase in the value of naphthenes and aromatics. Based on the proposed reaction network, increasing these two species increased the formation of aromatics in the product of the reactor which increased the RON of the reactor outlet stream. This figure also illustrates that a simultaneous increase in the inlet reactor pressure and the mean average boiling point increase the RON. The composition of the feedstock can be determined from the upstream of the process. The effect of chloride injection rate on the hydrocracking reactions is represented in Figure 7. The effect of chloride injection on propane/methane molar ratios is demonstrated in this figure. This figure clarifies that the maximum values of the ratio strongly depend on catalyst life. By increasing catalyst life, the maximum value of the propane/methane mol ratio decreased.
Moreover, increasing the chloride injection above the maximum point caused a sharp reduction in the ratio. Consequently, it increased the methane concentration, which, in turn, decreased the quality of recycled gas and the product yield and changed the RVP of produced gasoline. Chlorides are injected into reactors to save and balance the acid functionality of the catalyst, which is needed for isomerization, cyclization, and hydrocracking reactions [23]. Specifically, manufactured catalysts contain chloride at up to 3 wt%, depending on its active metal content. By increasing the deactivation of the catalyst, chloride loss became significant, and inter alia contributed to a decrease in catalyst activity. A chloride injection on a fresh catalyst that contained enough chloride content and had enough acid functionality accelerated the hydrocracking reactions and decelerated useful reaction rates because of the extraordinary acidity power of catalyst.
Two optimization cases with two different objective functions that were previously defined were carried out. The optimum operating conditions are demonstrated in Figures 8 to 11. In
Figure 8, the optimum temperature profiles of three reactors throughout the operating period are illustrated. In Figure 8,
it is also illustrated that in the first optimization case, the first and second reactor temperature profile should exhibit a descending trend over the operating period, but the third reactor should present an upward trend.
Fig. 7 C3H8/CH4 molar ratio vs. chloride injection.
Fig. 8 Inlet temperatures of three reactors vs. days on stream for two different optimization cases.
Fig. 9 Feed flow rate for two different optimization cases and the field data.
Moreover, the optimum temperatures for the optimization cases were almost the same, except for that of the second reactor. Indeed, when the minimization of average energy consumption and the maximization of the RON were the goals of a process, the slope of the second reactor temperature curve was steeper for the fresh catalyst in comparison with other profiles.
Feed flow rate is an operating variable that is directly related to residence time. Whenever this operating variable was increased, the residence time of the reactor decreased and vice versa. Figure 9 demonstrates that the feed flow rates should be decreased over the operating period. The maximum reduction of feed flow rate for achieving optimum conditions was less than 0.8 vol.%. However, the field data demonstrated an increase in less than 1.6 vol.% over the operating period. As mentioned above, the rate of chloride injection could have a great impact on hydrocracking reactions and control the light hydrocarbons yield, liquid product yield, and RON. The decreasing trend of chloride injection via the deactivation of the catalyst is clarified in Figure 10. For the partially deactivated catalyst (for operating days on stream greater than 200), chloride injection became constant.
Reactor pressure has significant effects on aromatic production and coke formation rates [30]. High reactor pressures reduced the rate of aromatic and coke production and, as a result, decreased the RON of liquid products and increase catalyst life. On the contrary, a reduction in the reactor pressure increased aromatic and coke production rates. Consequently, the deactivation of the catalyst increased when the operating pressure decreased. This fact indicates the trend of RON and coke formation reported in Table 5.
The required changes to the inlet pressure of the first reactor are presented in Figure 11. Both optimization cases introduce a decreasing trend in the pressure over the operation time. However, for the second optimization case, the optimum inlet reactor pressure became almost constant after a specific operating time (days on stream).
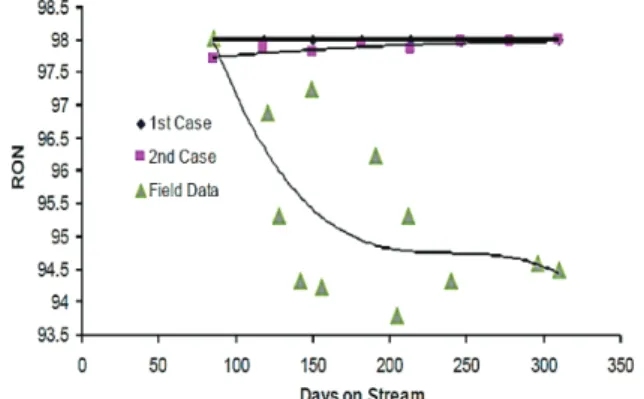
RON variations of the liquid product over the selected period in two different optimization cases are demonstrated in
Figure 12. The RON value in the second case increased from
97.7 to 98. The field data illustrate that the RON decreased by 4 units over the operating data.
The weighted average of the bed temperatures (WABT) of the three reactors is one of the key parameters used to determine reactor productivity.
The first case shown in Figure 13 portrays that to observe the Fig. 11 Inlet first reactor pressure (psig) vs. days on stream in two different optimization cases
maximum value of RON, the WABT should increase to its maximum value of 915 °F and then decrease along a similar slope. Indeed, increasing the inlet temperature increased the rate of coke formation and catalyst deactivation. It influenced the reaction rates and consequently impacted the output reactor temperature.
Fig. 12 RON vs. days on stream in two different cases of optimi -zation.
Fig. 13 WABT vs. days on stream in two different optimization cases.
Taking an operating strategy that maintains WABT at a constant level minimizes the catalyst deactivation rate and, thus, prolongs the catalyst life. As Figure 14 illustrates, the WABT profile was kept constant by running the second optimization case while the RON underwent limited variations.
Furthermore, the implementation of the optimum operating conditions based on the optimization and modeling calculations will also improve reformate yield along the operating period—this factor related to the decrease in the rate of deactivation.
Conclusions
To improve the efficiency of naphtha catalytic reforming process as a crucial gasoline production process, three dis-tinct and sequential steps were considered in this research. First, different sets of experiments were designed and carried out to determine the effects of different operating variables – including feed flow rate, reactor temperature, and reactor pressure – on the yield of aromatics, naphthenes, paraffins, and coke. Then, based on the experimental results, a kinetic model was developed to predict the formation and consump-tion of all products.
Also, a wide range of industrial data was applied to validate the developed kinetic model and determine the impacts of chloride injection and catalyst deactivation on an industrial scale. Moreover, the developed kinetic model was applied to determine the impact of different operating conditions on the RON of the produced gasoline and the distribution of light hydrocarbons.
To improve the efficiency and minimize the energy con -sumption of the process, an optimization procedure during the third step of this research was applied. Indeed, among all components of the process, furnaces had the greatest impact on energy consumption. Therefore, the authors determined a procedure to reduce the average inlet temperature of the reactors while the average gasoline product and RON were maintained at their maximum values during the operating period. Using this procedure is expected to greatly reduce energy consumption.
It is concluded that the determination of definite and opti -mum profiles for the selected operating variables, during the operating period, reduced the average inlet temperature and maximized the RON and yield of liquid products. The downward trends for the inlet reactor pressure, the inlet tem-perature of the first and second reactors, and the flow rate, together with the upward trends for the inlet temperature of the third reactor, minimized the deactivation of the catalyst. As a result, it minimized energy consumption and kept the RON around the maximum value.
Moreover, the rate of decline of the inlet temperature of the second reactor was influenced by the deactivation of the cat -alyst, while the minimization of energy consumption and the maximization of RON were the goals of optimization. Fur -thermore, light variations of a feed flow rate of less than 0.6 vol.% guaranteed the profitability of the process. Ultimately, by applying the predetermined operating conditions, catalyst life was prolonged. Moreover, the average conversion of the process and the average RON of the liquid product improved by 6% and 2.5 units, respectively.
Nomenclatures
φ1: Catalyst deactivation factor implemented in reaction rates
φ2: Chloride injection factor implemented in reaction rates α: Constant of deactivation equation
Β: Constant of deactivation equation
α': Constant of the full quadratic statistical model
β': Coefficient of phrases in the full quadratic statistical model α1: Constant of the equation of chloride injection calculation equation
β1: Constant of the equation of chloride injection calculation equation
ωi: Weight factors in the objective function LHSV:
LPG: Liquid hourly space velocity (1/hr) Liquefied petroleum gas
RON: Research Octane number
WABT: Weight average bed temperature (ºF)
k1: Rate constants of Naphthenes to aromatic reaction (mol/ (kpa kg catalyst hr))
k2: Rate constants for Naphthenes to paraffins reactions (mol/ (kPa2 kg catalyst hr))
k3i, k4i: Rate constants of paraffins and Naphthenes hydroc -rackings
k5 : Rate constant of coke production reaction rate Fi: Molar flow rate of species i, mol hr -1
w: Catalyst weight (kg) T: Reactor temperature (ºC)
CPi: Specific heat capacity,kJ/ (mol.K) ΔHj: Enthalpy of reaction, kJ. Kg-1
Q: Heat flux, kJ m-2 S-1
To: Reactor outlet temperature (°C)
Par: Composition of paraffin species (mol %) Nap: Composition of Naphthenes species (mol %) Aro: Composition of Aromatic Species (mol %) Paromatics: The partial pressure of Aromatics (bar) Phydrogen: The partial pressure of hydrogen (bar) Pnaphthenes: The partial pressure of paraffins (bar) Pparaffins: The partial pressure of paraffins (bar) pi: Constants of coking reaction rate
mi: Constants of the pressure correction factor for the main reaction rates
R: Reaction rate
Slope WABT: The slope of WABT vs operating time curve Chl: The injection rate of chloride species (ppm of feed flow rate)
Catallife Catalyst life (m3/kg catalyst)
rP
SQP Reactor inlet pressure (bar) Successive quadratic programming TD
WAIT
Reactor temperature difference (ºC) Weight-average inlet temperature
Acknowledgment
The authors wish to express their thanks to the R&D unit of Tehran Refinery for the informational and financial support of this study.
References
1. Xiaofang Liu, RiuWang, (2018) Upgrading of carbohydrates to the biofuel candidate 5-Ethoxymethyl furfural (EMF), International journal of chemical engineering 1-10.
2. Fan W, Liu Y, Wang K (2016) Detailed experimental study on the performance of monoethanolamine, diethanolamine, and diethylenetriamine at absorption/ regeneration conditions, Journal of Cleaner Production, 125, 296-308.
Industrial catalytic naphtha reforming process, Industrial & Engineering Chemistry Research 56, 31: 8961-8971. 4. Rangaish GP, Sharma S (2017) Advances in Process
System Engineering–Vol.6; differential evolution in chemical engineering development and application, World Scientific, 84-85.
5. Mohaddecy SR, Sadighi S, Zahedi S, Bonyad H (2006) Reactor modeling and simulation of catalytic reforming process, Petroleum and Coal Journal 48, 28-35.
6. Belinskaya N, Ivanchina E, Silko G (2014) Effect of feed composition changing at naphta catalytic reforming unit due to involvement of gasoline fraction obtained by diesel fuels hydro-dewaxing into the processing, Procedia Chemistry, 10, 267-270.
7. Kim S, Urm J, Shik Kim D, Lee K, Min Lee J (2018) Heavy naphtha fractions 85-155oC recycling in the
catalytic reforming industrial unit, Korean Journal of Chemical Engineering 35: 2327-2335.
8. Krane H G, Groh A B, Schulman B D, Sinfelt J H (1959) Reactions in catalytic reforming of naphtas, Fifth World Petroleum Congress, New York 111: 39-51.
9. Marin GB, Froment GF (1982) Reforming of C6 hydrocarbons on a Pt-Al2O3 catalyst, Journal of Chemical Engineering Science 37: 759-773.
10. Padmavathi G (1997) Modeling and simulation of commercial catalytic naphtha reformers, Journal of Chemical Engineering, 75: 930-937.
11. Smith R B (1959) Kinetic analysis of naphtha reforming with platinum catalyst, Chemical Programming 55: 76-80.
12. Sadighi S, Mohaddecy RS, Abbasi A (2018) Modeling and optimizing a vacuum gasoil hydrocracking plant using an artificial neural network, International Journal of Technology 4, 2: 99-109.
13. Wei W, Craig AB, Tanaka R, Hou G, Klein MT (2008) Detailed kinetic models for catalytic reforming”, Fuel Processing Technology, 89: 344-349.
14. Zhorov Y M (1965) Mathematical description of platforming for optimization of a process, Kinetika i Kataliz, 6, 1092-1098.
15. Zahedi Abghari S, Towfighi Darian J, Karimzadeh R, Omidkhah M R, (2008) Determination of Yield distribution of olefin production by thermal cracking of atmospheric gasoil, Korean Journal of Chemical Engineering, 25(4), 681-692.
16. Zahedi.Abghari S, Sadi M (2013) Application of adaptive neuro-fuzzy inference system for the prediction of the yield distribution of the main products in the steam cracking of atmospheric gasoil, J Taiwan Inst Chem Eng, 44(3), 365-376.
17. Hayati R, Zahedi Abghari S, Sadighi S, Bayat M (2015) Development of a rule to maximize the research octane number (RON) of the isomerization product from light naphtha, Korean Journal of Chemical Engineering, 32(4), 629-635.
18. Kadijani J A, Narimani E, Kadijani H A (2016) Using response surface methodology to optimize ultra sound- assisted oxidative desulfurization, Korean Journal of Chemical Engineering, 33, 1286-1295.
19. Naderi H, Shokri S, AhmadPanah S (2018) Optimization
of kinetic lumping model parameters to improve products quality in the hydrocracking process”, Braz. J.Chem.Eng., 35(2); 757-768.
20. Hao Z, Qian X, Cen K, Fan J (2003) Optimizing pulverized coal combustion performance based on ANN and GA, Fuel Processing Technology., 85, 113-124. 21. Wu C, Zhang J, Li W, Wang Y, Cao H (2006) Artificial
neural network model to predict cold filter plugging point of blended diesel fuels, Fuel processing technology 87; 585-590.
22. Pasadakis N, Gaganis V, Foteinopoulos C (2006) Octane number prediction for gasoline blends, Fuel Process. Technol., 87, 505-509.
23. Lukec I, Sertic-Bionda K, Lukec D (2008) Prediction of sulphur content in the industrial hydrotreatment process, Fuel Process. Technol., 89,292-300.
24. Quan- Shan L, Da-Zi L, Liu-Lin C (2015) Modeling and optimum operating conditions for FCCU using artificial neural network”, J. Cent. South Univ., 22, 1342-1349. 25. Inal F (2006) Artificial neural network predictions of
polycyclic aromatic hydrocarbon Formation in premixed n-heptane flames, Fuel Processing Technology, 87, 1031-1036.
26. Murty B S N, Rao R N (2004) Global optimization for prediction of blend composition of gasolines of desired octane number and properties, Fuel Processing Technology, 85, 1595-1602.
27. Zahedi G, Zadeh S M, Moradi G (2008) Enhancing gasoline production in an industrial catalytic reforming unit using artificial neural networks, Energ. Fuel, 22, 2671-2677.
28. Marzbanrad J, Mashadi B, Afkar A, Pahlavani M (2016) Dynamic rupture and crushing of an extruded tube using artificial neural network (ANN) approximation method; Journal of Central South University, 23, 869-879. 29. Yang Z, Qiao W M, Liang X Y, (2017) Modeling and
optimization of the pore structure of carbon aerogels using an artificial neural network, New Carbon Mater, 32(1), 77-85.
30. Swang A, Rouge B (1989) Catalyst reforming process: US Patent, 4832821.
![Fig. 2 The applied reaction network at the pilot and industrial scales. The reaction rates of the proposed reaction networks are demonstrated in Equations2 to 6: 1 1 11 311)() [(** )]](https://thumb-us.123doks.com/thumbv2/123dok_us/8032704.2126958/6.892.120.387.93.309/reaction-industrial-reaction-proposed-reaction-networks-demonstrated-equations.webp)