442
Establishing some Correlations between Certain
Morphometric Parameters and Embryo Quality
Nicolae P
ă
cal
ă
, Ioan Bencsik, Dorel Dronca, Gabi Dumitrescu, Ada Cean, Alexandra Ivan,
Oana Ciobotaru
Banat’s University of Agricultural Sciences and Veterinary Medicine, Faculty of Animal Sciences and Biotechnologies 300645 Timisoara, Calea Aradului 119, Romania
Abstract
The aim of this paper was to establish some correlations between certain morphometric parameters and embryo quality. The morphometric parameters taken into consideration were: zona pellucida thickness, outer and inner diameter, and outer and inner perimeter. For experiments we used embryos recovered at 24 hours from mouse females superovulated with gonadotrope hormones (eCG and hCG). The embryos recovered were cultivated in KSOM media, supplemented with amino acids, and during the in vitro cultivation they were measured at different time intervals for establishing morphometric parameters. The data obtained were statistically analyzed using Minitab 15, using Fitted Line Plot regression that allows testing of the linear and polynomial regression of one variable. After statistical analyze of the data we found that the thickness of the zona pellucida can constitute a morphometric parameter that can be used as an indicator of subsequent development of the 2 cell embryos to morula and blastocyst stage respectively. The other morphometric parameters studied (outer and inner diameter, and outer and inner perimeter) cannot be used as indicators of the embryo development.
Keywords: embryo quality, morphometric parameters, mouse embryos
1. Introduction
Currently the morphological evaluation method is one of the most used methods for embryo quality assessment. This method has the advantage to be fast and noninvasive assuring a reduce manipulation of the embryos at low cost, but still holds the disadvantage to be subjective (the result is influenced by the surveyor experience) and does not offer information’s related to cell membrane integrity nor identification of genetic and metabolic anomalies. The quality concept is difficult to define. Is considered that satisfying quality embryos are corresponding chronologically and morphologically to the
* Corresponding author: Păcală N., Tel. 02576
277181, Fax. 0256 277 110, Email:
developmental stage and to the day of the embryo recovery [1].
Quality assessment fallowing morphological criteria is one of the most modern methods for embryo evaluation.
443 Between the zona pellucida thickness and the pregnancy rates has been observed the existence of a correlation. The embryos with a zona pelucida thickness higher of 15 µm have a lower implantation rate [6].
For zona pellucida thickness measurement can be used image analysis programs. These programs allow performing a series of analysis like; measurement of polar bodies angles, the pronucleus, the zona pellucida, and the cell diameter. Following analyzing the data’s an embryo quality classification can be made.
The aim of this paper was to establish the existence of certain correlations between the main morphometric parameters and the embryo quality.
2. Materials and methods
For these experiments were used mouse embryos in vivo obtained by superovulation.
The superovulation was made as presented: - 5 UI eCG (equine Chorionic Gonadotropin) administrated on day 0,
- 5 UI hCG (human Chorionic Gonadotropine) at 48 hours following eCG and following hCG administration the females were allowed to mate with the males,
- on the 3-ed day the vaginal plug was checked, - on the 4-th day the embryo recovery was preformed .
The 2 cells embryos were measured for establishing the morphometric parameters and in vitro cultivated in KSOM media, supplemented with essential and nonessential amino acids. During in vitro cultivation at 48 and 72 hours interval morphomteric measurements were performed. Of the cultivated embryos for establishing correlations among the morphometric parameters and their quality were taken in consideration only embryos that reached the blastocyst stage at 72 hours. For performing the embryo morphomtery was used the Quick Photo Micro 2.2.program. This program is easy to use and offers information’s directly in Microsoft Excell, by automatic calculation of zona pellucida thickness, embryo diameter and perimeter only by the simple mark of the areas of interest. For each parameter taken in to account were performed 10 measurements and the value taken in consideration represented the average of these measurements. For statistical interpretation was used the Minitab, 15. For testing the correlation we used the Fitted Line Plot regression, which allows the linear and polynomial regression (degree 2 and 3) testing.
3. Results and discussion
In table 1 are presented the results obtained after embryo recovery.
Table 1. Results obtained at embryo recovery from mouse superovulated females
Superovulate females
N
Vaginal plug females
Recovered embryos Of which:
N Oocyte 2 cells embryos 4 cells embryos
n % n % n % n %
10 8 80.0 174 21.75 20 11.49 130 74.71 24 13.8
From table 1 can be observed that from the 10-th superovulated females only 8 (80.0%) were identified with vaginal plug, of which were recovered 174 embryos, representing 21.75 embryos/female. Of the 174 embryos collected, 20 (11.49%) were non-fertilized oocytes, 130 (74.71%) were two cell embryos and 24 (13.8%) were 4-cell embryos.
During in vitro cultivation of the 130 2-cell embryos only 32 reached the blastocyst stage, and the measurements were used to determine correlations. Correlation analysis for the zona pellucida thickness of the two cell stage embryos
that developed to morula stage showed a very strong, positive linear correlation. The inear regression equation was: morula = 1.524 + 0.9436 2 cells (S = 0.308064 R-Sq = 92.3% R-Sq(adj) = 92.0%) (Figure 1.a).
Correlation analysis for the pellucid zone thickness of the two cell stage embryos that developed to the blastocyst stage showed that there was a strong linear, positive correlation. The
linear regression equation was: blastocyst
=
444 Correlation analysis for the pellucid zone thickness of morula stage embryos that developed to the blastocyst stage showed that there was a moderate, positive, linear correlation. The linear
regression equation was: blastocyst = 0.875 + 0.5983 morula (S = 0.632947 Sq = 52.3% R-Sq(adj) = 50,8%) (Figure 1.c).
11 10 9 8 7 12
11
10
9
8
2 celule
mo
ru
la
S 0,308064 R-Sq 92,3% R-Sq(adj) 92,0% Regression
95% CI Analiza regresiei liniare pentru grosimea zonei pelucide
morula = 1,524 + 0,9436 2 celule
a
7 8 9 10 119
8
7
6
5
2 celule
bl
a
st
o
ci
st
S 0,554719 R-Sq 63,4% R-Sq(adj) 62,2% Regression
95% CI Analiza regresiei liniare pentru grosimea zonei pelucide
blastocist = 0,9771 + 0,6468 2 celule
b
12 11 10 9 8 9
8
7
6
5
morula
bl
a
st
o
ci
st
S 0,632947 R-Sq 52,3% R-Sq(adj) 50,8% Regression
95% CI Analiza regresiei liniare pentru grosimea zonei pelucide
blastocist = 0,875 + 0,5983 morula
c
Figure 1. Graphical representation of linear regression for the thickness of the zona pellucida
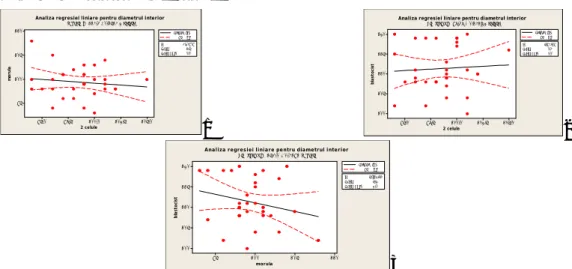
Correlation analysis for the inner diameter of two cell stage embryos that developed to morula stage showed that there is a very weak negative, linear correlation. The regression line equation was: morula = 685.4 – 11.74 2 cells + 0.05876 2 cells**2 (S = 3.21894 R-Sq = 4.2% R-Sq(adj) = 0.0%) (figure 2.a).
Correlation Analysis for the inner diameter of two cell stage embryos that developed to morula stage showed that there is a very weak, negative linear correlation. The regression line equation was:
blastocyst = 97.37 + 0.1418 2 cells (S = 5.94709
R-Sq = 0.4% R-Sq(adj) = 0.0%) (figure 2.b).
Correlation analysis for the inner diameter of morula stage embryos that developed to the blastocyst stage showed a very weak, linear negative correlation, the regression line equation is: blastocyst = 153.0 – 0.4191 morula (S = 5.80266 R-Sq = 5.2% R-Sq(adj) = 2.0%) (figure 2. c).
Figure 2. Graphical representation of linear regression for the thickness of the inner diameter
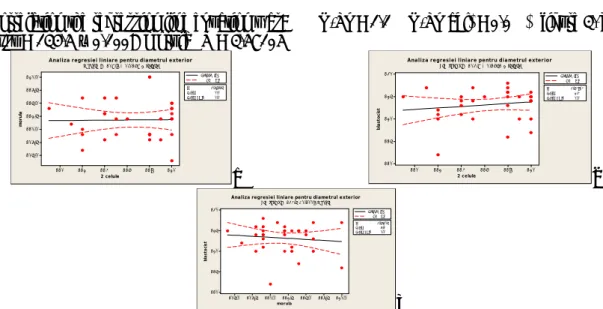
Correlation Analysis for the outer diameter of two cell stage embryos that developed to morula stage showed no correlation between (figure 3.a.). Correlation analysis for the outer diameter of two cell stage embryos that developed to the blastocyst stage showed a very weak, positive, linear
correlation, the regression line equation was: blastocyst = 103.9 + 0.1651 x 2 cells (S = 3.54804 R-Sq = 2.4% R-Sq (adj) = 0.0%) (figure 3.b). Correlation analysis for the outer diameter of morula stage embryos that developed to the blastocyst stage showed a very weak, negative
105,0 102,5 100,0 97,5 95,0 110
105
100
95
2 celule
mo
ru
la
S 3,20909 R-Sq 1,5% R-Sq(adj) 0,0% Regression
95% C I Analiza regresiei liniare pentru diametrul interior
morula = 114,3 - 0,1514 2 celule
a
95,0 97,5 100,0 102,5 105,0120
115
110
105
100
2 celule
bl
a
st
o
ci
st
S 5,94709 R-Sq 0,4% R-Sq(adj) 0,0% Regression
95% C I Analiza regresiei liniare pentru diametrul interior
blastocist = 97,37 + 0,1418 2 celule
b
110 105 100 95 120
115
110
105
100
morula
bl
a
st
o
ci
st
S 5,80266 R-S q 5,2% R-S q (ad j) 2,0% Reg ressio n
95% C I Analiza regresiei liniare pentru diametrul interior
blastocist = 153,0 - 0,4191 m orula
445
linear correlation the regression line equationwas:
blastocyst = 134.5 – 0.1008 morula (S = 3.57105
R-Sq = 1.1% R-Sq(adj) = 0.0%) (figure 3. c).
120 118 116 114 112 110 120,0 117,5 115,0 112,5 110,0 107,5 105,0
2 celule
mo
ru
la
S 3,75665 R-Sq 0,0% R-Sq(adj) 0,0% Regressio n
95% C I Analiza regresiei liniare pentru diametrul exterior
morula = 109,8 + 0,0169 2 celule
a
110 112 114 116 118 120130
125
120
115
110
2 celule
bl
a
st
o
ci
st
S 3,54804 R-Sq 2,4% R-Sq(adj) 0,0% Regressio n
95% C I Analiza regresiei liniare pentru diametrul exterior
blastocist = 103,9 + 0,1651 2 celule
b
120,0 117,5 115,0 112,5 110,0 107,5 105,0 130
125
120
115
110
morula
bl
a
st
o
ci
st
S 3,57105 R-Sq 1,1% R-Sq(adj) 0,0% Regression
95% C I Analiza regresiei liniare pentru diametrul exterior
blastocist = 134,5 - 0,1008 morula
c
Figure 3. Graphical representation of linear regression for the outer diameter
Correlation analysis for the inner perimeter of two cell embryos that developed to morula stage showed a positive very weak correlation between them, the regression line equation was: morula = 189.2 + 0.3859 x 2 cells (S = 6.47525 R-Sq = 4.1% R-Sq(adj) = 0,9%) (figure 4.a).
Correlation analysis for the inner perimeter of the two cell stage embryos that developed to the blastocyst stage showed that there was a negative, very weak, linear correlation, the regression line equation was: blastocyst = 352.4 – 0.1024 2 cells
(S = 5.88691 R-Sq = 0.4% R-Sq(adj) = 0.0%) (figure 4. b).
Correlation analysis for the inner perimeter of the embryos in morula stage that developed to the blastocyst showed a very weak, linear, positive correlation. The regression line equation was: blastocyst = 291.7 + 0.0969 x morula (S = 5.86283 R-Sq = 1.2% R-Sq(adj) = 0,0%) (figure 4.c).
316 312 308 304 300 325 320 315 310 305 300
2 celule
mo
ru
la
S 6,47525 R-Sq 4,1% R-Sq(adj) 0,9% Regressio n
95% C I Analiza regresiei liniare pentru perimetrul interior
morula = 189,2 + 0,3859 2 celule
a
316 312 308 304 300 335 330 325 320 315 310
2 celule
bl
a
st
o
ci
st
S 5,88691 R-Sq 0,4% R-Sq(adj) 0,0% Regression
95% C I Analiza regresiei liniare pentru perimetrul interior
blastocist = 352,4 - 0,1024 2 celule
b
325 320 315 310 305 300 335 330
325 320 315 310
morula
bl
a
st
o
ci
st
S 5,86283 R-Sq 1,2% R-Sq(adj) 0,0% Regression
95% CI Analiza regresiei liniare pentru perimetrul interior
blastocist = 291,7 + 0,0969 morula
c
Figure 4. Graphical representation of linear regression for the inner perimeter
Correlation analysis for the outer perimeter of the two cell stage embryos that developed to morula stage showed that there was a weak correlation between them, the regression polynomial equation was: morula = - 26283 + 243.1 2 cells – 0.738 2 celule**2 + 0.000744 x 2 cells**3 (S = 26.2844 R-Sq = 8.0% R-Sq(adj) = 0,0%) (figure 5.a). Correlation analysis for the outer perimeter of the
446 stage embryo that developed to the blastocyst stage showed a very weak correlation, the polynomial regression equation was: blastocyst = - 16948 + 149.8 morula – 0.4308 morula**2 +
0.000412 morula**3 (S = 18.6184 R-Sq = 1.4% R-Sq(adj) = 0.0%) (figure 5.c.).
380 370 360 350 340 330 320 310 390 380 370 360 350 340 330 320 310 300
2 celule
mo
ru
la
S 26,2844 R-Sq 8,0% R-Sq(adj) 0,0% Regression
95% CI Analiza regresiei cubice pentru perimetrul exterior
morula = - 26283 + 243,1 2 celule - 0,738 2 celule**2 + 0,000744 2 celule**3
a
310 320 330 340 350 360 370 380400 390 380 370 360 350 340 330 320 310
2 celule
bl
a
st
o
ci
st
S 16,6631 R-Sq 21,0% R-Sq(adj) 12,5% Regression
95% CI Analiza regresiei cubice pentru perimetrul exterior
blastocist = - 58336 + 524,0 2 celule - 1,555 2 celule**2 + 0,001535 2 celule**3
b
380 370 360 350 340 330 320 310 400 390 380 370 360 350 340 330 320 310
morula
bl
a
st
o
ci
st
S 18,6184 R-Sq 1,4% R-Sq(adj) 0,0% Regression
95% CI Analiza regresiei cubice pentru perimetrul exterior
blastocist = - 16948 + 149,8 morula - 0,4308 morula**2 + 0,000412 morula**3
c
Figure 5. Graphical representation of linear regression for the outer perimeter
4. Conclusions
1.Between the pellucid zone thickness of the two
cell stage embryos that developed to morula stage, there is a very strong, linear and positive correlation, (morula = 1.524 + 0.9436 x 2 cells). 2. Between the pellucid zone thickness of the 2 cell stage embryos that developed to the balstocyst stage there is a strong linear correlation (blastocyst = 0.9771 + 0.6468 x 2 cells).
3. Between the pellucid zone thickness of the morula stage embryo that developed to the blastocyst stage there is a moderate, linear, positive correlation (blastocyst = 0.875 + 0.5983 x morula).
4. The pellucid zone thickness represents a morphometric parameter that can be used as an embryo quality indicator apart of the embryo developmental stage. The rest of the morphometric parameters understudy (inner and outer diameter, inner and outer perimeter) can not be used as indicators of the embryo quality.
Acknowledgements
This work was supported by CNCSIS–UEFISCSU, project number 1088/2009 PNII–IDEI, code 2515/2008
References
1. Steer, C. V., Mills, C. L., Tan, S.L. , Campbell, S., Edwards, R. G., The cumulative embryo score: a predictive embryo scoring technique to select the optimal number of embryos to transfer in an in vitro fertilization and embryo transfer program, Human Reproduction, 1992, 7, 117-116
2. Păcală, N., Cean, A., Boleman, A., Căpriță, R.,
Bencsik, I., Dronca, D., Dumitrescu, G., Establishing some morphometric parameters usable in estimating the quality of mouse embryos, in different developmental
stages, Lucrări Ştiinţifice Seria Zootehnie, 2011, 55
3. Cean, A., Păcală, N., Boleman, A., Dumitrescu, G.,
Dronca, D., Morphometric Characterization of Mouse Embryos Obtained by In Vitro Fertilization, Bulletin UASVM Cluj-Napoca, Animal sciences and Biotechnologies, 2010, 67 (1-2), 484
4. Boleman, A., Pacala, N., Cean, A., Caraba, V., Morphometric evaluation of mouse embryos in vitro cultivated, Buletinul USAMV-CN, 2009, 66 (1-2), 486 5. Prasad, S. V., Skinner, S. M., Carino, C., Wang, N., Cartwright, U. J., Structure and Function of the Proteins of the Mammalian Zona pellucida, Cells Tissues Organs, 2000, 166, 148-164