texas school district transportation services
introduction
This review describes the public school transportation funding system and provides an analysis of the state allotment and district costs from school years 2000–01 to 2004–05. The review culminates with common recommendations from Legislative Budget Board (LBB) School Reviews, which contribute to districts operating efficient school transportation systems and potential cost savings.
Background
The Texas Education Code (TEC) §42.155 entitles independent school districts or county operated transportation systems to funding allotments for transportation cost. The allotment for the regular education program is derived from the daily cost of operating and maintaining the regular transportation system per regular eligible student, and the “linear density” of that system. Linear density is the average number of regular eligible students transported daily, divided by the approved daily route miles traveled in the district. Texas school districts are eligible for reimbursement from the state for transporting regular education program, special education program, and career and technology education (CTE) program students. Reimbursement for special education transportation is a per mile allotment set by the Texas Legislature. The reimbursement for the CTE program is based on the cost for regular education program miles for the previous fiscal year. Miles driven on routes with students on board are reimbursable; “deadhead miles” (miles driven to or from a route) or maintenance miles (miles driven for maintenance purposes) are not reimbursable. The state does not fund extracurricular transportation, such as day field trips and after‑school and weekend events.
Regarding transportation services, the federal Individuals with Disabilities Education Act (IDEA) requires a public school district to treat students with disabilities as it treats students in the general population. In addition, IDEA requires school districts to provide transportation to students who must travel to receive special education services. The transportation allotment is one of seven programs funded through the Tier 1 category of the Foundation School Program (FSP). In 2005, about 3 percent of the FSP state aid was expended on transportation services and remained about
the same for 2006. In 2007, approximately 2 percent of the FSP state aid, or $293.8 million, will be expended on transportation services.
The Texas Legislature sets transportation funding rules and rates by rider in the General Appropriations Act and the Texas Education Agency (TEA) administers the transportation program.
The LBB conducts School Reviews under the authority of Texas Government Code §322.016. In its role of reviewing school districts for management and performance efficiencies, the LBB staff identifies issues or commendable practices in 12 functional areas, including transportation services.
evolution of the transportation
funding program
Transportation funding was established to provide funding for efficient systems of school transportation in Texas. The linear density groupings, which determine the amount of funding that districts receive, have not changed since 1984, at which time according to TEA, the state provided 70 percent to 80 percent of total transportation costs.
The state transportation allotment is disbursed through the Foundation School Program (FSP). Chapter 41 districts, property wealthy districts, are not eligible to receive the transportation allotment. To receive state funding, all other Texas school districts must submit, via the web‑based FSP, two reports to TEA. The School Transportation Operations Report (TOR), due by December 1, establishes a cost‑per‑ mile for reimbursement in the fiscal year following the report. The School Transportation Route Services Report (RSR), due by July 1, includes information on ridership and mileage for regular, special, and career and technology programs. The data for both reports should be for the preceding school year, which is the basis for funding. Although Chapter 41 districts do not receive transportation funding, they are not exempt from reporting transportation data to TEA. According to TEA, the penalty for not reporting is loss of state funding. State funding for regular program transportation is limited to transportation for students living two or more miles from the school they attend. Districts with students living within two miles of the school they attend who would face hazardous walking conditions to school, such as the need to cross a
four‑lane roadway without a traffic signal or crossing guard, are reimbursed at a rate that may not exceed 10 percent of the total annual reimbursement for transporting only the two‑or‑more‑mile students. To receive hazardous conditions reimbursement, a school board must officially adopt a policy that defines hazardous traffic conditions that apply to the district. The board must also identify the specific hazardous areas for which mileage may be incurred and reimbursed. The board must submit this policy and any subsequent changes to TEA. A school district must use local funds to pay for transportation costs that the state reimbursement does not cover.
For regular education students, the state reimburses districts for qualifying transportation expenditures based on linear density, which is the ratio of the average number of regular education students transported daily to the number of miles traveled daily for those students. The Legislature established seven linear density groups and it allocates per‑mile reimbursements to school districts based on the district’s linear density grouping. Figure 1 shows the linear density groups, the allotment per mile, and the number and percentage of districts in each group, in 2004–05.
Twenty‑three percent of the districts are in the linear density group that receives only $0.68 per mile of approved route. Only 3 percent of the districts are in the linear density group that receives the maximum reimbursement rate of $1.43 per mile of approved route. There were an additional 41 districts that were eligible for funding that are not accounted for in any of the groupings because the districts’ cost per mile is less than the allocated amount in their linear density group. These districts receive the cost per mile as opposed to the linear density‑grouping rate.
For special education students, the state reimburses districts at a maximum mileage rate of $1.08 per mile as set by the Legislature. Under the private program reimbursement system, districts are allowed to reimburse parents or a commercial provider for transporting eligible special and regular education students at $0.25 per mile or at a maximum of $816 per eligible student rider annually. This practice is determined on an individual basis and is approved only in extreme hardship cases.
Although not addressed in the General Appropriations Act, TEC and TEA’s policy allows for reimbursement for CTE programs. TEC §42.155 (f) states that districts be reimbursed for CTE program transportation based on the number of actual miles traveled times the district’s official extracurricular travel per mile rate as set by the board of trustees and approved by TEA. However, according to TEA districts did not have an official extracurricular travel per mile rate and were not required to have one at the time this legislation was enacted. Thus, TEA established a procedure of using the prior year cost per mile from the TOR for regular education transportation to fund CTE transportation.
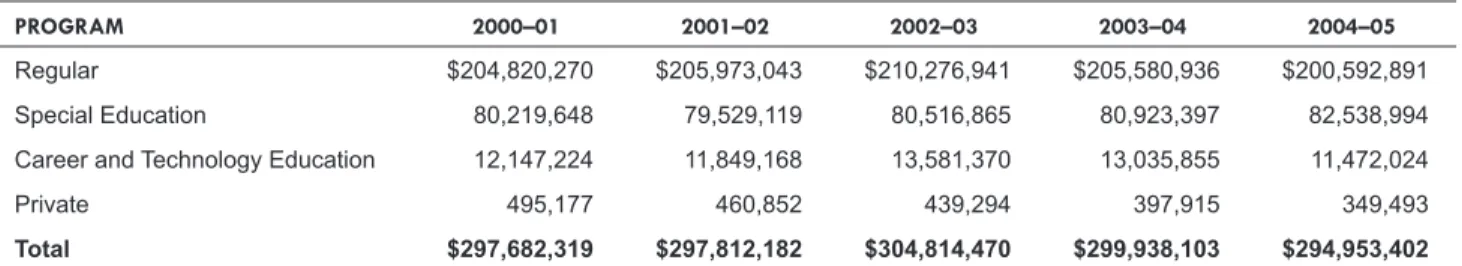
Figure 2 shows the allotment amount from school years 2000–01 to 2004–05 by transportation program. Regular program allotment represents the most, averaging about 69 percent of the annual funding over the five‑year period. Figure 3 shows the number of districts that reported mileage and received funding for the four transportation program areas and the hazardous conditions reimbursements in 2004–05. This figure shows that the regular and special education programs are the two largely used transportation programs.
figure 1
distriBution of districts BY linear densitY group 2004–05
linear densitY group of approved routeallotment per mile numBer of districts per group percentage of districts per group
2.40 and above $1.43 28 3% 1.65 to 2.40 $1.25 63 7% 1.15 to 1.65 $1.11 141 15% 0.90 to 1.15 $0.97 138 15% 0.65 to 0.90 $0.88 170 18% 0.40 to 0.65 $0.79 175 19% Up to 0.40 $0.68 219 23%
Note: The data in this figure excludes districts that were delinquent in reporting, charter schools, and county school entities.
Source: Legislative Budget Board; Texas Education Agency; School Transportation Allotment Handbook, May 2006; Route Services Report data, 2004–05.
What drives the transportation cost?
Transportation costs are reported to TEA in the following five general categories: salaries and benefits, purchased and contracted services, supplies and materials, annual depreciation/other operating expenses, and debt service. In the TOR instructions, TEA outlines the following for districts to include in each category when reporting transportation cost:• Salaries and Benefits: job‑related professional and non‑ professional employees.
• Purchased and Contracted Services: utilities, lease/rental of equipment, and public or commercial contracts for professional services. For example, when districts contract for transportation services all expenditures are reported in the purchased and contracted services category.
• Supplies and Materials: maintenance and operation of vehicles and facilities.
• Annual Depreciation/Other Operating Expenses: annual depreciation on purchase of fixed/capital assets (vehicles, facilities, and major equipment acquisitions), employee travel, registration and membership fees, subscriptions, insurance, and so forth.
• Debt Service: annual interest expense on loans and leases or lease‑purchases for student transportation related items.
Figure 4 shows the transportation expenditures statewide as reported in TEA’s FSP for school years 2000–01 to 2004–05. Overall, the salaries and benefits category accounts for the greatest expense to districts when providing transportation services. The 2000–01 to 2004–05 transportation actual expenditures data reveals the following information regarding overall district cost:
• Salaries and benefits account for the greatest expense representing about 62 percent to 66 percent of the total expenditures.
• Salaries and benefits have steadily increased with an overall 57 percent increase from 2000–01 to 2004–05. • Purchased and contracted services accounts for about 9 percent to 10 percent of the total transportation expenditures and experienced about a 28 percent increase from 2000–01 to 2004–05.
• Although accounting for only 10 percent to 14 percent of the transportation expenditures, supplies and materials experienced a 78 percent increase from 2000–01 to 2004–05.
In 2005, supplies and materials increased by $65.9 million from 2004, which is a 60 percent increase. During this time, the gasoline and other fuel cost that is included in this category increased from $53.3 million to $79.7 million (Figure 5) representing a 49.4 percent increase. Figure 5 shows the actual expenditures and the percentage change in the expenditure levels for gasoline and other fuels from 2001 to 2005.
figure 2
transportation allotment BY program 2000–01 to 2004–05
program 2000–01 2001–02 2002–03 2003–04 2004–05
Regular $204,820,270 $205,973,043 $210,276,941 $205,580,936 $200,592,891 Special Education 80,219,648 79,529,119 80,516,865 80,923,397 82,538,994 Career and Technology Education 12,147,224 11,849,168 13,581,370 13,035,855 11,472,024 Private 495,177 460,852 439,294 397,915 349,493
Total $297,682,319 $297,812,182 $304,814,470 $299,938,103 $294,953,402
Note: The allotment amounts represented in this table include all of the state transportation allotment for districts, charter schools, and county entities eligible to receive funding.
Source: Texas Education Agency, Division of State Funding, 2000–01 to 2004–05. figure 3
transportation allotment numBer of districts BY program 2004–05
program numBer of districts
Regular 977
Special Education 723
Career and Technology Education 206
Private 100
Hazardous 445
Despite increases of fuel expenditures in recent years, the salary and benefits category remains the most costly transportation expense for school districts.
district cost versus state allotment
Eligible districts receive state transportation aid for providing school transportation services; however, over the years state aid has become a smaller portion of the total cost for transportation services. The following cost and allotment data was extracted from TEA’s FSP excluding charter schools, districts that did not report data, and districts with only partial data for 2000–01 to 2004–05. Only district and county‑operated transportation programs eligible for state transportation aid are included in this data.Figure 6 shows the district cost compared to the state allotment from 2000–01 to 2004–05. In 2001, the allotment covered about 36 percent of the transportation cost to districts and has decreased annually, leading to only 23 percent of coverage in 2005. When examining the cost in
dollars, district operations statewide were $828.1 million in 2001, increasing to $1.2 billion in 2005. During this period, the state allotment was $294.4 million in 2001 and dropped to $286.6 million in 2005. There was a continued increase in district costs overall from year to year, but the state allotment decreased each year, except from 2002 to 2003—when it increased slightly from $293.9 million to $300.5 million. There is a difference in the state allotment received by districts as it relates to total “student count.” Total student count is defined in the annual TEA Snapshot report as the number of students in membership as of a set date in October of each year at any grade, from early childhood education through grade 12. Districts receive different levels of state funding, and on average, the funding varies according district size. Using the 2005 Snapshot total student count data and district cost and state allocation data, Figure 7 groups districts by total student count into nine categories showing the average cost/allotment coverage for each group. For districts with less than 1,000 students, the transportation allotment covered an average of 21 percent to 22 percent of district cost. The transportation allotment for districts with slightly larger total student count of 1,000 to 4,999 covered an average of 31 percent to 33 percent of the districts’ cost. Districts with a total student count of 50,000 and over average about 28 percent of cost to allocation coverage. Districts with a total student count of 5,000 to 9,999 average at a low of about 11 percent of cost to allocation coverage.
As previously mentioned, the state reimbursement originally covered approximately 70 percent to 80 percent of school transportation cost. However, in 2004–05, the state covered a maximum of 33 percent of district cost when grouped by total student count. In 2004–05, only 20 of the 977 districts figure 4
district transportation expenditures 2001–05 expenditure categorY 2000–01 2001–02 2002–03 2003–04 2004–05 percentage change 2001–05
Salaries and Benefits $519,272,731 $558,859,022 $611,151,446 $622,978,049 $812,959,337 56.6%
Purchased and
Contracted Services 86,576,782 92,891,002 98,860,548 101,043,654 111,203,372 28.4%
Supplies and Materials 98,583,611 87,275,624 98,788,946 109,780,213 175,757,502 78.3%
Depreciation/Other
Operating Expenses 118,354,330 124,834,614 97,743,593 105,707,131 123,371,445 4.2%
Debt Services 10,917,402 10,844,377 13,602,670 11,119,098 16,569,069 51.8%
Total $833,704,856 $874,704,639 $920,147,203 $950,628,145 $1,239,860,725 48.7%
Source: Legislative Budget Board; Texas Education Agency, School Transportation Operation Reports, 2000–01 to 2004–05.
figure 5
gasoline and other fuels
expenditures and percentage change 2001–05
Year actual expenditures percentage change
2001 $50,084,644 N/A
2002 $38,354,451 (23.4%) 2003 $48,097,784 25.4% 2004 $53,356,652 10.9% 2005 $79,712,921 49.4%
Source: Legislative Budget Board; Texas Education Agency, Public Education Information Management System (PEIMS), 2000–01 to 2004–05.
that received transportation allotments were able to fund 70 percent or more of their transportation cost.
previous legislative proposals
Recent Texas Legislatures have considered changes to the transportation allotment. The Seventy‑ninth Legislature, First called Session, 2005, considered a bill that would have allotted $1.50 per mile for each approved route mile for districts or county systems providing regular education transportation services. During the same session another bill would have eliminated the two bottom linear density groupings of up to 0.40 through 0.65 and moved them into the next linear density group of up to 0.90 (see Figure 1). The Seventy‑ninth Legislature, Regular Session, 2005, proposed a formula that would determine the districts’ transportation allotment, with the stipulation that the allotment could not exceed $1,000 per student in average daily attendance (ADA). The formula used the following components: the district’s number of students in ADA; the district’s number of square miles per student in ADA, computed by dividing the district’s square miles by the number of students in ADA( the district square miles); and figure 6
comparison of total district cost to state allotment 2000–01 to 2004–05 $294.4 $293.9 $300.5 $295.1 $286.6 $828.1 $869.3 $914.4 $944.2 $1,223.4 $0 $400 $800 $1,200 $1,600 2000-01 2001-02 2002-03 2003-04 2004-05 School Year $ Millions
State Allotment Total District Cost
Note: The data in this figure excludes districts that were delinquent in reporting and charter schools. Source: Texas Education Agency, School Transportation Operation Reports, 2000–01 to 2004–05.
figure 7
districts BY total student count
average percentage of total transportation cost covered BY state allotment
2004–05
total student count
percentage of total transportation cost covered BY state allotment Less than 500 22% 500 to 999 21% 1,000 to 1,599 33% 1,600 to 2,999 33% 3,000 to 4,999 31% 5,000 to 9,999 11% 10,000 to 24,999 26% 25,000 to 49,999 24% 50,000 and over 28%
Note: County schools entities, such as Dallas County Schools are not included in this analysis since they do not report total student count data.
Source: Legislative Budget Board; Texas Education Agency, Transportation Unit, 2004–05.
the district’s number of students in ADA (average district square miles).
The Seventy‑eighth Legislature, Fourth called Session, 2004, considered legislation proposing that the Commissioner of Education may award grants to school districts or county entities that operate a public school transportation system. The commissioner was to adopt the rules governing this program with priority given to districts and counties with the highest number of route miles per student, concentrating funding in districts and counties with higher‑than‑average transportation costs per student, and stipulating that the funds awarded were to be used in providing public school transportation services.
None of the legislation passed.
transportation funding
in other states
Funding school transportation services is a national issue and is a topic of discussion in many states. Recent research reveals that several states have studied or are studying their current systems of transportation funding to determine how to help relieve districts of some of the financial burden as the cost for services continue to rise. As in Texas, several states have not adjusted their transportation funding formula or changed their methods of allocation for some several years.
The superintendent of public instruction in the state of Washington issued a bulletin on April 7, 2006 informing the state’s school districts of an increase in their transportation operation allocation for 2005–06. In 2006, the Washington Legislature included additional funds in the allocation rate to cover the unusual increase in fuel cost that districts had experienced. In the study that the state of Washington conducted, data showed a nationwide cost for diesel fuel prices from 1996 through the first half of the year of 2005. From 2001 to 2005, this cost increased from $0.87 to $2.04 per gallon resulting in an increase of $1.17 per gallon. The Joint Legislative Audit and Review Committee (JLARC) in the state of Washington released a report on October 18, 2005 evaluating the extent to which the state pupil transportation funding formula reflects the cost of providing pupil transportation for basic education programs. The JLARC estimated that on a statewide basis there is a 95 percent probability that “to/from” pupil transportation— transportation between route stops and schools; schools under an inter‑district agreement; schools and learning centers for required education; and schools and agencies for
special education—expenditures exceeded state revenues. The report stated that 187 pupil transportation programs received less state funding than their statistically expected costs while 76 programs received more. The JLARC is expecting several bills to be filed for the 2007 regular legislative session regarding transportation funding. (See Appendix for 50-State Funding Method Summary from the JLARC study.)
In September 2006, the state of Arkansas recognized a need to address the funding formula for school transportation. The state Funding Formula Committee of the Academic Facilities Oversight Committee was tasked with examining what the state’s 245 school districts pay to transport students. The committee wanted to know what it is costing districts to provide transportation services considering the rising cost of fuel. According to a report conducted on public transportation adequacy, the committee considered several factors when constructing a transportation formula: miles driven, hours of operation, population density, bus capacities, total number of students transported, hazardous walking conditions, desegregation, and cost of bus replacement.
The LBB’s staff surveyed five states that are similar to Texas based on student enrollment data to show a comparison of how these states are funding transportation compared to Texas. Figure 8 shows the results of this survey. The enrollment, state contribution, and district cost data is for 2004–05, unless otherwise stated. Texas has the highest enrollment for 2004–05 and California has the lowest. New York has the highest state contribution at about $1.1 billion. Texas ranks lowest for state contribution at $286 million. The state with the highest district cost is New York at $2.1 billion. Regarding the percentage of district cost covered by the state contribution, Texas ranks the lowest at 23 percent. Illinois is the highest at 82 percent. Each state uses a formula uniquely designed to fit their transportation program. The common factors used to calculate reimbursements are average number of students transported and number of miles traveled. Of the states surveyed, none has a set rate as the linear density practice in Texas. The rates for the other states tend to vary from year‑to‑year based on factors used in the formula calculation. For example, New York funds a certain percentage of district cost based on a 0.06 percent to 90 percent rate, factoring into the formula the property wealth in the area.
Ohio is now updating their funding formula and indicated that increased district cost is what led to this action. Illinois has not changed their reimbursement formula since 1965.
Funding for special education transportation for the states surveyed is based on each state’s specific formula. In Ohio, the funding for special education transportation on an average covers approximately 50 percent of the cost. Illinois reimburses districts for 80 percent of allowable expenses. All other transportation reimbursements in these states, if provided, are also based on a formula.
Based on this data and information related to student transportation programs, other states are covering an average about 57 percent of district transportation cost using their funding formulas. Other states are now addressing their current methods of funding transportation because the cost of providing student transportation is increasing, especially the cost of fuel.
operating efficient sYstems
of school transportation
As important as it is that districts receive adequate funding to operate their transportation programs, it is also important that districts operate efficient systems of school transportation. The LBB School Reviews identify inefficient features of transportation programs and offer recommendations for improving efficiency and controlling transportation expenditures that can lead to savings for the district. By implementing these recommendations districts can improve efficiency and control transportation expenditures. School Reviews also report commendable practices identified in districts that are reviewed.
Analyzing the School Review transportation recommendations from 1994 to November 2006 and reviewing current literature and district operations, the following categories
have been selected to represent the most common transportation recommendations that lead to efficient systems of school transportation:
• Adopt a Bus Replacement Plan;
• Manage Transportation Department Staffing; • Establish Efficient Bus Routes and Schedules;
• Implement Regular Driver and Mechanic Training Programs;
• Establish and Implement a Vehicle Maintenance Plan; • Measure and Monitor Transportation Department
Performance;
• Follow State Reporting Requirements; and • Evaluate Transportation Privatization.
adopt a Bus replacement plan
While buses are a large capital investment for school districts, comprehensive replacement plans can offer many benefits to the districts. Findings from the LBB School Reviews show that districts that have replacement plans regularly introduce new buses into their fleets. The buses with the highest cost of maintenance can be replaced. A district can rotate the buses from the longest routes to the shortest in order to extend the life of the buses. A plan to phase in new buses and replace old ones can be based on anticipated growth and an analysis of the age and condition of the fleet. The replacement plan can be reevaluated annually to determine which buses should be sold depending on mileage and/or condition. Regular purchase of buses can prevent the necessity to acquire large figure 8
transportation funding in six states 2004–05 state enrollment*2004–05 state contriBution 2004–05 district cost 2004–05 percentage of district cost covered BY the state contriBution
are all districts eligiBle for
funding? funding method
California 925,564 $330,492,998 $1,180,361,965 28% No Formula Florida 1,115,917 $440,240,964 Not Available Not Available Yes Formula Ohio 1,130,483 $404,245,812 $620,605,250 65% Yes Formula Illinois 2,093,330 $578,730,000 $701,666,400 82% No Formula New York 2,848,733 $1,084,003,581 $2,140,902,217 51% Yes Formula
Texas 3,938,946 $286,571,175 $1,223,354,305 23% No Formula
*California reported the total number of students listed who rode the bus for 2004–05, not the total student enrollment. Source: Legislative Budget Board.
numbers of buses in any one year. This practice allows a district to retire buses on a planned basis and expand the fleet to meet student growth demands.
Districts design bus replacement plans to maintain the necessary fleet size and to reduce bus hazards by replacing buses once they reach the end of their life cycle. For a bus replacement plan to be effective, it must be followed, and funds must be dedicated to support it. By adopting the bus replacement plan as district policy, the district can support maintaining an adequate and up‑to‑date fleet without unduly straining the budget in any one year.
With a known replacement and expansion cycle, districts can develop programs to ensure that buses wear evenly throughout the fleet; these programs can be achieved in a variety of ways. Some districts develop mileage targets for regular and special education buses as a tool to assign buses so they accumulate mileage evenly among them. Other districts rotate buses, using mileage targets to identify the route combinations that most evenly accrue mileage.
Bus replacement plans also allow districts to have spare buses for use to replace vehicles that are temporarily out of service for maintenance or repairs. Best practices show that the number of spare buses should represent about 10 percent of the fleet at peak bus usage. One of the problems many districts face with providing extracurricular trips during the morning and afternoon peak hours is that the trips take resources away from regular routes. The extra buses provide additional resources for the district to operate peak hour extracurricular trips without interfering with regular routes.
Districts that have replacement plans equalize the amount of capital funds required in the annual budget for purchasing school buses by distributing the replacement costs over several budget years. Replacement plans are important to ensuring efficient and effective transportation operations. The National Association of State Directors of Pupil Transportation Services (NASDPTS) released a report on school bus replacement schedules in January 2002 that suggests that under normal operating conditions, the anticipated lifespan of a bus is 12 to 15 years. Although several factors should be considered when developing and implementing a school bus replacement schedule, NASDPTS stated in its report that the timely replacement of school buses must be a planned process.
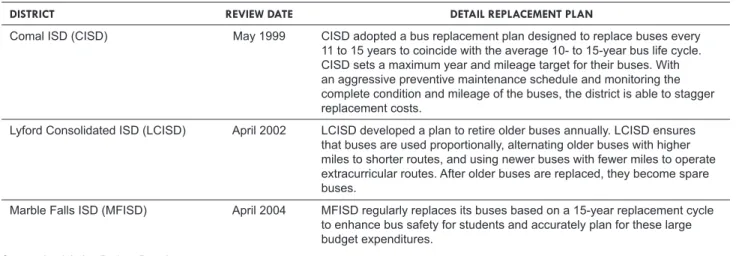
Figure 9 shows examples of districts that have developed bus replacement plans and a description of their processes. As the method for developing and implementing a bus replacement plan varies from district to district, districts should ultimately seek to provide safe and mechanically sound buses in the most efficient way feasible for the district.
Manage TransporTaTion DeparTMenT sTaffing With salaries and benefits representing 62 percent to 66 percent of districts’ transportation budgets, adequate management and appropriate staffing of transportation departments is critical. Staff management can be applied throughout the transportation department by eliminating or creating positions, controlling overtime hours, improving
figure 9
examples of districts’ Bus replacement plans
district revieW date detail replacement plan
Comal ISD (CISD) May 1999 CISD adopted a bus replacement plan designed to replace buses every 11 to 15 years to coincide with the average 10- to 15-year bus life cycle. CISD sets a maximum year and mileage target for their buses. With an aggressive preventive maintenance schedule and monitoring the complete condition and mileage of the buses, the district is able to stagger replacement costs.
Lyford Consolidated ISD (LCISD) April 2002 LCISD developed a plan to retire older buses annually. LCISD ensures that buses are used proportionally, alternating older buses with higher miles to shorter routes, and using newer buses with fewer miles to operate extracurricular routes. After older buses are replaced, they become spare buses.
Marble Falls ISD (MFISD) April 2004 MFISD regularly replaces its buses based on a 15-year replacement cycle to enhance bus safety for students and accurately plan for these large budget expenditures.
driver recruitment and retention, reallocating duties, and reorganizing the department. School Review recommendations suggest that these changes can help districts to operate efficient transportation programs and, in some cases, save money.
Findings from the LBB School Reviews show that when districts do not properly staff, the department is at risk of overstaffing/understaffing and misusing resources that could be directed to instructional purposes. In some districts, simply eliminating or creating positions seem to be the answer to properly staffing the department. Districts can evaluate their staffing needs to know how many bus drivers, mechanics, and other staff the transportation department requires. One way to accomplish this evaluation is by applying an industry staffing formula, when applicable. School Reviews recommended staffing formulas for bus drivers and mechanics. Although there is no set industry standard for staffing school bus drivers, some School Reviews referenced the recommendation from the Transit Cooperative Research Program 1999 publication, Management Toolkit for Rural and Small Urban Transportation Systems. This report recommends 10 percent extra drivers as “cover” drivers in the public transit system. When applying this standard to school bus drivers, this standard allows for one driver per route, plus an appropriate margin (10 percent) of extra drivers to cover for absent drivers and field trips. When applying mechanic‑ staffing standards, School Reviews used recommendations from associations such as the Texas Association of School Business Officials (TASBO) and the Texas Association for Pupil Transportation (TAPT), which provide training to districts on best practices through their “Effective and Efficient T ransportation” class. This class provides guidelines regarding the appropriate number of mechanics a district needs, based on the type and age of the fleet. As a guideline, one mechanic is required for every 22.5 buses or 45 maintenance vehicles.
Findings from the School Reviews also show that some districts are spending unnecessary amounts of overtime pay due to inappropriate staffing. When districts schedule bus drivers for overtime or allow them to work overtime hours continually, districts accumulate excessive payroll expenditures that proper staffing could reduce. Routinely guaranteeing overtime increases district expenditures. Districts that manage overtime hours reserve this expense for emergency or exceptional duty work. These districts implement procedures to minimize costs, such as sharing field trip assignments among all drivers, assigning extra duties to employees with
the lowest number of hours during the specific period, and paying hourly rather than a full‑time guaranteed rate of pay. A large part of managing district transportation staff is recruitment and retention of drivers. Hiring drivers for part‑ time, split shift, and seasonal employment can lead to high staff turnover levels. This approach puts a strain on the district, especially since drivers are difficult to find and retain. Districts that do not have an adequate system for recruiting drivers, including substitutes, experience a driver shortage, which results in other district staff spending time ensuring that there is a driver for every route, taking away from their regular job duties.
Many districts offer incentives to help attract new drivers and retain existing drivers. Incentives include such things as paying for a new driver’s Commercial Driver’s License (CDL), providing a sign‑on bonus for new employees, or offering a bonus to existing drivers who recruit new drivers. Recruitment strategies can also include announcements in neighborhood newspapers, flyers at grocery stores and retirement communities, contacts with public agencies involved in the Welfare‑to‑Work initiatives, and the use of advertising decals on the sides of the buses.
The LBB School Review of Fort Worth ISD, May 2001, describes how the transportation department formed a recruiting team, led by a district safety officer and staffed by drivers, to recruit new drivers. This team visits the Texas Workforce Commission offices, job fairs and other locations actively recruiting new drivers. This process along with the district’s human resources department expediting the steps to test and hire a new driver resulted in the district having fewer vacant positions during the year—than during previous years.
An Arizona school district implemented an incentive program to recruit school bus drivers, which offers existing employees a cash incentive for referring a driver that a district hires. The existing employee receives a $100 recruitment incentive upon the referred bus driver’s 30-day anniversary date. If the referred bus driver works continuously as a bus driver for one calendar year, the referring employee receives an additional $200 recruitment incentive upon the one-year anniversary date.
Findings in School Reviews show that realigning district transportation department’s organizational structure and reallocating duties also may lead to operational efficiencies. When districts assign the responsibilities of managing and administering all student transportation and vehicle
maintenance activities to one person, some of the duties are not completed or being done effectively. Some districts may need a transportation director with a maintenance supervisor and a transportation services supervisor to accomplish all of the responsibilities of the department effectively. For example, many school districts in the nation employ route supervisors with the following responsibilities:
• evaluating and rating drivers; • observing driver performance;
• correcting improper performance or deficiencies; • ensuring driver adherence to maintenance schedules
and reporting requirements;
• designing or redesigning bus routes and schedules; • monitoring operations and ensure that bus routes are
covered; and
• assisting at the scene of school bus accidents and help prepare accident reports.
Having a district route supervisor frees the transportation director to concentrate on functions such as documenting procedures, developing an employee handbook, monitoring and controlling cost, monitoring performance, and submitting timely transportation reports.
Although there is no single solution to managing the transportation staff, applying one or more of these staff management recommendations can assist districts in operating an efficient transportation program by ensuring that adequate and appropriate staff are in place.
esTablish efficienT bus rouTes anD scheDules Bus routes affect the overall spending for transportation operations in a district as they lead to the creation of driver positions, staff levels for vehicle maintenance, new bus purchases, and other office staff. Each year, districts make changes to their bus routes and schedules as students transition from school to school. To best accommodate these changes, findings in School Reviews show that an analysis of district bus routes and of the number of student riders per bus assist districts in maximizing efficiencies in transportation operations.
There are several aspects to consider when coordinating transportation services for regular education, special education, CTE, and extracurricular activities. One is the state reimbursement that some districts receive for
transporting regular education students. This reimbursement is determined through the linear density system (see Figure 1). Inefficient routes can reduce a district’s reimbursement since the TEA uses this system to allocate state reimbursements on a per mile basis. To increase linear density, a district must reduce its route mileage and/or increase the number of student riders. Other aspects to consider are the number of students to be transported, their places of residence, and the number of schools to be served. Districts must also consider the number of buses and drivers available to run the various routes. All of this information assists districts in planning efficient and cost effective bus routes.
Several district practices can lead to inefficient bus routes. The lack of professional staff to plan the routes results in more routes scheduled than necessary. For example the LBB School Review of Zapata ISD, May 2005, describes how the district allowed the drivers to write their own routes without having training in routing efficiency. Individualized bus stops or “door‑to‑door” is another practice leading to inefficient bus routes. With this practice, buses stop as many times as there are students riding it. Buses travel on more streets to stop in front of each student’s home. This type of routing pattern adds additional time to every bus route due to the constant stopping and starting at each residence creating a long riding time for some students.
To achieve efficient routes and scheduling, School Reviews recommend that districts periodically analyze and review their routes and make necessary changes, including purchasing or using existing routing and scheduling software to plan routes, and/or creating staggered bell schedules to improve district routes.
Districts can conduct an in‑house route analysis and review or contract with an outside entity. Some districts find that they can reduce the costs of performing a systematic review of their routes by using outside agencies such as other districts or local governments to perform the routing analysis using their software and skills. For example, the Round Rock ISD (RRISD) Transportation Department has leveraged its software and staff expertise in routing analysis to perform routing and scheduling for 25 districts in Texas. The department charges $100 per bus for the service. The RRISD Transportation director said he typically finds 5 percent savings in any district that he provides routing and scheduling services. In one study, the routing analysis identified routes that would reduce the number of regular buses from 24 to 16, a 33 percent reduction.
In some districts, conducting a route analysis and review may be sufficient; however, in other districts, the use of in‑house routing software is necessary. Districts without transportation routing software often spend much time manually scheduling bus routes for their students and storing information in spreadsheets or word processing documents. The problem with this method is that with increasing enrollment and routes, the data may become difficult to find and manipulate. Routing software can reduce labor‑hours spent planning and can automate the transportation department by decreasing the complexity of storing information among various sources. Routing and scheduling software containing all transportation data can enable districts to become more efficient in their day‑to‑day operations.
Districts that use an automated bus routing and scheduling software system have been successful in saving the district funds by reducing the number of bus routes required to serve the students, which reduces the number of required drivers, buses, and mechanics. Implementing this type of system also helps districts design more efficient bus routes that can increase the linear density and maximize state transportation funding. The systems are available through various vendors and are capable of housing all of the data necessary to plan bus routes effectively and efficiently.
Automated bus routing and scheduling software systems can allow districts to:
• Manage bus routes, students and drivers; • Create and review “what/if” scenarios; • Run reports;
• Visualize stops/routes and students; • Manage redistricting issues; and
• Design routes with an integrated mapping system. These systems are usually easy to use, configure, and maintain. Many systems can be integrated with other district systems and customized to the needs of each district.
Several districts have successfully implemented automated routing systems. In 2003–04, Alvin ISD began using an automated routing system that enabled the district to combine routes and eliminate approximately 5 percent of the routes, and the district anticipates realizing additional efficiencies in future school years. Brownsville ISD (BISD) increased the efficiency of the district’s transportation operation by automating the special education component of
the department’s route scheduling. Since the summer of 2000, Killeen ISD has used an automated system and has saved hours of administrative time. With the previous manual system, district staff had to estimate the number of eligible students at a given stop, distribute paper copies to schools, and answer numerous calls and complaints from parents and district personnel. School and parent phone calls have dropped by about 50 percent to 60 percent since the implementation of the system. Killeen ISD added a component to the program that allows parents and guardians to type in their addresses and then view a map that shows bus stops near their location. The district reported that this system is faster, less costly, and more efficient than the previous manual system.
Some districts create staggered bell systems to maximize the use of its buses and reduce operating cost. The LBB School Review of San Elizario ISD (SEISD), May 2006, describes how the district operated 19 regular routes and 3 special program routes daily. By implementing a staggered bell schedule, 16 of the 19 routes were on a two‑bell schedule, and one bus made two trips to one elementary school. By enabling buses to run multiple routes, SEISD can serve additional schools, which reduces the cost of transportation by reducing the number of separate routes and drivers. Since the efficiency of routes determines how many bus routes are necessary, and therefore how many buses and drivers are necessary, route efficiency is critical to improved cost‑effectiveness.
iMpleMenT regular Driver anD Mechanic Training prograMs
A March 2000 study from the National Association of State Directors of Pupil Transportation Services (NASDPTS), reports school buses to be the safest vehicles on the road. This study further states that a modern, safe, well‑maintained school bus cannot compensate for an ill‑trained school bus driver. Likewise, highly trained school bus drivers cannot provide the safest possible transportation to students with out‑of‑date, poorly maintained school buses. While the construction and safety equipment of school buses is critical to providing safety to school bus occupants when a crash occurs, it is the school bus driver who often prevents incidents and crashes each school day along with the maintenance staff that provides the regular upkeep and maintenance of the buses. Obtaining a high level of school bus safety requires districts to implement regular driver and mechanic training programs.
Findings in the LBB School Reviews show that districts that provide regular driver training provide it in separate areas such as special education confidentiality, crisis prevention techniques, driving safety, student/pedestrian safety, and effective and efficient operations. Some districts also provide monthly safety training classes on a variety of topics. As part of districts’ training components, some districts have implemented a driver evaluation program. Such programs include the districts’ transportation director or a driver‑ trainer riding on the bus with each driver once during the year to evaluate the driver’s performance. In most cases, the drivers are unaware when the evaluation will occur. The evaluation can include the pre‑trip inspections and the operation of the route, including discipline management. An evaluation program can provide the driver with praise and recommendations for improvement.
Districts have access to driver training programs through various associations or universities. For example, Texas A&M University and the Texas Association of Pupil Transportation (TAPT) provide a six‑day intensive, hands‑on bus driver training program entitled “Train‑the‑Trainer” several times a year. The classes include speed control, following distances, stopping for loading and unloading students, bus control in inclement weather, bus evacuation drills, making turns, and determining proper turning points.
According to the Pupil Transportation Safety Institute (PTSI) several years ago, the main requirements for being a school bus mechanic were basic mechanical skills and the willingness to work hard. Today, with constant technological innovations from manufacturers (computerized drive trains, emission controls, etc.), ongoing professional development is an absolute necessity for school bus mechanics. According to PTSI, the responsibilities of a school bus mechanic range from handling breakdowns and making repairs, scheduling and documenting preventive maintenance, parts purchase and inventory control, prompt attendance to voluntary or mandatory vehicle or equipment recalls to compliance with a wide range of Occupational Safety and Health Administration and environmental regulations. In some small districts, a single mechanic could be responsible for every aspect of the maintenance program.
The LBB School Reviews recognize the importance of districts employing well‑trained mechanics and recommend, as part of the mechanic‑training program, that districts have their mechanics certified. The most common mechanic certification is through the National Institute for Automotive Service Excellence (ASE). Findings in School Reviews show
that certified mechanics provide more accurate fault diagnosis, which allows more items to be repaired correctly the first time. The ASE offers a series of tests for a variety of vehicles and systems, including automobile, heavy truck, electronics, and other fields. One field of study is for school buses. Seven certifications are offered: 1) body systems and special equipment; 2) diesel engines; 3) drive train; 4) brakes; 5) suspension and steering; 6) electrical/electronic systems; and 7) air conditioning systems and controls. ASE certifications along with ongoing in‑house training will allow district mechanics to provide a higher level of efficiency and effectiveness when maintaining district buses.
To encourage ASE certification, some districts have implemented an incentive program. For example, Clear Creek ISD offers an increase in hourly pay for mechanics that receive certification. For each certification, up to three, the mechanic receives an increase in pay of $0.15 per hour, or $312 per year per certification.
Overall, training is critical to the safety of any transportation program. Districts that concentrate efforts to ensure that their drivers and mechanics are adequately trained will contribute to operating an efficient transportation system. esTablish anD iMpleMenT a
vehicle MainTenance plan
A comprehensive vehicle maintenance plan is essential to ensure bus fleet longevity. Vehicle maintenance plans keep track of vehicle maintenance by bus and type of service, enabling districts to establish service schedules and identify trends and specific types of problems that can be addressed to prevent major repairs. Comprehensive vehicle maintenance plans can include a preventive maintenance schedule and a systematic method for tracking each vehicle’s ongoing maintenance needs and condition. The goal of a vehicle maintenance plan is to keep buses in a safe and reliable condition at all times. Findings in the LBB School Reviews show that some districts lack comprehensive vehicle maintenance plans, which could lead to severe mechanical problems thereby compromising student safety.
To establish a preventive maintenance schedule, districts must maintain complete maintenance records on each vehicle. Maintenance records could include all services performed (including the date of service requested and completed), all parts used for repairs, mechanic time, and labor costs. By keeping up‑to‑date maintenance records, district maintenance staff can adequately schedule preventive maintenance.
When districts lack a preventive maintenance plan, routine repairs are not addressed. Examples include missing or poorly repaired seats, accident‑damaged buses, rotting bus floors, and pools of fluid leaking under parked buses. These and other maintenance issues could lead to mechanical breakdowns and possible student injuries.
The Michigan Department of Education’s Pupil Transportation Advisory Committee considers, as best practice, that proper and systemic school bus maintenance programs should consist of, but not be limited to, the following components:
• Knowledgeable Repair Staff: Highly trained, knowledgeable, and certified mechanics and/or vehicle repair staff including appropriate staffing levels. • Safety Inspections: An “in‑house” school bus safety
inspection program at a minimum of 36 school‑day intervals with prompt deficiency repair.
• Preventive Maintenance: A lube, oil, and filter service level consistent with the manufacturer recommendations.
• Driver Daily Trip Inspection: A daily driver pre‑ and post‑trip vehicle inspection program with maintenance write‑ups when needed.
• Special Projects: A special projects program to address planned service projects and correct detected deficiencies.
• Maintenance Records System: A vehicle maintenance records system permitting the ready access to each vehicle’s maintenance information and a system that tracks maintenance costs by year of ownership for the vehicle’s entire school district service life.
Districts can accomplish this by having a manual or automated system of tracking. A manual system could consist of a written format that indicates every area of a bus to be inspected and an item‑by‑item sign‑off by the mechanic performing the inspection. This system can be effective with small bus fleets; but when managing a large bus fleet, districts may consider purchasing an automated vehicle maintenance system. Such systems allow districts to schedule preventive maintenance by automatically generating work orders; schedule by time, mileage, hour meter or both meter and time; schedule by days, monthly, quarterly or annually; easily access state of the fleet maintenance; maintain precise records of a vehicle’s upkeep; generate reports; and more.
The LBB School Review of Fort Bend ISD, August 2000, describes the district’s use of an automated online tracking system for vehicle maintenance and pre‑maintenance work. Staff logon and receive work assignments from a pre‑trip log maintained on each vehicle. The process provides a systematic review of work to be performed or that has been performed on a vehicle since the date of purchase. This system has led to increased efficiency in the district’s transportation department.
The School Review of Austin ISD, April 2000, describes the district’s use of automated vehicle maintenance software to ensure that preventive maintenance is performed on the buses as required by mileage standards. A vehicle’s mileage is recorded each time a work order is entered into the system and whenever the vehicle is fueled.
The decision to use a manual or automated vehicle maintenance system is up to each district; however, when establishing and implementing a vehicle maintenance system, districts’ focus should be to have safe and reliable buses that can contribute to the ultimate goal of student safety. Measure anD MoniTor TransporTaTion DeparTMenT perforMance
Many districts use performance indicators to assess ongoing performance in key management areas. Performance indicators allow transportation departments to track service quality and make adjustments where required. Transportation administrators document improvements in performance to demonstrate progress. Accurate and timely performance indicators help management allocate available funds to the most critical needs. They also provide assurances to the district’s board of trustees and the public that the department providing transportation is using its resources in the best possible manner.
Findings in the LBB School Reviews show that when districts do not establish performance indicators, they cannot gauge performance and identify areas of improvement related to routing and scheduling, staffing levels, maintenance performance, and safety. Without a performance measurement system, district administrators have limited meaningful data available to make informed budgeting and staffing decisions.
Key elements of a performance measurement system include measurable goals and objectives, performance indicators or measures used to gauge performance, and benchmarks or standards against which performance will be assessed.
Performance measures include both short‑term internal measures to evaluate day‑to‑day transportation operations, such as driver absentee rates, and long‑term measures for major aspects of the transportation department, such as the operating cost per rider, age of the bus fleet, and on‑time performance of buses. Performance measures determine how well the district is progressing toward reaching its goal to provide student transportation services that meet or exceed local, state, and national standards in all areas. Figure 10 shows examples of performance measures for student transportation.
Round Rock ISD (RRISD) uses performance measures to determine how well the district is progressing toward reaching its goal to provide student transportation services that meet or exceed local, state, national, and international standards in all areas. RRISD displays performance data on the district’s web site in the format of a “report card” to show how the transportation function is performing.
Establishing, tracking, and monitoring the performance of district transportation services will contribute to safe, efficient, and effective operations.
follow sTaTe reporTing requireMenTs
To receive state transportation funding, eligible districts submit the following two reports to TEA: the School Transportation Operations Report (TOR) due annually for the preceding school year by December 1, which is designed to establish a cost‑per‑mile to be used for reimbursement in the fiscal year following the report; and the School Route Services Report (RSR) due annually by July 1, which includes information on ridership and mileage for regular, special, and CTE programs. Accurate and timely completion and submission of these reports are important to district transportation operations. Findings in the LBB School Reviews show that some districts are not following state‑ defined requirements for collecting, computing, and reporting transportation reimbursement information. The data required by TEA for the two reports includes student ridership—a count of the eligible students riding the bus, mileage data, student transportation expenditures, vehicle inventory information, and miscellaneous information. The lack of data collection formats and collection processes that comply with TEA requirements increases the risk that districts may collect and report inaccurate ridership and, mileage information. Because accurate information is necessary to validate a district’s claim for state funding reimbursement, information that is incorrect or unsubstantiated increases the district’s risk of receiving more or less funding than it should. When districts receive an excess in funding due to misreporting of information, they may have to reimburse the excess to TEA.
A common error districts make in reporting student transportation data relates to hazardous routes and mileage. The TEA Handbook on School Transportation Allotments (“Handbook”) defines a student eligible for transportation as residing two or more miles from the student’s assigned campus or as legally residing in a designated hazardous area within two miles of the student’s assigned campus, as determined by the district’s board of trustees. TEC §42.155(d) allows districts to provide to the commissioner of Education the definition of hazardous conditions applicable to the district and to identify specific hazardous areas. Although this allows the district to define the term “hazardous,” TEA guidelines suggest areas having few or no sidewalks, busy roadways, or railroad tracks qualify as hazardous. Route mileage reports to TEA must identify hazardous miles separately from regular route mileage. Districts must submit a copy of the approved board policy designating the hazardous conditions area and any subsequent changes.
figure 10
transportation performance indicators
performance indicator
Safety
Accidents or incidents per 100,000 miles Student referrals per 1,000 students bused Annual hours of training for each driver
Cost–Efficiency
Operations cost per mile – Regular Operations cost per mile – Special
Cost–Effectiveness
Operations cost per rider – Regular Operations cost per rider – Special
Service Effectiveness
Route riders per mile – Regular Route riders per mile – Special Route riders per bus – Regular Route riders per bus – Special
Service Quality
On–time performance Maximum rider trip time Complaints per 100,000 miles
Maintenance Performance
Miles between road calls or breakdowns
Percent preventive maintenance completed on time Turnover time per bus repair
Districts that follow the Handbook’s requirements use route sheets that contain a route identification number with turn‑ by‑turn description and mileage of the route. These districts also collect student ridership information on the first Wednesday of the month as required by the Handbook. This information includes the student’s name, grade level, whether the count was performed in the morning or afternoon, and whether the student is designated as a regular program rider or a rider within a hazardous area.
Establishing management oversight and following TEA’s guidelines for reporting student transportation information helps districts report more accurate data and ensures that the districts receive the appropriate funding for transporting students.
evaluaTe TransporTaTion privaTizaTion
Management and oversight of a district’s transportation operation is critical regardless of whether the function is performed by the district or is outsourced to a transportation provider. Research shows that nationwide between 30 percent and 40 percent of school districts use private contractors to provide all or some of the district’s transportation services. In 2005, the National School Transportation Association (NSTA) reported that several districts have had success contracting and recommend all districts evaluate the option. The NSTA agrees that privatization will not benefit all districts, but comparisons should be made to determine if a private contractor could provide better and/or cheaper service than the district. Districts choose to privatize for many reasons, but primarily to save money. According to TEA, about 2 percent to 3 percent of Texas districts outsource their transportation services to private contractors.
The LBB School Review recommendations are consistent with NSTA emphasizing that districts evaluate the option of privatization. School Reviews also recommend that continued oversight of the transportation contract should occur if the function is privatized to continually ensure the district is providing efficient and effective transportation services. When evaluating privatization, districts should consider both the advantages and disadvantages of this service. Some advantages for privatizing can include:
• A contract incentive clause for increasing efficiency. • A contract requirement to implement an appropriate
cost accounting system to monitor efficiency and cost effectiveness and to better monitor and control costs.
• A broad range of experience dealing with the challenges of providing student transportation at numerous school districts. This experience may allow a contractor to solve district student transportation problems more quickly and effectively.
• A contract performance clause to ensure improved services. For example, the private contractor can be required to meet a standard for on‑time performance. • District administrators can refocus attention on core
educational duties.
• If the contractor provides school buses, the district no longer has to pay to replace old buses in its fleet. Some of the disadvantages may include:
• The district may have less control of day‑to‑day operations and procedures if transportation services are outsourced.
• If the contractor provides the district with school buses, the cost of providing vehicles will be amortized as operations costs over the term of the contract. The annual fiscal impact of the vehicles will vary by the length of the contract and the required average age of the school bus fleet.
• If competition is not adequate, the contractor’s price may not reflect the cost savings targeted by the district. • A contractor may under‑price a bid to receive the contract and then attempt to raise prices after the contract is awarded.
• If the contract terms are not complete (for example, do not address all the services the district will need during the length of the contract), the cost of additional services can result in higher than expected student transportation expenditures.
• Student transportation services could be in jeopardy if the contractor defaults or if there are contract disputes. • Existing district employees may feel uneasy about the
transition to a new employer.
To evaluate the feasibility of reducing student transportation costs and improving service quality by contracting with a private company, districts should take each of the following steps: determine the full cost of student transportation, prepare comprehensive contract specifications, include incentives for performance, determine employee status,
evaluate options to own or contract for school buses, require the contractor to provide a complete transition plan, decide the contract terms, develop a comprehensive contract with performance measures as set forth in Figure 11 and then monitor the contract.
When determining the full cost of transportation, it is important for districts to identify the direct and indirect or hidden cost. The indirect or hidden cost might include payroll taxes, clerical and support services, utilities, legal fees, fuel tank testing and repair, and others.
Outsourcing district transportation services is a viable option, but the decision must be carefully evaluated to ensure that all of the district’s needs are fully met. Districts must realize that although the services for transportation may be outsourced, it is still the district’s responsibility to provide safe, efficient, and cost‑effective services.
figure 11
suggested performance measures for outsourced student transportation
categorY performance measures
Productivity Student riders per mile Student riders per bus Linear density
Cost Cost per route Cost per mile Cost per student rider Percent state reimbursement
Safety Accidents every 100,000 miles of service Student incidents every 1,000 students transported
Training curriculum for new drivers Hours of in-service training for each driver
Personnel Number of driver positions vacant Absentee rate for drivers Number of available relief drivers Starting wage rate
Percent overtime
Customer
Satisfaction Annual user survey of parents and school administrators Referrals per route
Response time per referral
Vehicle
Maintenance Percent of preventive maintenance inspections completed on time Miles between in-service breakdowns
Cost per bus for maintenance labor, parts and fuel
Number of certified mechanics