Dollars and Sense:
Examining the Impact of the Federal Earned Income Tax Credit in San Diego County
Vince Vasquez
Senior Policy Analyst
July 2010
Key Findings The federal earned income tax credit (EITC) rewards work and helps more than 177,000 San Diego County residents stay out of poverty each year. The annual direct spending of EITC refunds in San Diego County is more than three times greater than the direct economic impact of Comic‐Con. Though more than $314.8 million in EITC payments is received by county workers each year, approximately 1 out of 4 EITC‐eligible taxpayers fail to claim the EITC, forfeiting more than $78.7 million annually. Regional efforts to educate San Diegans about the EITC and assist low‐income workers with free tax filing are successful overall, but can be improved to increase the number of tax credit claims and close the “EITC collection gap.” Recommendations The City of San Diego, San Diego County and other municipal governments should all consider passing an honorary EITC Awareness Day each year, to help promote the federal program and boost local EITC outreach. Government access television channels such as CityTV should be utilized during the tax season to educate residents about the EITC and inform them of free tax filing assistance centers. Local Spanish‐speaking celebrities and community leaders should be recruited to participate in EITC public service announcements and promotional events, to increase EITC claims from Latino and Spanish‐speaking workers. Local EITC outreach advocates should consider encouraging private employers to print educational EITC materials in Spanish and Tagalog and distribute them along with IRS W‐2 forms.
Executive Summary The earned income tax credit (EITC), a federal refundable credit, helps more than 177,000 San Diego County residents stay out of poverty each year but more can be done locally to improve public outreach to working families in our difficult economic times. Previous research has shown that EITC dollars are largely spent in local economies, creating jobs and advancing work mobility for low‐income Americans. However an estimated 25% of EITC‐eligible taxpayers fail to claim the credit each year. San Diego County working families are missing out on more than $78.7 million, particularly residents in our South Bay communities. This policy brief, we also provide disaggregated city‐by‐city data on the more than $314.8 million in refunds claimed by taxpayers in San Diego County in 2006.1 With refunds worth up to $5,600 for low income individuals and their families, the EITC also serves as an economic stimulus for municipal governments, generating tax revenue and employment opportunities.
The annual direct spending of EITC refunds in San Diego County is more than three times greater than the direct economic impact of Comic‐Con.
What is the EITC?
Enacted into law by Congress in 1975, the federal earned income tax credit assists the economic prospects of low‐ and moderate‐income workers by reducing their tax burden, and in many cases supplementing their earned income with a tax refund in excess of their tax liability. To be eligible for the earned income tax credit, workers must be U.S citizens or legal residents, have a valid Social Security number, and must have earned income in the current tax year. Refund amounts are based on the filing status of the taxpayer (single, jointly filing as married, etc.), the number of their qualifying dependents, and their gross income level. For Tax Years 2009 and 2010, the cap on EITC refund allotments has been temporarily raised, as part of an effort to provide economic relief through the American Recovery and Reinvestment Act (ARRA). The maximum refund for single, head of household or qualifying widow(er) with no children is $457; for those with one qualifying child, $3,043; for those with two qualifying children, the maximum is $5,028; and for three or more children, the maximum is $5,657. The program 1 The 2006 tax year is the most current year available that the IRS has provided local tax return data.
is concentrated towards assisting those workers making less than $20,000 a year with three or more children.
Figure
One:
Tax
Year
2009
EITC
Refunds
for
Tax
Filers
That
File
as
Single,
Widowed,
or
Head
of
Household
Source: Internal Revenue Service 80% of EITC receipts are estimated to be spent in a local economy.2 Evidence also suggests that a significant number of EITC claimants directly use refunds to stay in the workforce. A 2008 economic analysis of how EITC refunds are spent found that the tax credit has a marked effect on increasing spending for durable “big ticket items,” particularly automobiles.3 Analyzing ten years of reports from 2 The University of Baltimore’s Jacob France Institute published a study in 2004 entitled “The Importance of the Earned Income Tax Credit and its Economic Effects in Baltimore City” which assumed that two‐thirds of EITC payments made to residents were re‐spent in Baltimore. A 2006 study from Vanderbilt University entitled “The State of the Earned Income Tax Credit in Nashville” assumed that 87% of EITC payments would be spent within the region. 3 Andrew Goodman‐Bacon and Leslie McGranahan. “How do EITC recipients spend their refunds?” Federal Reserve
the U.S. Bureau of Labor Statistics’ Consumer Expenditures Survey, researchers found that recipients are much more likely to purchase a vehicle shortly after receiving EITC refunds. Since an estimated 88% of low‐income households commute to work with personal vehicles, the ETIC refund can be critical in keeping low income recipients in the workforce. Additionally, EITC eligible families increase spending on other durable goods such as trips and food, and transportation expenses (vehicle repairs) are the largest source of nondurable expenditures after receipt of EITC refunds.
How EITC Refunds are Used
In 2008 more than 23 million taxpayers received an EITC refund worth an estimated $49.3 billion. Most recipients were urban dwellers (81.3%), had two or more qualifying children (42%), and filed as heads of their household (52%). EITC payments raised an estimated five million Americans above the federal poverty line. At the state level, 2.5 million Californians received a cumulative $5.2 billion worth of EITC refunds in Tax Year 2008. On average, state residents received refunds in the amount of $2,039. By comparing tax filer data against zip code lists4, NUSIPR has determined that more than 13% of tax filers (177,108 out of 1,329,698) in San Diego County received an EITC refund in Tax Year 2006, worth a cumulative $314.8 million.5 EITC refunds for San Diegans were an average $1,778 per person, slightly lower than the estimated 2006 statewide average return of $1,883. Geographic information system (GIS) mapping software can be used to disaggregate the EITC information by municipality. Figure 2 provides data on the 2006 tax year.
4 The complete list of San Diego County zip code data figures, sourced from the San Diego Association of Governments, can be found in Appendix A. 5 2006 is the most recent year for which zip code level data is publicly available from the IRS.
Figure
Two:
Tax
Year
2006
EITC
Refunds
Estimates
in
San
Diego
County,
by
Municipality
Municipality Total Tax
Filers
EITC Filers Total EITC Refunds
($000) Average Refund Received % EITC filers Carlsbad 46,892 2,919 4,306 $ 1,475 6.2% Chula Vista 94,755 17,143 32,088 $ 1,872 18.1% Coronado 7,968 492 659 $ 1,339 6.2% Del Mar 7,513 255 224 $ 878 3.4% El Cajon 67,367 10,496 19,281 $ 1,837 15.6% Encinitas 29,050 2,025 2,540 $ 1,254 7.0% Escondido 65,165 9,103 16,868 $ 1,853 14.0% Imperial Beach 10,789 2,505 4,809 $ 1,920 23.2% La Mesa 32,525 3,282 5,019 $ 1,529 19.7% Lemon Grove 10,812 2,008 3,634 $ 1,810 18.6% National City 20,633 5,885 11,633 $ 1,977 28.5% Oceanside 76,651 11,721 21,893 $ 1,868 15.3% Poway 21,567 1,449 2,289 $ 1,580 6.7% San Diego 577,830 76,016 132,695 $ 1,746 13.2% San Diego County 152,932 18,744 33,408 $ 1,782 12.3% San Marcos 33,929 3,926 7,045 $ 1,794 11.6% Santee 23,197 2,291 3,730 $ 1,628 9.9% Solana Beach 6,495 304 360 $ 1,184 4.7% Vista 43,628 6,544 12,354 $ 1,888 15.0% TOTAL 1,329,698 177,108 314,835 $ 1,778 13.3% Source: Internal Revenue Service, NUSIPR Not surprisingly, EITC participation correlates with income level; cities south of the City of San Diego (Chula Vista, Imperial Beach, National City) have a higher percentage of EITC filers while the northern coastal communities (Del Mar, Solana Beach, Encinitas) fall below the countywide average. Additionally, the largest refunds in the county are mostly concentrated in the South Bay as well as the Inland cities.
Assessing the EITC Collection Gap
Previous research indicates that approximately 25% of earned income tax credits are unclaimed by eligible workers each year.6 The National University System Institute for Policy Research conducted its own analysis of 2006 IRS tax data and identified approximately $78.7 million in unclaimed EITC payments for 59,036 San Diego County workers7, as well as disaggregated that data by jurisdiction.
Figure
Three:
Unclaimed
EITC
Refunds
Estimates
in
San
Diego
County,
Tax
Year
2006
Total Tax Returns Total EITC
Returns
% EITC
filers
Est. EITC Returns
Unclaimed Federal EITC Payments (000) Est. Unclaimed EITC Payments (000) 1,329,698 177,108 13% 59,036 $ 314,835 $ 78,709 Source: Internal Revenue Service, author’s calculations 6 A March 2010 study released by the New America Foundation (NAF) estimates that 800,000 California workers failed to claim $1.1 billion in EITC refunds for the 2006 tax year, with San Diego County weighing in with the third largest unclaimed total at $77.7 million. 7 By comparing statewide IRS zip code data with current regional zip code lists found on the SANDAG website, NUSIPR accurately identified taxpayers in San Diego County.
Figure
Four:
Unclaimed
EITC
Refunds
Estimates
by
Municipality,
Tax
Year
2006
Municipality
Total
Est.
Unclaimed
EITC
Refunds
CARLSBAD $1.08 million CHULA VISTA $8.02 million CORONADO $164,750 DEL MAR $56,000 EL CAJON $4.82 million ENCINITAS $635,000 ESCONDIDO $4.22 million IMPERIAL BEACH $1.20 million LA MESA $881,250 LEMON GROVE $908,500 NATIONAL CITY $2.91 million OCEANSIDE $5.47 million POWAY $572,250 S.D. COUNTY $8.35 million SAN DIEGO $33.17 million SAN MARCOS $1.76 million SANTEE $932,500 SOLANA BEACH $90,000 VISTA $3.09 million
EITC’s Economic Impact in San Diego County
EITC payments have an impact not only on the recipients but also indirectly benefits local businesses and residents. Tax refunds enter the local economy and are spent for goods and services, supporting jobs and generating tax revenues for state and municipal governments. As these dollars are re‐spent and re‐circulated, they create a “multiplier effect” that can be measured. NUSIPR conservatively estimates that at least $248,532,074 in EITC refunds from the 2006 tax year were spent locally in San Diego County, inducing $349,996,925 in sales activity, supporting 2,075 jobs and
$87,798,005 in wages.8 The foregone economic benefits of unclaimed EITC refunds are also determinable. It can be safely assumed that at least $77,666,273 would have been spent in our region, inducing $87,499,231 in sales, supporting 519 jobs, and $21,949,501 in wages. To put these figures into perspective, local spending of EITC refunds each year is more than three times greater than the estimated direct economic impact of Comic‐Con ($67.8 million).9 The number of foregone jobs resulting from unclaimed EITC payments is greater than the total number of employees working at Von's Grocery Stores in San Diego County.10
A Profile of San Diego’s EITC‐eligible Workers
Using a proprietary statistical tax modeling program that cross‐compares Census and IRS data, the Brookings Institute estimated that in the 2007 tax year there were approximately 199,762 EITC‐eligible “tax units” in San Diego County.11 When dependents are included, the total population directly touched by EITC refunds swells to approximately 610,144, or more than 1 out of 5 of all county residents. Most EITC‐eligible San Diegans are Latino (44.4%), though a sizeable number are Caucasian (34.6%) and Asian/Pacific Islanders (9.4%). The overwhelming majority are parents; Brookings found that 37% have one qualifying child, and another 41.6% have two or more children. Few however, are married with only slightly more than a quarter (26.7%) filing their taxes as married status. More than half (53.5%) filed as an unmarried “head of household.” The majority (51.8%) speak English at home, while 38.3% speak Spanish. More than four out of ten (43.5%) EITC‐eligible San Diegans are 34 years old or younger, while 41.1% are middle aged (35 to 54 years). 8 The New America Foundation’s estimates for claimed and unclaimed EITC refunds in San Diego County are only marginally smaller than the author’s calculations, and thus, their IMPLAN analysis is a strong conservative estimate of economic impact. Source: Antonio Avalos and Sean Alley. Left on the table: Unclaimed Earned Income Tax Credits cost California's economy and low‐income residents $1 billion annually. New America Foundation. Washington, D.C.: March 2010. Pgs. 10‐16. An estimated $62.1 million in EITC refunds went to San Diego residents and were spent outside the region. 9 The $67.8 million was derived from a study conducted by CIC Research on behalf of the San Diego Convention Center Corp., and cited in the following article: Weisberg, Lori. “Gauging the power of Comic‐Con’s punch.” San Diego Union‐Tribune. 24 June 2010. 10 Source: San Diego Daily Transcript. “2009 Sourcebook: Companies.” Accessed June 8, 2010. <http://sourcebook.sddt.com/Source/companies.cfm?BusinessCategory_ID=205>. 11 Brookings Institute. “Characteristics of EITC‐Eligible Taxpayers, 2007; San Diego‐Carlsbad‐San Marcos, CA.” Accessed May 10, 2010. <http://www.brookings.edu/~/media/Files/Programs/Metro/EITC/San%20Diego.pdf>.
The economic challenges of EITC recipients are also striking. Few have received more than a high school diploma (22.4%). Only 18.6% have earned an associate’s, bachelors or advanced college degree. Slightly less than a quarter (23.3%) have not earned a high school diploma. This low level of education attainment unsurprisingly translates into low income. 59.5% of EITC filers make less than $20,000 a year in adjusted gross income. EITC‐eligible San Diegans work mostly in office administration (14.4%) and sales work (10.1%), concentrated primarily in the retail, hospitality and construction industries. While Brookings estimates that while 61.3% of EITC‐eligible San Diegans work in the private for‐profit sector, a significant number work in the public sector – 9.2% are employed by the military, and 7.1% are employed by the government. Individual EITC refunds split between the highest and the lowest amounts. Three out of ten (30.1%) EITC‐eligible residents received under $500 for the 2007 tax year, while 45.7% received $2,000 or more, reflecting the large number of eligible taxpayers with qualifying children.
Outreaching to EITC‐Eligible Workers in San Diego County
Though there is no federal requirement, many municipal governments across the country hold EITC awareness campaigns every tax season. San Diego is no exception. In 2003, the San Diego County Board of Supervisors launched an EITC awareness campaign on a pilot basis. Hosting five free tax preparation sites, county workers successfully helped at‐need residents file 832 tax returns, which facilitated $626,623 in claimed EITC refunds.12 Since that time, county officials estimate that their direct efforts have cumulatively helped secure $29 million in EITC refunds for the region. Most recently in 2009, county officials partnered with non‐profit and community groups to host approximately 75 free tax preparation sites, allowing approximately 500 volunteers to assist completing more than 18,100 federal tax returns worth $5.86 million in EITC refunds.13 12 Board of Supervisors, County of San Diego Agenda Item. “Countywide Expansion of the Earned Income Tax Credit Pilot Program.” San Diego: July 29, 2003. 13 United Way of San Diego County. “San Diego County Earned Income Tax Credit Campaign: ‘Earn It, Keep It, Save It.’ End of Year Report. 2008/2009 Tax Season.”
Figure
Five:
EITC
Outreach
Efforts
in
San
Diego
County,
2003
‐
2009
2003 2004 2005 2006 2007 2008 2009
# Tax Prep Sites 5 22 16 58 95 75 75
# Taxpayers Served 832 2,958 3,710 12,169 14,627 19,296 18,103 Total EITC $626,623 $2,439,281 $2,566,677 $4,994,801 $5,605,218 $7,286,472 $5,866,509 Source: United Way of San Diego In 2010, local EITC outreach and enrollment efforts were conducted principally through the San Diego Countywide EITC Coalition, a working partnership between the United Way of San Diego, the Internal Revenue Service, the County of San Diego, and other community organizations. Notable changes this year include the heightened role of youth volunteers in the Coalition’s campaign. On February 22nd, 2010, San Diego County’s Health and Human Services Agency, San Diego State University, and California
State University – San Marcos announced a new partnership called Thrive San Diego that directed
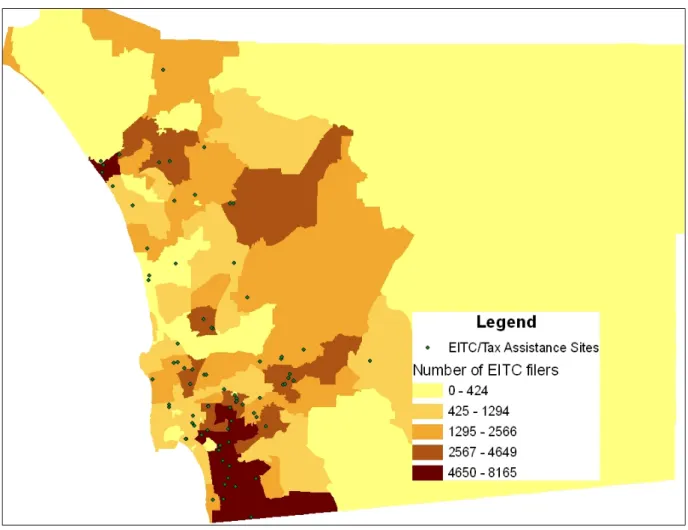
approximately 70 students and university employees to help prepare tax returns as well as screen for food stamp eligibility at nine different sites, two of which were fully managed by students. Thrive San Diego participants were also directly involved in EITC marketing efforts at schools, grocery stores, religious institutions and community centers. For Tax Year 2009, the United Way of San Diego’s website listed 78 free tax assistance sites for EITC enrollment (a complete list of EITC sites is included in the Appendix of this brief). Using GIS software, the National University System Institute for Policy Research plotted the street address of the tax sites on a county zip code map, shaded to indicate the number of EITC claimants in Tax Year 2006.
Figure
Six:
EITC
Claimants
in
San
Diego
County
by
Zip
Code,
Tax
Year
2006
Source: Internal Revenue Service, United Way of San Diego The map reveals that county EITC coordinators have done a good job of aligning EITC assistance centers with the neighborhoods where such services are needed. Tax assistance sites in 2010 were heavily concentrated in the South Bay, as well as the Southeastern neighborhoods of San Diego County, two areas where EITC claimants reside in large numbers. A small cluster of sites are positioned near Camp Pendleton, likely serving the needs of military personnel that qualify for EITC dollars based on their pay grade. While the tax data used in this illustration is from Tax Year 2006; however it is unlikely that tax filings have changed dramatically since that time. Although EITC outreach has improved over the years, it is still helping too few San Diegan workers. The 14,627 tax filings directly facilitated by EITC Coalition volunteers in 2007 was only 1.1% of the tax filings that tax year. Instead, most low‐income workers, like all other California workers, pay to have their taxes professionally prepared. According to the research published February 2010 by the Public Policy Institute of California (PPIC), more than 3 out of 4 EITC claimants (76%) pay for tax filing preparation, a
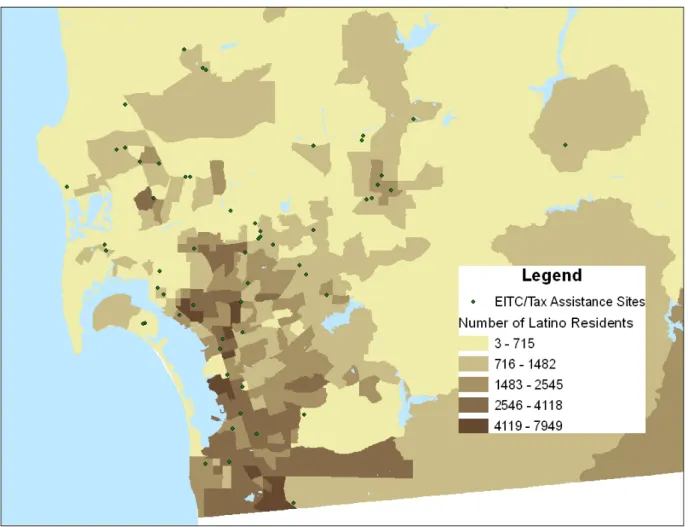
higher rate than the national average (69%). PPIC estimates that statewide, only 1.6% of EITC claimants used free tax preparation services in 2006. The findings by Brookings particularly suggest the importance of developing a culturally competent outreach initiative to Hispanic residents. Survey data and anecdotal evidence suggests that Spanish language speakers and Latino workers are less likely to know of and enroll for the EITC than English speaking, non‐Latino workers. Figures from the 2001 National Survey of American Families (NAF) found that only a small number of low‐income Latino parents (27%) have heard of the EITC, compared to 58% of all low‐income parents.14 Additionally, parents with less than a high school education are significantly less likely to be aware of the federal tax credit. NAF also indicated in their 2010 study that communities with high non‐claimant rates tend to be more Latino, low‐income, and high participation in food stamp programs.
14 Maag, Elaine. “Disparities in Knowledge of the EITC.” Tax Policy Center: Tax Notes, March 14, 2005. Washington,
Figure
Seven:
Latino
Residents
in
San
Diego
County
by
Census
Block,
2000
The United Way outlines an aggressive strategy for Latino worker outreach in their 2009 EITC End of Year Report. Promotional materials included distributing 60,000 bilingual postcards and 2,000 bilingual posters throughout the region, and providing a four minute informational video in English and Spanish about the EITC and free tax preparation sites at county government offices. Other cities enlist local Spanish‐speaking actors and musicians to participate for free in EITC public service announcements, as well as media events. It is unclear whether San Diego EITC Coalition leaders have undertaken a similar strategy. There may be additional opportunities. As of January 1, 2008, California law requires all employers to notify their employees of the EITC in person or by mail, within one week of providing IRS Form W‐2. However, there is no requirement to provide Spanish‐language information. Moreover, previous studies have also shown that Latinos are more likely to receive their news from the radio than non‐Latino Americans, a resource which may not be fully utilized by EITC campaign organizers.
Local elected officials at the City of San Diego and other municipal governments should also consider officially recognizing an Earned Income Tax Credit Awareness Day each year. Other large metropolitan cities, such as San Francisco, Chicago, and New York City have made EITC outreach a signature annual program. Conclusion When San Diego County workers fail to enroll for the EITC, our entire region suffers. Increasing program participation today would make significant inroads as nearly half of all EITC recipients reside in the City of San Diego, which collected $132.6 million in the 2006 tax year. By collaborating with county officials to expand the ranks of volunteers and the number of city facilities used for public awareness and tax filing centers, City Hall can begin closing the gap on the estimated $20.4‐$34.1 million of unclaimed EITC refunds lost each year. Improving San Diego’s EITC public outreach can result in a financial benefit that exceeds the maximum annual refund cap, as qualified workers can legally “back‐file” for the EITC and receive up to three years of tax credit refunds they’ve earned but not yet claimed. Improving EITC enrollment should also be a matter of community pride, as it can help San Diego receive back more of its fair share of tax dollars from Washington D.C., reversing the deplorable “net donor” status we have today. With approximately 1 out of 5 San Diego County residents living in EITC‐eligible families, raising the bar on program outreach is one more component to securing our region’s economic recovery.
APPENDIX
A:
Claimed
&
Estimated
Unclaimed
EITC
Refunds
to
San
Diego
County
Residents,
2006
Zip Code Total Tax Returns Total EITC Returns % EITC filers Federal EITC Payments (000) Est. Unclaimed EITC Payments (000) 91901 6,467 495 8% $ 783 $ = 91902 8,140 718 9% $ 1,197 $ 299 91905 643 92 14% $ 136 $ 34 91906 1,317 198 15% $ 333 $ 83 91910 32,130 5,885 18% $ 10,954 $ 2,739 91911 33,969 7,989 24% $ 15,326 $ 3,832 91913 14,573 1,842 13% $ 3,310 $ 828 91914 5,528 486 9% $ 809 $ 202 91915 8,555 941 11% $ 1,689 $ 422 91916 852 73 9% $ 117 $ 29 91917 399 115 29% $ 235 $ 59 91931 194 43 22% $ 78 $ 20 91932 10,789 2,505 23% $ 4,809 $ 1,202 91934 260 64 25% $ 132 $ 33 91935 3,945 304 8% $ 481 $ 120 91941 21,023 2,240 11% $ 3,525 $ 881 91942 11,502 1,042 9% $ 1,494 $ 374 91945 10,812 2,008 19% $ 3,634 $ 909 91948 48 ‐ 0% $ ‐ $ ‐ 91950 20,633 5,885 29% $ 11,633 $ 2,908 91962 903 60 7% $ 108 $ 27 91963 516 155 30% $ 321 $ 80 91977 23,363 4,523 19% $ 8,837 $ 2,209 91978 3,882 547 14% $ 906 $ 227 91980 887 290 33% $ 564 $ 141 92003 2,677 254 9% $ 477 $ 119 92004 1,417 282 20% $ 527 $ 132 92007 5,650 424 8% $ 524 $ 131
92008 13,159 1,039 8% $ 1,461 $ 365 92009 17,623 864 5% $ 1,239 $ 310 92010 6,339 410 6% $ 640 $ 160 92011 9,771 606 6% $ 966 $ 242 92014 7,513 255 3% $ 224 $ 56 92019 18,401 1,895 10% $ 3,340 $ 835 92020 22,172 3,952 18% $ 7,208 $ 1,802 92021 26,794 4,649 17% $ 8,733 $ 2,183 92024 23,400 1,601 7% $ 2,016 $ 504 92025 16,850 2,967 18% $ 5,849 $ 1,462 92026 19,903 2,340 12% $ 4,016 $ 1,004 92027 19,957 3,147 16% $ 5,941 $ 1,485 92028 18,673 2,566 14% $ 4,864 $ 1,216 92029 8,455 649 8% $ 1,062 $ 266 92036 1,601 184 11% $ 295 $ 74 92037 19,541 750 4% $ 744 $ 186 92040 18,282 2,300 13% $ 3,745 $ 936 92054 30,072 6,161 20% $ 12,071 $ 3,018 92055 6,467 339 5% $ 422 $ 106 92056 23,660 2,481 10% $ 4,217 $ 1,054 92057 22,919 3,079 13% $ 5,605 $ 1,401 92058 932 221 24% $ 422 $ 106 92059 701 101 14% $ 185 $ 46 92060 169 13 8% $ 5 $ 1 92061 1,291 214 17% $ 414 $ 104 92064 21,567 1,449 7% $ 2,289 $ 572 92065 15,212 1,519 10% $ 2,692 $ 673 92066 148 17 11% $ 23 $ 6 92067 5,595 152 3% $ 145 $ 36 92069 17,319 2,456 14% $ 4,524 $ 1,131 92070 540 88 16% $ 157 $ 39 92071 23,197 2,291 10% $ 3,730 $ 933 92075 6,495 304 5% $ 360 $ 90 92078 16,610 1,470 9% $ 2,521 $ 630 92081 12,004 1,033 9% $ 1,692 $ 423 92082 8,052 889 11% $ 1,660 $ 415 92083 13,521 2,739 20% $ 5,358 $ 1,340 92084 18,103 2,772 15% $ 5,304 $ 1,326
92086 627 65 10% $ 90 $ 23 92091 497 ‐ 0% $ ‐ $ ‐ 92093 48 ‐ 0% $ ‐ $ ‐ 92096 ‐ ‐ 0% $ ‐ $ ‐ 92101 14,851 1,294 9% $ 1,184 $ 296 92102 15,983 3,966 25% $ 7,605 $ 1,901 92103 18,097 1,119 6% $ 764 $ 191 92104 21,424 3,218 15% $ 5,060 $ 1,265 92105 23,298 7,357 32% $ 15,762 $ 3,941 92106 9,263 656 7% $ 820 $ 205 92107 14,786 1,106 7% $ 1,071 $ 268 92108 10,014 563 6% $ 564 $ 141 92109 24,994 1,594 6% $ 1,383 $ 346 92110 11,825 1,185 10% $ 1,617 $ 404 92111 20,310 2,877 14% $ 5,051 $ 1,263 92113 15,396 5,345 35% $ 11,505 $ 2,876 92114 26,076 5,757 22% $ 11,236 $ 2,809 92115 22,108 3,919 18% $ 7,132 $ 1,783 92116 16,980 2,000 12% $ 2,643 $ 661 92117 24,572 2,253 9% $ 3,141 $ 785 92118 7,968 492 6% $ 659 $ 165 92119 11,355 745 7% $ 1,023 $ 256 92120 13,217 804 6% $ 1,055 $ 264 92121 2,483 152 6% $ 122 $ 31 92122 18,751 845 5% $ 920 $ 230 92123 12,675 1,573 12% $ 2,576 $ 644 92124 12,765 1,518 12% $ 2,556 $ 639 92126 32,430 3,432 11% $ 5,644 $ 1,411 92127 14,022 832 6% $ 1,305 $ 326 92128 22,566 896 4% $ 1,098 $ 275 92129 22,997 1,636 7% $ 2,684 $ 671 92130 20,085 751 4% $ 1,034 $ 259 92131 15,168 641 4% $ 844 $ 211 92134 264 17 6% $ 29 $ 7 92135 565 35 6% $ 45 $ 11 92136 392 38 10% $ 63 $ 16 92139 15,036 2,875 19% $ 5,291 $ 1,323 92140 257 10 4% $ 10 $ 3 92145 1,775 78 4% $ 111 $ 28 92154 33,504 8,165 24% $ 16,262 $ 4,066 92155 616 42 7% $ 57 $ 14 92161 ‐ ‐ 0% $ ‐ $ ‐ 92173 17,341 5,972 34% $ 12,684 $ 3,171 92182 ‐ ‐ 0% $ ‐ $ ‐ 92259 162 12 7% $ 18 $ 5 92536 1,325 196 15% $ 290 $ 73 92672 16,748 1,655 10% $ 2,749 $ 687
APPENDIX
B:
2010
San
Diego
County
EITC/Tax
Filing
Assistance
Sites
CENTRAL REGION ‐ VITA ADDRESS
Home Start (Mid‐City) 5296 University Ave. Suite F‐2 San Diego, CA 92105 Home Start/Tubman Chavez Center 415 N. Euclid Ave. San Diego, CA 92114 Bronze Triangle CDC 2959 Imperial Avenue San Diego, CA 92101 San Diego State University 5500 Campanile Drive San Diego, CA 92182 MAAC/President John Adams Manor 5471 Bayview Heights Place San Diego, CA 92105 MAAC Mercado Apartments 2001 Newton Ave. San Diego, CA 92113 ACORN 22 W 35th Street Suite 203 National City, CA 91950 Alliance for African Assistance 5952 El Cajon Blvd. San Diego, CA 92115
EAST REGION ‐ VITA ADDRESS
MAAC‐ San Martin de Porres Apartments 9119 Jamacha Road Spring Valley, CA 91977 Home Start ‐ East El Cajon 1123 N. Mollison Ave El Cajon, CA 92021 Home Start ‐ Lemon Grove Recreation
Center 3131 School Lane Lemon Grove, CA 91945
Home Start ‐ El Cajon 338 W. Lexington Ave., Ste. 105 El Cajon, CA 92020
NORTH CENTRAL REGION ‐ VITA ADDRESS
SAY San Diego‐Clairemont 4340 Genesee Ave. Suite 207 San Diego, CA 92123 SAY/Linda Vista Recreation Center 7064 Levant Street San Diego, CA 92111 Catholic Charities 9535 Kearny Villa Rd, Ste. 100 San Diego, CA 92126 Catholic Charities – Refugees 4575‐A Mission Gorge Place San Diego, CA 92120 Chinese Service Center 8775 Aero Dr., Ste. 138 San Diego, CA 92123 Mabuhay Alliance 9630 Black Mountain Rd., Ste. G San Diego, CA 92126
NORTH COASTAL REGION ‐ VITA ADDRESS
North County Lifeline 707 Oceanside Blvd. Oceanside, CA 92054 MAAC Laurel Tree Apartments 1307 Laurel Tree Lane Carlsbad, CA 92009
SOUTH REGION ‐ VITA ADDRESS
South Bay Community Services 1124 Bay Blvd., Ste. D Chula Vista, CA 91911 MAAC ‐ National City 2345 E. 8th St. Suite 105 National City, CA 91950 MAAC‐ San Ysidro Ctr 663 San Ysidro Blvd. San Ysidro, CA 92173 MAAC ‐ Chula Vista 845 Broadway Chula Vista, CA 91911
NORTH INLAND REGION ‐ VITA ADDRESS
Interfaith Community Services 550‐B W. Washington Ave. Escondido, CA 92025 North County Lifeline 200 Michigan Ave. Vista, CA 92084
AARP EITC Sites ADDRESS
AARP Information Center 4075 30th Street San Diego, CA 92102 Alpine Community Center 1830 Alpine Blvd Alpine, CA 91901 Atonement Lutheran Church 7250 Eckstrom Avenue San Diego, CA 92111 Champagne Village Mobile Home Park 8975 Lawrence Welk Drive Escondido, CA 92026 Brengle Terrace Senior Service 1400 Vale Terrace Vista, CA 92084 Carlsbad Senior Center 799 Pine Avenue Carlsbad, CA 92008 Chula Vista Main Library 365 F Street Chula Vista, CA 91910 CITI Bank 740 S Rancho Santa Fe Rd San Marcos, CA 92078 Claremont Community Svce Ctr 4731 Clairemont Drive San Diego, CA 92117 College Avenue Senior Center 4855 College Avenue San Diego, CA 92115 Coronado Public Library 640 Orange Avenue Coronado, CA 92118 Coronado Senior Center 1019 7th Street Coronado, CA 92118
Edgemoor Nutritional Center 9065 Edgemoor Drive Santee, CA 92071 Elderhelp of San Diego 4069 30th Street San Diego, CA 92104 Encinitas Senior Center 1140 Oakcrest Park Drive Encinitas, CA 92024 El Cajon Public Library 201 E Douglas Ave El Cajon, CA 92020 Oceana Community Association Clubhouse 550 Vista Bella Oceanside, CA 92057 First Lutheran Church 1420 3rd Avenue San Diego, CA 92101 Imperial Beach Senior Center 1075 8th Street Imperial Beach, CA 91932 Joslyn Senior Center 399 Heald Lane Fallbrook, CA 92028 La Mesa Senior Center 8450 La Mesa Blvd La Mesa, CA 91941 Lakeside Community Center 9841 Vine Street Lakeside, CA 92040 Meadowvrook Mobile Estates 8301 Mission Gorge Road Santee, CA 92071 Lemon Grove Senior Center 8235 Mount Vernon Street Lemon Grove, CA 91945
Live Well San Diego 4425 Bannock Avenue San Diego, CA 92117 Mira Mesa Senior Center 8460 Mira Mesa Blvd San Diego, CA 92126 National City Library 1401 National City Blvd National City, CA 91950 New Frontier Mobile Home Park 9225 N Magnolia Ave San Diego, CA 92119 North University Community Library 8820 Judicial Drive San Diego, CA 92122 Oceanside Senior Ctr 455 Country Club Lane Oceanside, CA 92054 Peninsula Comm Service Ctr 3740 Sports Arena Blvd #L San Diego, CA 92110 Poway Valley Senior Ctr 13094 Bowron Road Poway, CA 92064 Rancho Bernardo Senior Service 16769 Bernardo Center Drive San Diego, CA 92128 Rancho Sante Fe Senior Center 16780 La Gracia Street Rancho Santa Fe, CA 92091 Ray & Jon Kroc Community Ctr 6605 University Ave San Diego, CA 92115 Saint Brigid's Church 4735 Cass Street San Diego, CA 92109 Saint James Catholic Church 645 S Nardo Avenue Solana Beach, CA 92075 Salvation Army 825 7th Street San Diego, CA 92101 San Marcos Joslyn Senior Ctr 111 Richmar Avenue San Marcos, CA 92069 Senior Service Council 728 N Broadway Escondido, CA 92025 Serra Mesa Library 9005 Aero Drive San Diego, CA 92123 Sharp Cabrillo Senior Resource 3475 Kenyon Street San Diego, CA 92110 Sharp Chula Vista Hospital 751 Medical Center Court Chula Vista, CA 91911 Shut‐Ins Cheryl Porter 655 Brockwood Drive El Cajon, CA 92021 Solana Beach Presbyterian Church 225 Stevens Avenue Solana Beach, CA 92075 South Chula Vista Library 389 Orange Avenue Chula Vista, CA 91911 South Bay Nutritional Center 945 18th Street San Diego, CA 92154 St. John Baptist Church 1524 Lemon Street Oceanside, CA 92054 St. Paul's Manor 2635 2nd Avenue San Diego, CA 92103 Washington Mutual Bank 4627 College Avenue San Diego, CA 92115 Wells Community Center 1153 E Madison Avenue El Cajon, CA 92021