DISPERSAL BEHAVIOR AND CONNECTIVITY OF RED-COCKADED WOODPECKERS IN THE NORTH CAROLINA SANDHILLS
Anne Maura Trainor
A dissertation submitted to the faculty of the University of North Carolina at Chapel Hill in partial fulfillment of the requirements for the degree of Doctor of Philosophy in the Department of Geography.
Chapel Hill 2011
Approved by: Dr. Aaron Moody
ABSTRACT
Anne Maura Trainor: Dispersal Behavior and Connectivity of Red-cockaded Woodpeckers in the North Carolina Sandhills
(Under the direction of Aaron Moody)
Human activities are degrading natural ecosystems globally, thus eroding biological diversity and reducing wildlife populations. One prominent example is the Red-cockaded woodpecker (Picoides borealis) which is a federally endangered, cooperative breeding species endemic to highly-fragmented longleaf pine (Pinus palustris) forests in the southeastern United States. The persistence of P. borealis is dependent upon managing longleaf pine forests to facilitate prospecting and dispersal movements and thus connecting populations.
My overall research objective was to interrelate spatial environmental data and animal movement behaviors in order to evaluate P. borealis habitat connectivity. First, I developed a novel method to empirically estimate and validate landscape resistance surfaces using mark-recapture and radio-telemetry data. I then applied this method to determine how prospecting movements were influenced by both environmental and conspecific cues during forays. The detail prospecting and dispersal data was then
DEDICATION
This work is dedicated to Zackary I. Cleveland, with his love and support he supported me during many years as a graduate student while sharing the journey and all of its ups
ACKNOWLEDGEMENTS
I appreciate the assistance throughout this project from all the members of my graduate committee. First, this project would not have been possible without the continuous support and guidance of my advisor, Aaron Moody. He has given me the freedom to explore many disciplines throughout Geography and the confidence to
conduct important and thought provoking research during my time at University of North Carolina. I appreciate Dean Urban for teaching me how to expand my skills as a wildlife biologist into the wide-ranging field of landscape ecology and showing me how to connect the dots. Jeffery Walters, who is extremely dedicated to providing reliable science for conservation biology, has been extremely patient with a myriad of Red-cockaded woodpecker questions and taught me to appreciate the subtle complexities of the species. Conghe Song has been an invaluable resource during my adventures into learning and applying remote sensing techniques with wildlife conservation. Thanks to Larry Band for providing me unique insights into forest ecology from the roots to the canopy. The entire committee supplied helpful and thoughtful comments on this research project.
Many people provided technical and financial support. Jack Weiss and Bill Morris provided invaluable assistance with my analysis. I would also like to thank UNC’s
I would like to express gratitude to the Moody Lab members, past and present. Jennifer Costanza, Lindsay Berk, Matt Simon, Ian Breckheimer, Amanda Chunco, Todd Jobe, Christine Urbanowicz, and Naomi Schwartz have made my work interesting and enjoyable.
This research was funded by the U.S. Department of Defense Strategic
Environmental Research and Development Program (RC-1471). I would like to thank the University of North Carolina Graduate School for financial and logistical support. I would also like to express gratitude to members of the SERDP Connectivity Team for comments throughout my research.
Other students in Geography and Ecology have been instrumental parts of my graduate career. I would especially like to thank the Doyle Lab (Lauren Patterson, Daisy Small, Jeff Muehlbauer, and Autumn Thoyre) for letting me work and play with them throughout my graduate career, even though I know nothing about rivers.
TABLE OF CONTENTS
LIST OF TABLES .….………..xii
LIST OF FIGURES ..………...xiv
Chapter 1. Introduction ... 1
Chapter Summaries ... 6
Literature Cited ... 9
2. Beyond expert opinion: Empirical estimation and validation of dispersal resistance surfaces for Red-cockaded Woodpecker ... 11
Abstract ... 11
Key words ... 12
Introduction ... 12
Methods... 16
Study Site ... 16
Overall Approach ... 17
Data ... 20
Analysis... 28
Results ... 30
Radio telemetry ... 30
Maxent Models ... 30
Discrete-choice Analysis ... 31
Resistance Surface ... 34
Model Validation ... 36
Discussion ... 37
Conclusion ... 43
Acknowledgments... 44
Literature Cited ... 45
3. Environmental and conspecific cues influencing Red-cockaded woodpecker prospecting behavior ... 52
Abstract ... 52
Key words ... 53
Introduction ... 53
Methods... 56
Study Site ... 56
Data ... 57
Analysis... 61
Results ... 64
Discussion ... 69
Conclusion ... 73
Acknowledgments... 74
Literature Cited ... 75
4. Field-calibrated connectivity estimates for Red-cockaded woodpecker populations ... 80
Abstract ... 80
Keywords ... 81
Introduction ... 81
Methods... 85
Study Area ... 85
Data ... 86
Models... 89
Analysis... 92
Results ... 96
Discussion ... 101
Acknowledgements ... 106
5. Evaluating Safe Harbor Program contribution to connecting
resources: Case study of the Red-cockaded Woodpecker ... 112
Abstract ... 112
Key words ... 113
Introduction ... 113
Methods... 116
Focal species ... 116
Study Area ... 117
Data ... 120
Models... 122
Analysis... 126
Results ... 132
Discussion ... 140
Conclusion ... 145
Acknowledgements ... 146
Literature Cited ... 147
6. Conclusion ... 154
Summary of major results ... 154
Fundamental Contributions ... 155
LIST OF TABLES
Table
2.1 The ranking of discrete-choice models describing
juvenile female Red-cockaded woodpecker (Picoides borealis) prospecting behavior in relation to habitat suitability models constructed with environmental and occurrence data (in Maxent) along with varying friction values converted with
rescaling constants (c ) in the Sandhills region of North Carolina. ... 33
2.2 The percentage of short-distance (SDD) and long-distance (LDD) dispersers that settled into territories within four corridor widths, determined by least-cost percentiles from a resistance surface based on non-natal telemetry locations, forest structure
and a moderate rescaling constant (c = 4). ... 37 3.1.The ranking of discrete-choice models predicting
Red-cockaded woodpecker (Picoides borealis)
prospecting behavior within the Sandhills ecoregion of North Carolina in 2006 and 2007. Friction-weighted distance
was based on forest structure estimated with LiDAR data. ... 67
3.2.The predicted estimates, standard errors, and 95% confidence intervals of environmental and conspecific cues influencing Red-cockaded woodpecker (Picoides borealis) prospecting behavior from the top-ranked discrete-choice models within the Sandhills ecoregion
of North Carolina in 2006 and 2007. ... 68
4.1 Definition of graph terms and metrics used to evaluate connectivity of Red-cockaded woodpeckers (Picoides
borealis) in North Carolina’s Sandhills ecoregion. ... 93
5.1 The number of Red-cockaded woodpecker (Picoides borealis) territories grouped by landownership in
6.1 Overview of landscape ecology and wildlife management disciplines and how this dissertation
LIST OF FIGURES Figure
2.1 Flow chart describing the methods used to evaluate varying environmental data expected to influence Red-cockaded woodpeckers (Picoides borealis)
prospecting and dispersal movements. ... 20
2.2 The seven curves used to rescale habitat suitability values into friction values. The dash and dotted curves produced the top-ranked and second-ranked predictive
rescaling for prospecting behavior, respectively. ... 28
2.3 An example of a juvenile female Red-cockaded woodpecker (Picoides borealis) that dispersed to a breeding territory within the 25% least-cost corridor derived from the top-ranked
resistance surface. ... 30
2.4 The Area Under the Curve (AUC; +/- SE bars) for each Maxent model. ... 31
2.5 The probability of Red-cockaded woodpeckers (Picoides borealis) presence based on average habitat suitability (red line) and a standard error (blue shading) based on forest structure variables located at non-natal telemetry locations during 2006 and 2007 in the Sandhills of North Carolina. The percent contribution (PC) is also provided for
each variable in the top-ranked habitat suitably model. ... 35
2.6 Box plot of percent midstory cover (1 to 8 m) in relation to habitat suitability and the friction value in the top-ranked model predicting Red-cockaded woodpecker (Picoides borealis) prospecting movements. The line indicates the top-ranked rescaling constant explaining the relationship
3.1 The study area extent with the center of Red-cockaded woodpeckers (Picoides borealis) territories and military installation boundaries. The two shaded polygons illustrate the spatial coverage of radio telemetry data collection
(2006 = west, 2007 = east). ... 57
3.2 An example of a radio-tagged juvenile female Red- cockaded woodpecker (Picoides borealis) prospecting
movements in relation to effective distance surface. A number to the upper right of a territory indicates the frequency the bird was observed visiting that territory. Territories without
numbers were never visited. ... 62
3.3 Average (+/- SE) age of breeding male (top) and number of fledglings (bottom) by the number of observed territory visits of dispersing juvenile female Red-cockaded
woodpecker (Picoides borealis). ... 66
4.1 Study area depicting Red-cockaded woodpecker (Picoides borealis) territories in relation to military installations,
protected properties, and evergreen forest in North Carolina (inset). ... 86
4.2 Overview of methods used to create resistance surface and graph network edges when estimating connectivity
for Red-cockaded woodpeckers (Picoides borealis). ... 91
4.3 The number of graph components, graph order, and diameter of friction-weighted distance networks with iterative edge thinning (A). Arrows and percentages represent the cumulative percent of juvenile females Red-cockaded woodpecker (Picoides borealis) observed dispersing in North Carolina’s Sandhills ecoregion. The frequency of observed dispersal distances based on least-cost path with the line representing the fitted
4.4 Observed friction-weighted distance dispersed minus the average friction-weighted distance of all territories with similar Euclidean distances from natal territory.
Shaded box indicate individuals dispersing less than 6 km. ... 97
4.5 The resistance surface (a) and networks of territory groups for Red-cockaded woodpecker (Picoides borealis) with friction-weighted distance thresholds corresponding to 25% (b),50% (c), and 75% (d) observed dispersal ability. Components are displayed
with nodes (territories) and edges containing the same color. ... 100
5.1 Red-cockaded woodpecker (Picoides borealis) active and inactive territories in relation to land ownership and Safe Harbor Program properties in
the Sandhills region of North Carolina (inset). ... 119
5.2 The frequency of observed least-cost friction-weighted dispersal distances with the dashed line representing the
fitted distribution based on a lognormal function. ... 126
5.3 An example of the comparing the direct dispersal probability (pad) to dispersal probability of each
connection (pa>b>c>d). This comparison used to illustrate the calculation of the maximum product dispersal
probability (pad*) between territories A and D. ... 127
5.4 Example of the resistance surface and least-cost path (LCP) from natal territory to nearby (< 6 km) active territories for current conditions (a) and projected urban growth for
2050 (b) and 2100 (c). ... 131
5.5 The average (+/- SE) habitat quality for territories by landowner (left) and private properties enrolled in the
5.6 The habitat quality for inactive (top) and active (bottom) Red-cockaded woodpecker (Picoides borealis) territories
in North Carolina’s Sandhills region. ... 133
5.7 Observed natal dispersal events during 2004 to 2007 for juvenile female Red-cockaded woodpecker (Picoides borealis) born on and/or dispersed to territories on properties enrolled in the Safe Harbor Program (SHP) in the
Sandhills region of North Carolina. ... 135
5.8 Red-cockaded woodpecker (Picoides borealis) connectivity represented with Probability of Connectivity with
Equivalent Connectivity (PCEC) based on present landscape conditions with five separate networks landownership [1) federal-only property, 2) all managed properties (government and non-government agency conservation properties, 3) all managed properties and private properties enrolled in the SHP, 4) all managed properties and private properties not enrolled in SHP, and 5) all territories in the study area] and networks
created based on projected urban growth (red bars)... 137
5.9 The distribution and relative contribution to connectivity (dPCEC) for inactive (top) and active (bottom)
Red-cockaded woodpecker (Picoides borealis) territories
on privately-owned land in North Carolina’s Sandhills region. ... 138
5.10. The percent change from current conditions to projected urban growth in 2100 based on relative importance of territories to connectivity (dPCEC). The hot colored territories represent connectivity increased with urban growth and colors represent territories’ connectivity
CHAPTER 1 INTRODUCTION
Human activities are reducing and degrading natural ecosystems globally (Hoekstra et al. 2005). As a result, extensive contiguous natural habitats have become fragmented and interspersed by human land-uses, such as urban development and agriculture. This spatial arrangement restricts the movement of animals between habitat patches, thus reducing genetic diversity within populations and increasing extinction risk for local populations (Fahrig and Merriam 1994, Goodwin and Fahrig 2002). Natal dispersal, an animal’s movement from its natal site to the first site where it obtains breeding status, is arguably the most essential behavior responsible for demographically and genetically connecting populations (Greenwood and Harvey 1982, Wiens 2001). Despite its importance for wildlife management and conservation, natal dispersal
To better understand natal dispersal behavior, data are typically gathered by capturing and marking juveniles at their birth sites and then attempt to recapture them at a breeding site (Bowler and Benton 2005). Mark-recapture data provides information about the straight line distance between the natal site and the selected breeding site. However, some individuals engage in extensive exploratory forays when prospecting for potential breeding sites prior to the final dispersal event (Waser 1985, Reed et al. 1999, Norris and Stutchbury 2001). During this transient phase of dispersal, prospecting individuals are likely assessing the surrounding environments and social cues to evaluate breeding sites for potential reproductive success (Ward 2005). Mark-recapture data do not capture prospecting movements or how organisms react to spatially complex landscape mosaics between resources.
There are numerous techniques, including direct observations, radio or satellite tracking, and florescent powder tracking, that can be used to record more geographically detailed information on the route taken by animals as they disperse through the
landscape. Radio telemetry is perhaps the most powerful of these methods because it allows animals to be located and observed during the animals elusive movements. Although noted drawbacks, especially for tracking small mammals and bird species, include creating transistors and batteries compact and light enough to allow continuous transmission over long ranges without harming the animal or altering their movement behavior (Kenward 2001). Movement data obtained with radio telemetry combined with spatial environmental data can provide greater insight about how landscape
structure) affect the probability that a dispersing individual will move through a given area. This information can then be used to map what is often called "resistance" (or its converse "permeability") which represents the degree to which a given land-cover type facilitates or impedes dispersal (Adriaensen et al. 2003).
In the absence of such information, it is typically assumed that landscape
characteristics do not matter for dispersal, and Euclidean distance is used as a measure of the degree to which any two habitat patches are connected demographically. Using a well designed resistance surface, one can replace the simple Euclidean distance model with a friction-weighted distance model derived from a least-cost algorithm. The most
challenging part of using a resistance surface is estimating biologically relevant values depicting how a species’ movements are impeded by landscape features, known as friction values (Adriaensen et al. 2003). Due to the lack of dispersal behavior information, friction values on a resistance surface are usually created with subjectively based expert opinion (Beier et al. 2009). By incorporating environmental characteristics with a resistance surface and movement data via radio telemetry, it is possible to increase the explanatory power when estimated the connectivity between species’ habitat patches in fragmented landscape and thus improve effectiveness of conservation actions.
Over 60% of the land area in the United States is privately owned (GAO 1994). Collectively, these private properties contain high wildlife diversity and provide habitat for more than 90% of the federally-protected species (Hoppe and Wiebe 2002). To ensure the persistence and recovery of federally-protected species, habitat restoration and
wildlife protection (Bingham and Noon 1998, U.S. Fish and Wildlife Service 2003, Wilcove 2004). To benefit federally-protected species on private land, incentive-based conservation program is known as Safe Harbor Program (SHP) was developed by U.S. Fish and Wildlife Service (USFWS). The USFWS strives to increase individuals’ ability and willingness to move between relatively isolated and remnant habitat patches with SHP (U. S. Fish and Wildlife Service 2004). However, the USFWS has yet to verify that this approach of enhancing habitat quality with SHP sponsored conservation actions improve connectivity.
This dissertation aims to increase the effectiveness of conservation planning by evaluating how the prospecting and natal dispersal behavior of a federally-protected species, Red-cockaded woodpecker (Picoides borealis), is influenced by the juxtaposition of natural and human-modified land-cover characteristics. Specifically, my research addresses the following objectives:
1. To empirically estimate and validate landscape resistance surfaces for P. borealis dispersal using mark-recapture and radio-telemetry data (Chapter 2)
2. To determine if and how prospecting movements are guided by environmental and conspecific (i.e., social) cues during natal dispersal. (Chapter 3)
3. To combine P. borealis dispersal behavior with detailed data on landscape structure to estimate habitat connectivity. (Chapter 4)
4. To evaluate if P. borealis connectivity is positively impacted by private landowners involvement in SHP. (Chapter 5)
Chapter Summaries
Chapter 2: Beyond expert opinion: Empirical estimation and validation of dispersal
resistance surfaces for Red-cockaded Woodpecker.
P. borealis dispersal behavior has been extensively studied with mark-recapture data. Little is known, however, about how natural and human-modified landscape features influence P. borealis prospecting and dispersal movements. In Chapter 2, I examined the interaction of dispersal behavior and landscape structure. P. borealis prospecting data obtained with radio-telemetry was used to assess how land-cover type and structure affects movements. This information was used to estimate resistance surface. The optimal resistance surface reflecting prospecting behavior was compared with independent mark-recapture dispersal data to determine if it enhanced our ability to predict dispersal behavior.
Chapter 3: Environmental and conspecific cues influencing Red-cockaded
Woodpecker prospecting behavior.
movements. To evaluate if social factors influence prospecting, I assembled conspecific information, such as group composition, from banding data collected at all territories.
Chapter 4: Calibrating connectivity estimates for Red-cockaded woodpecker
populations
The purpose of Chapter 4 was to estimate the connectivity of P. borealis. I used detailed prospecting and dispersal behavior knowledge obtained in Chapter 2 to develop an empirical estimated resistance surface. This surface was used to estimate the least-cost effective, or friction-weighted, distances between territories, which were incorporated into a graph-theory-based habitat connectivity model. The network models constructed at varying friction-weighted distances was then correlated with an extensive set of observed dispersal events, which allowed me to examine the patterns in P. borealis dispersal in terms of network topology. Finally, this biologically calibrated connectivity model, created by incorporating detailed dispersal ability data for the entire dispersing portion of the population, was used to identify which territories are necessary to maintain well connectivity and those where occupancy might be limited due to environmental barriers to dispersal.
Chapter 5: Evaluation of Safe Harbor Program influence on current and future
connectivity: Case study of the Red-cockaded Woodpecker
endangered species of various taxa with habitat restoration projects covering nearly 2 million acres nationwide (Wilcove 2004). One of the goals of the SHP is to preserve habitat connectivity. In chapter 5, I used the connectivity model created in Chapter 4 to examine whether breeding territories on properties enrolled in SHP have a greater impact on connectivity than private properties not enrolled in the SHP during current
environmental conditions and with predicted urban growth. I also prioritized private properties based on their value for improving P. borealis connectivity.
Overall Synthesis
Literature Cited
Adriaensen F., J. P. Chardon, G. De Blust, E. Swinnen, S. Villalba, H. Gulinck, and E. Matthysen. 2003. The application of 'least-cost' modelling as a functional landscape model. Landscape and Urban Planning 64:233-247.
Beatley T. 1996. Habitat Conservation Planning: Endangered Species and Urban Growth. University of Texas Press, Austin, Texas, USA.
Beier P., D. R. Majka, and S. L. Newell. 2009. Uncertainty analysis of least-cost modeling for designing wildlife linkages. Ecological Applications 19:2067-2077. Bingham B. B., B. R. Noon. 1998. The use of core areas in comprehensive mitigation
strategies. Conservation Biology 12:241.
Bonnie R. 1997. Safe harbor for the red-cockaded woodpecker. Journal of Forestry 95:17-22.
Bowler D. D. E., T. G. Benton. 2005. Causes and consequences of animal dispersal strategies: Relating individual behaviour to spatial dynamics. Biological Reviews of the Cambridge Philosophical Society 80:205-225.
Clobert J., J. O. Wolff, J. D. Nichols, E. Danchin, and A. A. Dhondt. 2001. Introduction. Pages xvii-xxi In J. Clobert, E. Danchin, A. A. Dhondt, and J. D. Nichols, editors. Dispersal, Oxford University Press, Oxford.
Costa R., S. J. Daniels. 2004. Red-cockaded woodpecker: Road to Recovery, Hancock House Publishers, Blaine, WA.
Fahrig L., G. Merriam. 1994. Conservation of fragmented populations. Conservation Biology 8:50-59.
Frost C. 2006. History and Future of the Longleaf Pine Ecosystem. Pages 9-42 In J. Shibu, E. J. Jokela, and D. L. Miller, editors. The Longleaf Pine Ecosystem: Ecology, Silviculture, and Restoration, Springer, New York, NY.
Government Accountability Office. 1994. Endangered Species Act: Information on Species Protection on Nonfederal Lands. Report NR GAO/RCED-95-16. Goodwin B. J., L. Fahrig. 2002. How does landscape structure influence landscape
connectivity? Oikos 99:552-570.
Hoekstra J. M., T. M. Boucher, T. H. Ricketts, and C. Roberts. 2005. Confronting a biome crisis: Global disparities of habitat loss and protection. Ecological Letters 8:23-29.
Hoppe R, Wiebe K. Agricultural resources and environmental indicator: Land Ownership and Farm Structure. U. S. Department of Agriculture Economic Research Service; 2002. Report nr Agriculture Handbook No. (AH722).
Kenward R. E. 2001. Historical and Practical perspectives. Pages 3-12 In J. J. Millspaugh and J. M. Marzluff, editors. Radio Tracking and Animal Populations, Academic Press, San Diego, CA.
Norris D. R., B. J. M. Stutchbury. 2001. Extraterritorial movements of a forest songbird in a fragmented landscape. Conservation Biology 15:729-736.
Peet R. K. 2006. Ecological Classification of Longleaf Pine Woodlands. Pages 51-93 In S. Jose, E. J. Jokela, and D. L. Miller, editors. The longleaf pine ecosystem:
Ecology, silviculture, and restoration, Springer Science, New York, NY. Reed J. M., T. Boulinier, E. Danchin, and L. W. Oring. 1999. Informed dispersal:
Prospecting by birds for breeding sites. Current Ornithology 15:189-259.
U. S. Fish and Wildlife Service. 2004. Safe harbor agreements for private landowners. 2007:2-2.
U.S. Department of the Interior. 1970. Conservation of endangered species and other fish or wildlife. Federal Register 199:1647-1648.
U.S. Fish and Wildlife Service. 2003. Endangered Species Act of 1973 as amended through the 108th Congress. U.S. Fish and Wildlife Service, Washington, D.C. Ward M. P. 2005. Habitat selection by dispersing yellow-headed blackbirds: Evidence of
prospecting and the use of public information. Oecologia 145:650-657. Waser P. M. 1985. Does competition drive dispersal? Ecology 66:1170-1175. Wiens J. A. 2001. The landscape context of dispersal. Pages 96-109 In J. Clobert, E.
Danchin, A. A. Dhondt, and J. D. Nichols, editors. Dispersal, Oxford University Press, New York.
CHAPTER 2
BEYOND EXPERT OPINION: EMPIRICAL ESTIMATION AND VALIDATION OF DISPERSAL RESISTANCE SURFACES FOR RED-COCKADED
WOODPECKER
Abstract
Anthropogenic activities have drastically altered the spatial configuration of ecosystems, often with negative consequences to biological diversity and wildlife
populations. For instance, populations of federally endangered Red-cockaded woodpecker (Picoides borealis) are dependent upon mature longleaf pine woodland, an ecosystem type that has been diminished to small scattered forest patches covering only 3% of its historical extent. The persistence of P. borealis populations depends upon the degree to which landscape features facilitate or impede prospecting and dispersal movements between
territories in the remaining habitat patches. Relative resistance surfaces, a common method to model and predict movement in heterogeneous environments, are usually defined
tagged bird. P. borealis visited territories that were effectively closer based on forest structure than territories not visited within their prospecting range. The preferred forest structure contained stands with a tall canopy, minimal midstory vegetation, and a slightly positively skewed distribution of vegetation heights. Our data also suggests that a non-linear
relationship between habitat preference and friction values was a better predictor of prospecting behavior than a linear transformation. The top-ranked resistance surface 25% least-cost corridors also closely corresponded to over 70% of an independent set of short-distance dispersal events. This increased knowledge of P. borealis prospecting behavior will help to identify areas necessary for maintaining habitat connectivity and to implement effective P. borealis management strategies. Further, our approach provides a framework to estimate and evaluate resistance surfaces based on species-specific responses to intervening landscape features.
Key words: Discrete-choice Models, Maxent, Natal dispersal, North Carolina, Picoides borealis, Prospecting, Radio-telemetry, Red-cockaded Woodpecker, Remote Sensing
Introduction
the importance of natal dispersal to population ecology and ecosystem management, it remains one of the least understood animal behaviors. The dearth of knowledge on natal dispersal behavior is partially due to the brevity and complexity of the phenomenon.
Natal dispersal data are typically gathered by capturing and marking juveniles at their birth sites and then attempting to recapture them at a breeding site, known as the capture-mark-recapture (CMR) method (Bowler and Benton 2005). CMR provides information about the outcome (i.e., extent and destination) of natal dispersal events, but does not capture the transient phase when the individual is searching for and evaluating potential breeding sites. CMR study areas’ finite extents and shapes also affect the accuracy of dispersal distance distribution estimates (Lahaye et al. 2001, Cooper et al. 2008). Studies only employing CMR methods to understand natal dispersal may be misleading because natal dispersal is
represented as a single abrupt movement from the natal area directly to the new breeding site and neglects the distance and route an organism actually travels (Howard 1960, Nathan et al. 2003).
Greater insight into the elusive transient phase of a species’ natal dispersal can be acquired through studies using radio telemetry (Nathan et al. 2003). Such studies have
species movement behavior responds to natural and human-modified land-cover types in order to increase the effectiveness of conservation planning designed to increase population persistence and biodiversity in human dominated landscape.
Accounting for the affects of landscape structure on dispersal begins with developing ways to depict the relative resistance of different land-cover types or land uses encountered during species’ movements. Each land-use type throughout a continuous gridded surface of the study area is assigned a friction value, which approximates how much that feature impedes or facilitates movement (Adriaensen et al. 2003). With this approach, the most important step when evaluating species dispersal behavior is the estimation of biologically relevant friction values (Adriaensen et al. 2003). However, due to the lack of detailed information about dispersal and movement behavior, friction values are usually defined subjectively based on expert opinion, or are converted from species habitat preferences during common daily activities, and therefore not representative of dispersal behavior (Schultz and Crone 2001, Schadt et al. 2002). Friction values derived from these routine movements may not accurately depict an individual’s reaction to landscape features outside their habitat because behavior may differ during dispersal through non-habitat (Palomares et al. 2000). Moreover, only a few studies, such as Driezen and collogues (2007) and
Rabinowitz and Zeller (2010), have validated friction values derived from expert opinion or daily activities with independent dispersal data.
various types of vegetation and anthropogenic objects (Hudak et al. 2002). Many wildlife species are also influenced by three-dimensional vegetation structure (MacArthur and Horn 1969, Erdelen 1984) which can be inferred and mapped using active sensors, such as LiDAR (Light Detection And Range). By combining spectral and LiDAR data, detailed maps can be created depicting spatial arrangement of land-use and land-cover types along with vertical forest structure at spatial extents suitable for modeling dispersal of many wildlife species (Lefsky et al. 1999, Hudak et al. 2002, Hyde et al. 2006). Thus, combining various remote sensing data can help parameterize landscape resistance to support models depicting dispersal through spatially heterogeneous landscapes.
We studied the prospecting strategies of the federally endangered red-cockaded woodpecker (Picoides borealis). P. borealis is endemic to mature longleaf pine (Pinus palustris) forests in the southeastern US coastal plain. The longleaf pine ecosystem has been reduced to less than 3% of its original extent, due to clearing, logging, and fire suppression (Frost 2006). High quality P. borealis habitat is characterized as containing a moderate density of mature longleaf pine trees, low density of small and medium sized pines, little or no hardwood midstory, and abundant diverse herbaceous groundcover (Conner et al. 2002, Rudolph et al. 2002, Walters et al. 2002). The dispersal behavior of P. borealis has been extensively studied with CMR methods (Daniels and Walters 2000, Kesler et al. 2010). Based on previous banding studies, it is known that P. borealis is a cooperative breeder that exhibits territorial behavior. Juvenile males often remain in their home territory as helpers for several years, assisting and caring for their parents’ subsequent offspring (Walters et al. 1988, Walters 1990, Haig et al. 1994). In contrast, juvenile females usually disperse to new
distribution, with most juvenile females dispersing less than 3.5 km and a small proportion dispersing distances as high as 31 km (Walters 1990, Kesler et al. 2010). Previous CMR research suggested that P. borealis acquire information about surrounding territories using extra-territorial forays before the final dispersal event (Pasinelli and Walters 2002). Radio telemetry data has confirmed juvenile female P. borealis conduct prospecting behavior with extensive forays from their natal territory before settling on a single breeding site (Kesler et al. 2010).
Despite the extensive P. borealis studies, little is still known about how natural and human-modified landscape features influence P. borealis prospecting and dispersal
movements. Recently, remote sensing technology has been used to identify and evaluate P. borealis habitat characteristics (Smart 2009, Santos et al. 2010). However, this is the first study to use remote sensing data to evaluate P. borealis prospecting movements and dispersal behavior in relation to surrounding land-cover characteristics. The objective of this study was to empirically evaluate which environmental characteristics, estimated with remote sensing data, create the most biologically relevant resistance surface explaining juvenile female P. borealis prospecting behavior. We then validated the best resistance surface model by examining if the resistance surface with the same environmental characteristics explaining prospecting movement can also increase our ability to predict dispersal behavior.
Methods Study Site
sandy soil interdigitated with alluvial clays in bottomlands (Peet 2006). The average
elevation in the study area is 89 m. Historically, the prevailing vegetation type throughout the Sandhills ecoregion was the fire-dependent longleaf pine forest, characterized by an open canopy with minimal hardwood midstory and dense herbaceous understory vegetation (Frost 2006, Peet 2006). Currently, the dominant vegetation types are comprised of cropland, pasture, and woodland (Griffith et al. 2007). The remaining evergreen forests are primarily composed of mixed-pine species (longleaf pine, loblolly [P. taeda], shortleaf [P. echinata], and pond pine [P. serotina]) in second-growth forest (Griffith et al. 2007). The largest tracts of federally owned longleaf pine ecosystem in North Carolina are located on Fort Bragg and Camp Mackall (Britcher and Patten 2004). These federal properties also include over 70% (n = 437) of the 604 established P. borealis territories located in the study area.
Overall Approach
We captured the varying land-cover characteristics expected to influence P. borealis prospecting and dispersal movements by combining known P. borealis locations with several types of land-cover and remote sensing data (Figure 2.1). We iteratively increased the
complexity of land-cover to evaluate which remote sensing data provided the most biologically relevant resistance surface to explain juvenile female P. borealis prospecting behavior. The simplest landscape model contains four general land-cover classes while the most complex model has additional variables depicting horizontal vegetation patterns and vertical forest structure.
approach using a machine-learning algorithm that predicts a species’ geographic distribution based on locations of known occurrences and layers of environmental data (Elith et al. 2006, Phillips et al. 2006).
For many species habitat suitability grids are converted into resistance surface with a single function, such as linear or inverse functions (Ferreras 2001, Singleton et al. 2004, Richard and Armstrong 2010). However, there is no overwhelming reason to assume that friction values for dispersal are linearly or inversely related to habitat preferences. Therefore, we tested the sensitivity of the relationship between habitat suitability and friction values for the prospecting P. borealis.
The maximum entropy model with the most variables tend to have the most accurate habitat suitability map, we used an information criterion approach based on maximum likelihood modeling to determine the most parsimonious habitat suitability model that best explains P. borealis prospecting movements to nearby territories. In addition, this approach allows us to evaluate which occupancy data and which relationship between habitat
suitability and resistance surface best fits observed movements (Figure 2.1).
addition, each fledgling emerging from its natal territory is surrounded by a unique set of environmental features that potentially influencing prospecting behavior.
Figure 2.1 Flow chart describing the methods used to evaluate varying environmental data expected to influence Red-cockaded woodpeckers (Picoides borealis) prospecting and dispersal movements.
DATA
Radio Telemetry – In spring (March – May) 2006, 18 juvenile female P. borealis that had not yet dispersed from their natal territories were captured in their roosting cavities and fitted with a 1.4 g transmitter glued to the base of 2 tail feathers (BD-2, Holohil Systems Ltd.,
Location Data
Resistance Surface
&
Least-cost Paths
Corridor to
Validating Resistance
Surface with
Dispersal Events
Habitat
Suitability
Ontario, Canada). Theses birds were tracked for the life of their radio transmitters (~ 9 wks) on the western portion of Fort Bragg, which contains the largest unfragemented tracts of longleaf pine forest on the property. In order to evaluate how P. borealis movements are affected by human-modified landscape features, we radio tagged and tracked an additional 16 individuals during 2007 in the eastern section of Fort Bragg, which consists of highly
fragmented forest surrounded by urban and agricultural land use.
We attempted to locate radio-tagged woodpeckers daily. Radio-tagged birds were ordered in a list by geographic location, and then a single individual was randomly selected to be the first daily observation. Animals were located using signal strength and direction with a receiver (R-1000, Communication Specialist, Inc. Orange, CA, USA) and a 3-element Yagi directional antenna (Wildlife Materials, Inc., Carbondale, IL, USA) When an individual was located outside its home territory we recorded a Universal
Environmental Data
Categorical Land-Cover Classification – Fort Bragg and Camp Mackall were classified into four land-cover classes (longleaf pine, other non-longleaf pine evergreens (predominately loblolly pine [P. taeda], hardwood, and non-forested [herbaceous, developed, and water]) derived from stand-based Forest Inventory Analysis Data collected in 2001. The same land-cover classes were used off the military installations, but for these areas we used the U.S. Geological Survey GAP Analysis Program land-cover database (Gap, Jennings 2000).
Landsat –Two Landsat-5 Thematic Mapper (TM) images (WRS2 Path16, Row 36) collected 12 December 2006 and 5 May 2007 were chosen to represent leaf-off and leaf-on conditions, respectively, which will allow differentiation of evergreen and deciduous canopies. The images were georeferenced to < 1-pixel root mean square error (RMSE) and atmospherically corrected to estimates of surface reflectance (Sexton 2009). These
reflectance values were used to compute three variables to determine if P. borealis responds to environmental cues related to vegetation composition.
The first variable mapped was mature evergreen forest by using the ratio of near-infrared (0.75 to 0.90 μm, TM band 4) to middle near-infrared radiance (1.55 to 1.75 μm, TM
negative relationship with stand age due to increased shadows produced by variable heights in developing stands (Wulder et al. 2004). Strong reflectance values for TM bands 4 and 5 correspond to young forest stands with low SI values. Mature longleaf pine forest stands containing minimal understory hardwood vegetation and sparse forest canopy will have higher SI values.
We created two additional variables from the Landsat image bands by transforming the reflectance values into composite bands with the Tasseled-Cap transformation (Crist and Cicone 1984). The Tasseled-Cap transformation is a linear data rotation designed to capture brightness, greenness, and wetness of plant canopies in the first composite band (Crist and Cicone 1984). We used the greenness band (Band 2) which is correlated with the amount of photosynthetically active canopy present. The difference in greenness between the two dates (May minus December) was used to map hardwood forest. Since P. borealis avoid hardwood forest for nesting habitat (Wood et al. 2008), we hypothesized that the presence of hardwood forest would impede dispersal behavior. We also evaluated if the spatial heterogeneity of summer greenness values influenced P. borealis movements by calculating the standard deviation within a 3 x 3 pixel window (8,100 m2 area) centered on each pixel. Low standard deviation of greenness indicates cells situated in large homogenous patches far from forest edges. In contrast, high standard deviation values denote cells in small segments of forest surrounded by non-forested land-cover features (i.e., agricultural fields). We expected that cells with low spatial variation in the 3 x 3 pixel window would facilitate dispersal
movements.
the state of North Carolina. The flight paths of two subcontractors overlapped our study area with varying sample density and flight altitude. The average ground spacing between LiDAR postings ranged from 2 - 2.25 m, flight altitude ranged from 914 - 1676 m, and the elevation calibration ranged from 9 - 12 cm elevation RMSE. The raw LiDAR data containing three-dimensional coordinates of laser hits were converted to raster format with Fusion software (McGaughey 2008). In Fusion, the height from the LiDAR points to the ground was calculated with digital elevation models from the North Carolina floodplain mapping
program. The LiDAR points referenced with the elevation model were used to estimate seven forest structure variables at a 30 x 30 m resolution to correspond with the Landsat raster. Within the 30 m cells, the average number of LiDAR points was the 289 (SE = 0.13, range = 4 – 10,324).
Ideally, P. borealis prefer old (> 100 years) longleaf pine trees for nesting and foraging (Conner et al. 1994, Wood et al. 2008). When longleaf pine trees greater than 100 years old are not available, P. borealis will nest and forage on longleaf pine trees greater than 60 years old and over 20 m tall while avoiding trees less than 60 years old (U. S. Fish and Wildlife Service 2003). However, if longleaf pine trees greater than 60 years old are not present, P. borealis may use longleaf pine trees between 30 and 60 years old which usually range from 13 to 20 m tall, (Platt et al. 1988, U. S. Fish and Wildlife Service 2003). P. borealis also tend to avoid forested areas with dense hardwood understory and midstory vegetation (Walters et al. 2002, Wood et al. 2008).
resolution. In order to represent the overall forest structure in a single variable, we calculated skewness of vegetation heights. Recently, Smart (2009) applied skewness of vegetation height distribution to correlated vertical forest structure with high quality P. borealis habitat. A negatively skewed distribution of vegetation heights should indicate dense forest, such as plantations or dense hardwood forests, with few canopy gaps since the greatest densities of returns come from the canopy. A forest with an open canopy and minimal midstory
vegetation, such as mature longleaf pine forest (Peet 2006), should represent as a positively skewed distribution of vegetation heights with a small but consistent density of returns depicting the canopy with the majority of the returns reaching the herbaceous vegetation in the understory.
MODELS
Maxent –Habitat suitability maps were derived from remotely sensed environmental variables based on P. borealis prospecting movements with a maximum entropy modeling approach via Maxent software (Version 3.3.1, Phillips et al. 2006). Maxent requires two types of input data, grids with environmental variables and the coordinates of species occurrences. Two separate sets of Maxent models were created to differentiate the
environmental cues associated with breeding sites versus prospecting movements (Figure 2.1). To characterize environmental conditions at breeding sites we used territory centers as occurrence data (n = 604). In contrast, environmental conditions associated with prospecting movements were identified by creating habitat suitability models using all non-natal
environmental variables. The simplest representation of the environment employed a land-cover map of four classes (longleaf pine, non-longleaf pine evergreen species, hardwood, and non-forested). To determine if vegetation composition influenced prospecting movements we created a habitat suitability map using the three Landsat-derived variables (SI, winter
greenness, and standard deviation of greenness). Three-dimensional forest structure was represented with seven variables derived from the LiDAR data. We then combined the Landsat and LiDAR data to produce a habitat suitability model. The final and most complex habitat suitability model included the four discrete land-cover classes and all ten remotely sensed environmental variables.
Each set of occurrence data was randomly divided into training (75%) and testing (25%) points. To account for variation in training and testing data sets, we used bootstrapping with 10 replicate samples with replacement for all of the Maxent models. We used
jackknifing to estimate the relative contribution of the predictor variables in each model. The model’s performance was evaluated with Area Under the Curve (AUC) of a Receiver Operating Characteristic (ROC) plot. The AUC in Maxent evaluates the performance of the model based on true-positive accuracy assessment, which is the ratio of cells correctly classified to the total number of cells classified. The AUC values range from 0 (habitat predictions worse than random) to 1 (perfect prediction of habitat), with 0.5 indicating random classification. Maxent produces a raster estimating logistic probability of habitat suitability for each cell (Phillips and Dudik 2008). Probability values near one indicate the most suitable habitat conditions while unsuitable habitat is indicated by values close to zero.
study, the source locations are the radio-tagged P. borealis roosting territories. Destination points are defined as all territories within prospecting range of 6 km, the 95th percentile of the observed foray distance from roosting sites (Kesler et al. 2010). To test various functions between habitat suitability and friction values we slightly adjusting the relationship between friction values and habitat suitability with a wide spectrum of possible non-linear
relationships (Figure 2.2). For each resistance surface, we converting Maxent’s habitat suitability values (h) into friction values (f) with the function:
. ) exp( 1 ) exp( 1 99 100 c ch f − − − − − =
A rescaling constant, c, was included in the above function to vary the relationship between habitat suitability (h) and friction values (f). We selected seven rescaling values (c), ranging from 0.25 to 16 (Figure 2.2), to produce a broad range of curves to evaluate which
Figure 2.2 The seven curves used to rescale habitat suitability values into friction values. The dash and dotted curves produced the top-ranked and second-ranked predictive rescaling for prospecting behavior, respectively.
ANALYSIS
Discrete-Choice – Discrete-choice analysis was used to determine the best set of remote sensing variables for representing P. borealis prospecting movements, while
computed the AICc weight (ω), which represents the weight of evidence in favor of a model in relation to all the models in the set (Burnham and Anderson 2002). All discrete-choice modeling was conducted with the R package Survival (Version 2.11.0, R Development Core Team 2010).
Model Validation – We evaluated the best resistance surface using an independent dataset of observed juvenile female dispersal events born in 2005 (n = 57) and 2006 (n = 39). We created corridors using the model derived from each dispersing individual. The corridor function adds the accumulated cost from all least-cost paths between the natal territory and all available territories. For each dispersal event, available territories were defined as all
territories with similar geographic distance (within the 25th percentile) from the individuals’ natal territory to the observed dispersal destination territory (Figure 2.3). The threshold distance for natal territory was set as maximum distance any juvenile female was observed dispersing from the natal territory during all the years of banding data. Within this analysis we assessed if P. borealis short-distance dispersers interact with the environment differently than long-distance dispersers. We defined the long-distance threshold at 6 km, the 95th
Figure 2.3 An example of a juvenile female Red-cockaded woodpecker (Picoides
borealis) that dispersed to a breeding territory within the 25% least-cost corridor derived from the top-ranked resistance surface.
Results
Radio telemetry – Radio tracking effort in 2006 and 2007 produced an average of 40 (SE = 4.88) and 121 (SE = 25) locations per individual, respectively. The majority of these locations (68.1% for 2006 and 78.2% for 2007) were defined as prospecting movements (i.e., away from the roosting territory). We observed prospecting individuals conducting 282 and 533 territory visits in 2006 and 2007, respectively. The number of visits ranged from 1 to 23 territories per female, and 49% of the individuals visited a non-natal territory multiple times.
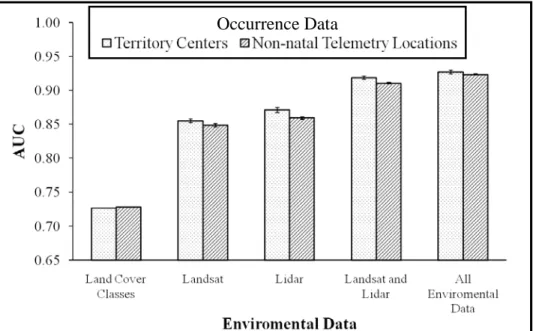
threshold for useful Maxent models (Elith et al. 2006) All other habitat suitability models reached AUC values > 0.85, with AUC increasing with complexity of remote sensing data (Figure 2.4). The combination of Landsat and LiDAR data increased the Maxent model’s AUC by 5% relative to either data source alone. The most complex habitat suitability model (discrete land-cover data, Landsat and LiDAR data) contained a slightly higher AUC (Figure 2.4). Maxent models trained with environmental data at breeding sites had slightly greater AUC values than models trained with environmental variables at prospecting locations (Figure 2.4).
Figure 2.4 The Area Under the Curve (AUC; +/- SE bars) for each Maxent model.
Discrete-choice Analysis – Euclidean distance was a very poor predictor of prospecting behavior (Table 2.1). The resistance surfaces derived from the four categorical land-cover classes slightly increased our ability to predict prospecting behavior (model ranked 48 out of 71, Table 2.1). The top 17 models, according to AICc, explained
Table 2.1 The ranking of discrete-choice models describing juvenile female Red-cockaded woodpecker (Picoides borealis) prospecting behavior in relation to habitat suitability models constructed with environmental and occurrence data (in Maxent) along with varying friction values converted with rescaling constants (c ) in the Sandhills region of North Carolina. Maxent Model Ranka Occurrence Data Environmental Data Rescaling
Constant AICcb ΔAICcc ωd 1
Telemetry
LiDAR 4 5478.58 0.00 0.70
2 LiDAR 8 5480.34 1.76 0.29
3 LiDAR 2 5488.05 9.47 0.01
4 LiDAR 1 5499.41 20.83 0.00
5 LiDAR + Landsat 2 5509.09 30.51 0.00
6 LiDAR 0.25 5509.69 31.12 0.00
7 LiDAR 0.5 5512.35 33.76 0.00
8 LiDAR + Landsat 1 5513.83 35.25 0.00
9 LiDAR 16 5519.42 40.84 0.00
10 LiDAR + Landsat 4 5520.48 41.89 0.00
15 Telemetry All Environmental data 0.25 5554.00 75.42 0.00
18 Territory Landsat 16 5563.02 84.44 0.00
48 Telemetry Land-cover Classes 0.5 5607.29 128.71 0.00
56 Euclidean Distance (m) 5620.01 141.43 0.000
a
Rank is out of the 71 models, other models in the shaded box with lower rank are identified for purpose of discussion
b
Akaike’s Information Criterion adjusted for small sample size. c
Difference in the value between AICc of the current model and the value for the most parsimonious model.
d
Resistance Surface – By combining the maximum entropy and discrete-choice modeling approaches we were able to evaluate how specific vegetation structure influences movement behavior. For example, forest structure parameters with the greatest contribution in the top-ranked resistance surface were percent cover of the midstory vegetation (1 – 8 m), maximum vegetation height, and the skewness of the vegetation height distribution for both LiDAR sensors (Figure 2.5). While LiDAR-derived median vegetation heights and percent cover classes greater than 8 m contribute less than 15% to the forest structure habitat suitability model. Prospecting individuals tend to avoid areas containing even small
Figure 2.5 The probability of Red-cockaded woodpeckers (Picoides borealis) presence based on average habitat suitability (red line) and a standard error (blue shading) based on forest structure variables located at non-natal telemetry locations during 2006 and 2002007 in the Sandhills of North Carolina. The percent contribution (PC) is also provided for each variable in the top-ranked habitat suitably model.
Figure 2.6 Box plot of percent midstory cover (1 to 8 m) in relation to habitat suitability and the friction value in the top-ranked model predicting Red-cockaded woodpecker (Picoides borealis) prospecting movements. The line indicates the top-ranked rescaling constant explaining the relationship between friction values and habitat suitability.
Model Validation –Very few individuals in our independent validation dataset dispersed to territories located in corridors with high (> 50th percentile) cumulative cost distances, even when they were at similar straight-line distances from the natal territory as territories with lower cost-distance (Table 2.2). For both years of independent dispersal data,
over 60% of the individuals selected territories within the 25th percentile least-cost corridor (Table 2.2). There was a sharp decline in the number of dispersals to territories at greater
friction-weighted distances from the natal territory even though the territories were located on wider corridors. Greater than 75% short-distance dispersal events for both years fell within the 25% least-cost corridor (Table 2.2). Long-distance dispersal prediction accuracy was
Table 2.2 The percentage of short-distance (SDD) and long-distance (LDD) dispersers that settled into territories within four corridor widths, determined by least-cost
percentiles from a resistance surface based on non-natal telemetry locations, forest structure and a moderate rescaling constant (c = 4).
Percentile
Corridor SDD LDD Total
0 – 25 76 % 47 % 65 %
25 – 50 21 % 39 % 28 %
50 – 75 3 % 11 % 6 %
75 – 100 0 % 3 % 1 %
Discussion
Juveniles prospecting for breeding sites may have limited or no experience with environmental features located outside their natal area (Ward 2005, Stamps 2006). Thus, we expected that individuals searching for suitable breeding habitat would seek out
environments similar to their natal habitat to quickly and efficiently locate and evaluate reproductive potential of breeding sites (Davis and Stamps 2004). However, environmental characteristics at the center of active territories (in contrast to data from telemetry locations) did not strongly predict P. borealis prospecting movements (Table 2.1). Instead, P. borealis prospecting movements were strongly influenced by forest structure encountered away from the home territory. P. borealis preferred to pass through forests stands with an average canopy height of approximately 20 m, and less than 20% midstory cover (Figure 2.5). Movements were moderately reduced through forested areas with abundant midstory cover and strongly inhibited by open or developed areas (Figure 2.5).
(Hooper et al. 1991, Rudolph et al. 2002, Walters et al. 2002, Jackson and Jackson 2004). For many tree species, age is strongly correlated with heights derived from LiDAR data (Lefsky et al. 2002, Hyde et al. 2005, Goetz et al. 2010). However, longleaf pine age is a better predictor of P. borealis breeding habitat than height because the correlation between age and height rapidly diminishes when longleaf pine trees reach 60 years old (Platt et al. 1988, Zwicker and Walters 1999). A habitat specialist breeding sites may not be adequate to model a species reaction to a wide variety of landscape characteristics located away from the breeding site. The resistance surface could become similar to a binary map where all of the specific breeding habitat landscape features are assigned very low friction values and any landscape feature not similar to breeding sites would be assigned very high friction values. Therefore, a resistance surface models derived from breeding sites would not capture the subtle variation between high quality breeding habitats and environments unsuitable for breeding but nonetheless traversable by dispersing individuals.
Prospecting P. borealis movement behavior did correspond to habitat characteristics associated with non-natal telemetry location. These habitat characteristics matched
density of points consistently hitting the tall sparse canopy of longleaf pine trees while majority of the points reaching the herbaceous understory. This finding supports previous research reporting that P. borealis habitat quality is related to multiple forest structure characteristics and is difficult to represent with a single variable (Walters et al. 2002).
Similar to most federally listed species, limited information about P. borealis biology and habitat requirements was available upon listing. Over time P. borealis has become extensively researched throughout its geographic range with several long-term monitoring projects (Costa and Daniels 2004), resulting in intensive management practices based on this research, usually conducted in breeding territories and adjacent foraging areas (Conner et al. 2001, U. S. Fish and Wildlife Service 2003). Our results suggest that persistence of healthy P. borealis populations also requires management to extend beyond territories. Specifically, environments between established populations and between territories within populations should encourage P. borealis movements by managing evergreen forest with reduction and removal of dense midstory vegetation. These extra-territorial conservation actions will encourage the exchange of individuals between habitat patches necessary to sustain populations.
environmental features using multiple resistance surfaces with varying complexity of environmental features and a range of friction values (Ricketts 2001, Adriaensen et al. 2003, Beier et al. 2008). When we applied this approach the simplest models based on Euclidian distance or general land-cover classes performed poorly relative to more complex models created with remotely sensed data. The best resistance surface explaining P. borealis prospecting behavior focused only on forest structure and adding further environmental complexity to this model did not improve performance (Table 2.1). Verbeylen and
colleagues (2003) reported a similar trend in data complexity when explaining red squirrel (Sciurus vulgaris) movements across a resistance surface with a similar parsimony approach (AIC model selection). The moderately complex landscape predicted red squirrels’ dispersal better than the most complex resistance surface.
Figure 2.2). In contrast, habitat suitability between 0.3 and 0.6 contain a wider range of friction values (over 20 friction units).
This is the first study to estimated resistance surfaces via a maximum entropy approach. Maxent’s maximum entropy algorithm estimates the species distribution by finding the maximum entropy (i.e., closest to uniform) distribution, constrained by the environmental data associated with known locations of the species (Phillips et al. 2006). There are many advantages to using this approach when creating resistance surfaces to evaluate species movements in heterogeneous landscapes. Maximum entropy is a non-parametric approach that requires presence-only data (Phillips et al. 2006, Phillips et al. 2006). In addition, Maxent software provides a logistic output model estimating the probability of presence or habitat suitability (Phillips and Dudik 2008) that can be easily converted into many different
resistance surfaces. This flexibility allows researchers to evaluate small changes in movement behavior due to fine detailed landscape features within varying quality of habitat patches. In addition, the habitat suitability models are easily extrapolated beyond the observed
occurrences to the extent of available environmental data.
patterns and improve our ability to design management strategies, and do so in a more rigorous way than relying solely on expert opinion.
Because of the historical banding data collected in our study area, we were able to validate our top-ranked resistance surface model against an independent dataset of capture-mark-recapture dispersal events. In one of the few recent studies to validate resistance surfaces with empirical data, Driezen and colleagues (2007) correctly predicted
approximately one third of hedgehogs’ (Erinaceus europaeus) dispersal routes based on the best resistance surface, a result similar to our long-distance dispersal results. However, most of the short-distance dispersing P. borealis selected breeding sites within the lowest 25% least-cost path created from the resistance surface. This result suggests that short-distance dispersers are strongly affected by forest structure represented in the resistance surface. Long-distance dispersers were much less consistently associated with the 25% least cost path, suggesting that they are not as strongly influenced by environmental features during
dispersal, or the environmental cues affecting long-distance movements are not represented in our resistance surfaces. This is also consistent with recent empirical results showing that long-distance dispersal involves behavior (i.e., jumping) distinct from that of short-distance dispersers or forays (Kesler et al. 2010). The limited ability for the Driezen and colleagues (2007) study or our study to predict long-distance dispersal events could be due to
particularly vital for P. borealis management because the remaining longleaf pine forest patches are usually too small to sustain viable P. borealis populations.
Conclusion
A common approach to predict how natural and human-modified land covers affect animal movements is to rank land-use types according to expert opinion and
published literature (Beier et al. 2009). Resistance surfaces generated from expert opinion usually assign habitat patches the smallest friction values without considering varying habitat quality. For P. borealis, most information available through expert opinion and published literature focuses primarily on forest characteristics within and near territories, and our study shows that movement behaviors are strongly influenced by subtle
environmental changes encountered away from their natal sites. A species’ reaction to landscape characteristics outside natal and breeding sites may be important when
estimating friction values for a resistance surface. As a result, resistance surfaces derived solely from expert opinion may not adequately represent prospecting and dispersal behavior. Our results suggest that short-distance dispersing individuals were strongly influenced by vegetation structure and land-use activities while long-distance dispersing individuals were less affected by the surrounding environments.
features. Resistance surfaces, like all models, are a simplified representation of part of the real world. Therefore, we validated the performance of the best resistance surface with independent dispersal data. This validation provides additional confidence in the resistance surface to represent movement behavior for future conservation efforts in fragmented landscapes.
Acknowledgments
Literature Cited
Adriaensen F., J. P. Chardon, G. De Blust, E. Swinnen, S. Villalba, H. Gulinck, and E. Matthysen. 2003. The application of 'least-cost' modelling as a functional landscape model. Landscape and Urban Planning 64:233-247.
Beier P., D. R. Majka, and W. D. Spencer. 2008. Forks in the road: Choices in procedures for designing wildland linkages. Conservation Biology 22:836-851.
Beier P., D. R. Majka, and S. L. Newell. 2009. Uncertainty analysis of least-cost modeling for designing wildlife linkages. Ecological Applications 19:2067-2077. Bowler D. D. E., T. G. Benton. 2005. Causes and consequences of animal dispersal
strategies: Relating individual behaviour to spatial dynamics. Biological Reviews of the Cambridge Philosophical Society 80:205-225.
Britcher J. J., J. M. Patten. 2004. Red-cockaded woodpecker management on Fort Bragg: Then and now. Pages 116-126 In R. Costa and S. J. Daniels, editors. Red-cockaded woodpecker: Road to Recovery, Hancock House Publishers, Blaine, WA.
Burnham K. P., D. R. Anderson. 2002. Model selection and multimodel inference: A practical information-theoretic approach. Springer-Verlag, Inc., New York, New York, USA.
Clobert J., J. O. Wolff, J. D. Nichols, E. Danchin, and A. A. Dhondt. 2001. Introduction. Pages xvii-xxi In J. Clobert, E. Danchin, A. A. Dhondt, and J. D. Nichols, editors. Dispersal, Oxford University Press, Oxford.
Conner R. N., D. C. Rudolph, D. Saenz, and R. R. Schaefer. 1994. Heartwood, sapwood, and fungal decay associated with Red-cockaded woodpecker cavity trees. The Journal of Wildlife Management 58:728-734.
Conner R. N., D. C. Rudolph, and J. R. Walters. 2001. The Red-cockaded Woodpecker: Surviving in a fire-maintained ecosystem. University of Texas Press, Austin, TX. Conner R. N., C. E. Shackelford, R. R. Schaefer, D. Saenz, and D. C. Rudolph. 2002.
Avian community response to southern pine ecosystem restoration for red-cockaded woodpeckers. The Wilson Bulletin 114:324-332.
Cooper C. B., S. J. Daniels, and J. R. Walters. 2008. Can we improve estimates of juvenile dispersal distance and survival. Ecology 89:3349-3361.