https://www.phoenixpub.org/journals/index.php/jaar
1
Journal of Applied and Advanced Research, 2018: 3(1) 17http://dx.doi.org/10.21839/jaar.2018.v3i1.128
ISSN 2519-9412 / © 2018 Phoenix Research Publishers
Review Article – Physics
Spectroscopic, thermal, second order and third order NLO studies of N, N’ -dimethyl urea
crystal
U. Rajesh Kannan
1٭, G.Narayanasamy
1, S. Subramanian
2, P. Selvarajan
31Department of Physics, Kamaraj College, Tuticorin-628003, Tamilnadu, India. 2Department of Physics, MDT Hindu College, Tirunelveli-627010, Tamilnadu, India.
3Department of Physics, Aditanar College of Arts and Science, Tiruchendur-628216, Tamilnadu, India.
(Received: 21-12-2017; Accepted 19-01-2018; Published Online 23-01-2018)
٭Corresponding author
Abstract
Nonlinear optical (NLO) crystals are classified into organic, inorganic and semi organic crystals and these crystals are used in the fields of optical communication, optical computing, frequency doubling, optical data processing and opto electronics. In this work an organic NLO crystal namely DMU crystal was prepared. Slow evaporation technique was adopted to grow the single crystals of DMU after the growth period of 35 days. The harvested crystals have been subjected to various characterization techniques like XRD, FTIR, FT-Raman, TG/DTA, SHG, EDAX, impedance, optical and Z-scan studies. From the studies, is observed that DMU crystal has orthorhombic structure and it has the melting point at 105 oC and has the decomposition point at 275 oC. The relative SHG efficiency of DMU crystal was found to be more than one and third order NLO parameters were evaluated. The optical band gap of DMU crystal was found to be 5.008 eV.The results from various studies were analyzed.
Keywords: Solution method, XRD, NLO, FTIR, FT-Raman, SHG, EDAX, TG/DTA, Impedance, Z-Scan, Spectroscopy
Introduction
The crystals are grown to understand their scientific and technological usefulness. Many new organic crystals have been found based on the predictive molecular engineering approach and have been shown to have potential applications in nonlinear optics and these materials find wide application in telecommunication, frequency mixing, optical parametric oscillation, optical bi-stability, optical image processing and under water communication etc [1-4]. The advantage of the organic materials is that they offer high degree of synthetic flexibility to tailor their optical properties through structural modification and exhibit very high laser damage threshold. The inability of organic materials to grow to large crystal sizes impedes device fabrication. Organic materials exhibit excellent nonlinear optical (NLO) properties because of their electronic structure with π conjugated systems between donors and acceptors .This is due to non-centrosymmetry leading to huge NLO efficiency, exhibited by organic materials on the order of 10 to 100 times larger than that of inorganic NLO materials through macroscopic second order NLO response. The strong charge transfer between such groups operating across the entire extended system markedly adds to the optical nonlinearity of the structure [5-8].
Urea derivatives are notable organic compounds and some of the urea derivatives are mono methyl urea, phenylurea, urea L-malic acid and urea L-tartaric acid have been investigated for NLO applications [9-11]. 1, 3-Dimethyl urea is also a urea derivative organic compound obtained from urea by replacing two hydrogen atoms of two NH2 groups by CH3 groups. It has one H-donor site and two acceptor sites and it is capable of forming multiple hydrogen
bonds. It is also called as N-N’dimethyl urea (DMU) used for synthesis of caffeine, theophylline, pharmachemicals, textile aids, herbicides and others. In the textile processing industry, it is used as intermediate for the production of formaldehyde-free easy-care finishing agents for textiles and it has NLO properties [12, 13]. Study on the effect of 1, 3 dimethyl urea doping on the properties of L-arginine phosphate monohydrate and KDP crystals have been reported [14, 15]. From the literature survey, it is observed that the various studies like XRD studies, thermal studies, impedance studies, second order and third order NLO studies, FTIR and FT-Raman studies, optical studies, EDAX studies of 1,3- dimethyl urea (N, N’ dimethyl urea) crystals have not been detailed and hence this paper aims to report the various studies of title crystal here.
Materials and methods
Crystal growth
The title compound was grown in single crystal form by taking the GR grade N-N’ dimethyl urea dissolved in double distilled water in an air tight container kept on the hot-plate magnetic stirrer. The solution was kept on a hot plate magnetic stirrer and stirred well for about 2 hours and by adding the salt into the solution, the saturated solution was prepared. The solubility of the solution was reduced by adding ethyl alcohol and supersaturated solution was obtained.
https://www.phoenixpub.org/journals/index.php/jaar
2
Table 2: Powder XRD data for DMU sample
Peak No. 2θ (degrees) Relative intensity (%) hkl d (Å)
1 17.7920 100 021 4.982
2 21.5704 42.49 111 4.118
3. 23.7095 46.39 020 3.751
4. 24.9680 27.70 112 3.564
5 31.2461 42.06 040 2.861
6 32.6855 7.420 041 2.739
7 36.2639 4.250 042 2.476
8 38.0631 8.010 133 2.363
9 42.7211 2.620 221 2.120
10 44.7001 4.950 151 2.026
11 46.6593 3.280 152 1.946
12 48.2785 2.610 044 1.884
13 51.4971 11.30 062 1.774
14 55.0955 2.250 153 1.666
Table 3: Observed absorption frequencies and their assignments for dimethyl urea crystal
S. No. FTIR(cm-1) FT-Raman (cm-1) Band assignments
1 3352.28 - as N-H
2 3058.81 - NH2 symmetric stretching
3 2958.06 - as CH3
4 2886.09 - s CH3
5 2807.73 - s CH3
6 2728.56 - CH2 stretching
9 1638.64 1600.08 (CO)
10 - 1524.92 s(NH)
11 1423.54 1433.36 sCH3
13 1280.40 - as (CN) amide
14 1172.45 1141.09 as CH3
15 1043.71 1001.55 as N-H
16 935.76 - s(CN)amide
17 - 897.60 s C-N
18 785.42 - NO deformation
19 677.47 - C-H out of plane deformation
20 - 313.06 as N-H
21 209.10 s N-H
two times and after a growth period of 35 days, a very few crystals of N-N’ dimethyl urea were harvested. The harvested crystal of the title compound is shown in the figure. 1 and the structural formula of DMU crystal is shown in the Figure 2.
Fig. 1: Photograph of the grown DMU crystal
Characterization methods
Powder XRD analysis was also carried out using a Rich Seifert diffractometer with Cu K (λ=1.54059 Å) radiation.
A Fourier transform infrared (FTIR) spectrometer was used
to record the infrared spectrum in the wave number range 400-4000 cm-1 and the model of the instrument used was Perkin Elemer RXI spectrometer.
Fig.2: Structural formula of DMU crystal
https://www.phoenixpub.org/journals/index.php/jaar
3
oxygen in the grown sample, the crystal was characterizedby EDAX technique. In the present work an energy dispersive spectrometer (OXFORD ISIS-300 system) was used to identify the presence of the elements. The impedance properties of the sample were determined using an impedance analyzer (PSM Impedance Analyzer 1734) from 100 Hz to 1 MHz.
Results and Discussions
X-ray diffraction studies
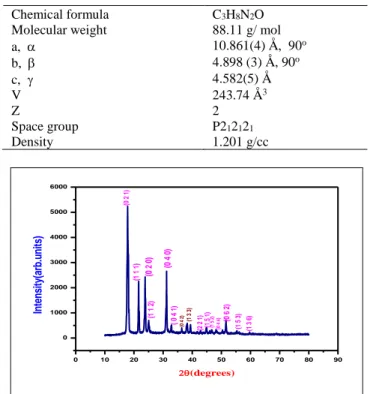
The grown crystal of DMU was analyzed by single crystal XRD method and the relevant data were collected using a Bruker Kappa Apex II X- ray diffractometer with Mo Kα radiation (λ= 0.71069 Å). The obtained single crystal XRD data are given in the table 1 and from the data it is observed that the DMU crystal crystallizes in orthorhombic structure. To confirm the lattice parameters and diffraction planes of the crystal, powder XRD pattern for the sample was recorded using the powder X-ray diffractometer employing CuKα radiation and is presented in the figure 3. Appearance of sharp and strong peaks confirms the good crystallinity of the grown sample and the XRD pattern was indexed [17] using the INDEXING software package. To confirm the unit cell parameters, the UNITCELL software package was used. The obtained powder XRD data for DMU crystal are provided in the table .2 Using the crystallographic data, the density of DMU crystal was determined using the relation = M Z / N V where M is the molecular weight, Z is the number of molecules per unit cell, N is the Avogadro’s number and V is the volume of unit cell. The calculated density was found to be 1.201 g/cc.
Table 1: Single crystal XRD data for DMU crystal
Chemical formula C3H8N2O
Molecular weight 88.11 g/ mol
a, 10.861(4) Å, 90o
b, 4.898 (3) Å, 90o
c, 4.582(5) Å
V 243.74 Å3
Z 2
Space group P212121
Density 1.201 g/cc
0 10 20 30 40 50 60 70 80 90 0 1000 2000 3000 4000 5000 6000 (0 2 1 ) (1 3 6 ) (1 5 3 ) (0 6 2 ) (0 4 4 ) (1 5 2 ) (1 5 1 ) (2 2 1 ) (1 3 3 ) (0 4 2 ) ( 0 4 1 ) (0 4 0 ) (1 1 2 ) (0 2 0 ) (1 1 1 ) In te ns ity (a rb .u ni ts ) (degrees)
Fig.3: XRD pattern of DMU crystal
FTIR and FT-Raman spectroscopic analyses
Spectroscopic methods such as FTIR method and FT-Raman method were used to find the molecular groups of the sample. The molecular formula of the sample can be obtained after finding the functional groups of the molecules
of the sample. The presence of water of crystallization in the grown crystal can be checked by these spectroscopic methods [18, 19]. The FTIR spectrum was recorded using an FTIR spectrometer and FT-Raman spectrum was recorded using an FT-Raman spectrometer. The recorded FTIR spectrum and FT-Raman spectrum of DMU crystal are shown in the figures 4 and 5. The band at 3352.28 cm-1 is corresponding to stretching vibration of s N-H group and the band at 3050.81 cm-1 is due to NH
3+symmetric stretching . The band at 2958.06 cm-1 is due to
as CH3 group and the band at 2886.09 cm-1 is due to
s CH3. The band at 2807.73 cm-1 is corresponding to CH
2 group. The bands at 2728.56 and 2599.82 cm-1 are corresponding to symmetric and asymmetric stretching of CH bondings.The band around 1638.64 to 1600.08 cm-1 has high contribution from (CO), Contributions from (CN) and (NH) are found to be appreciable in the bands around 1524.9, 1433.3 cm-1. The bands around 775 and 550 cm-1 are tentatively assigned to the out of plane (CO) and (NCO) vibrations. The various peaks/bands of FTIR and FT-Raman spectra have been given the frequency assignments and the complete assignments are given in the Table 3.
UV-visible-NIR spectral studies
UV-Visible spectroscopy is an important tool to find the linear optical constants and optical band gap of the sample. The optical absorption spectrum of the sample was recorded using a UV-visible spectrophotometer in the wavelength
range 200-800 nm. The recorded UV-visible-NIR
absorbance spectrum of DMU sample is shown in the figure 6. The result shows that DMU crystal has good transmission in the visible-NIR regions and has high absorbance at 248 nm which indicates the lower cut-off wavelength of the material. The optical band gap for the grown DMU crystal was determined using the relation Eg = 1242 / λ. Here λ is the cut-off wavelength in nm. The calculated value of optical band gap is 5.008 eV. In the visible region of the spectrum, the sample has low absorption and it can be used for generating harmonic frequencies [20]. The values of transmittance (T) were determined using the relation A= log (1/T) where A is the absorbance. The absorption coefficient () of the sample was calculated using the following relation.
4000 3500 3000 2500 2000 1500 1000 500
0 10 20 30 40 50 (6 77 .4 7) (7 85 .4 2) (9 35 .7 6) (1 04 3. 71 ) (1 17 2. 45 ) (1 28 0. 40 ) (1 42 3. 54 ) (1 64 8. 64 ) (2 23 3. 58 ) (2 59 9. 82 ) (2 72 8. 56 ) (2807.73) (2886.05) (2 95 8. 06 ) (3 05 8. 81 ) (3 35 2. 28 ) (3 85 4. 46 ) % T ra n sm it ta n ce
Wavenumber(cm-1)
Fig.4: FTIR spectrum of DMU single crystal
xlog (1/T)) / (d)
https://www.phoenixpub.org/journals/index.php/jaar
4
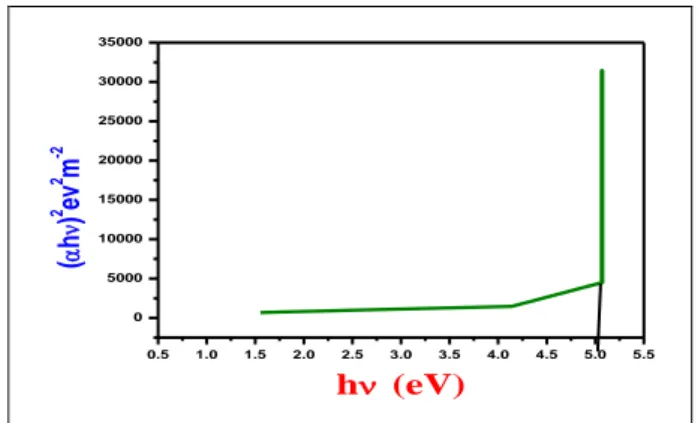
evaluated from the Tauc’s equation as given below.hhg
The Tauc’s graph was plotted between variation of (h) 2 versus (h) and it is shown in Fig.7 and the band gap energy was calculated by extrapolation of linear part to the X-axis. The band gap energy is found to be 5.01 eV. Extinction coefficient (K) is the fraction of light lost due to scattering and absorption per unit distance in a participating medium. The extinction coefficient is calculated using following the relation [21].
The extinction coefficient as a function of wavelength is depicted in Fig.8 and the plot shows that the extinction coefficient increases with increase of wavelength beyond the cut-off wavelength at 248 nm. The extinction coefficient is low for the sample and hence the title sample could be used in opto-electronic devices.
0 200 400 600 800 1000 1200 1400 1600 1800
0 5000 10000 15000 20000 25000 (3 1 3 .0 6 ) (1 6 0 0 .0 8 ) (1 5 2 4 .9 2 ) (1 4 3 5 .3 6 ) (1 3 8 8 .5 8 ) (1 1 4 1 .0 9 ) (1 0 0 1 .5 5 ) (8 9 7 .6 0 ) (4 7 4 .1 8 9 ) (2 0 9 .1 0 ) (1 4 7 .9 3 ) R a m a n i n te n s it y( a .u ) Wavenumber(cm-1 )
Fig.5: FT-Raman spectrum of DMU single crystal
The extinction coefficient as a function of wavelength is depicted in Fig.8 and the plot shows that the extinction coefficient increases with increase of wavelength beyond the cut-off wavelength at 248 nm. The extinction coefficient is low for the sample and hence the title sample could be used in opto-electronic devices.
200 300 400 500 600 700 800
0.0 0.5 1.0 1.5 2.0 2.5 3.0 3.5 4.0 A bs or ba nc e( ar b. un its ) Wavelength(nm)
Fig. 6: UV-visible-NIR spectrum of DMU crystal
Second order NLO studies
The Kurtz and Perry powder SHG method is used to measure the SHG efficiency of the grown DMU crystal and SHG is a second order NLO property [16]. In this method, powdered sample is densely packed in a capillary tube and
irradiated with high intense infrared beam produced by a Q-switched Nd-YAG laser of wavelength 1064 nm with a pulse width of 8 ns and a repetition rate of 10 Hz.
0.5 1.0 1.5 2.0 2.5 3.0 3.5 4.0 4.5 5.0 5.5 0 5000 10000 15000 20000 25000 30000 35000 ( h ) 2 ev 2 m -2
h (eV)
Fig.7: Plot of (h) 2 versus optical energy for the DMU crystal
200 300 400 500 600 700 800
0.00000 0.00002 0.00004 0.00006 0.00008 0.00010 0.00012 K (nm)
Fig.8: Plot of variation of extinction coefficient with wavelength for DMU crystal
Potassium dihydrogen orthophosphate (KDP) crushed into sample of identical size is used as reference material. The output of laser beam having the bright green emission of wavelength 532 nm confirms the second harmonic generation output. The obtained relative SHG efficiency of DMU crystal is 1.15. The output from SHG test confirms that DMU crystal is a second order NLO material. The relevant data obtained from the SHG experiment are provided in the table 4.
Table 4: The obtained SHG data for DMU crystal
Sl. No.
Name of the sample
Output energy ( milli joule)
Input energy (joule)
1 DMU 10.24 0.70
2
KDP
(Reference) 8.91
0.70
Elemental analysis
https://www.phoenixpub.org/journals/index.php/jaar
5
states. In this method, the X-rays produced as a result of theelectron beam interactions with the sample are detected to analyze it. The X-ray data is processed to obtain the percentage of each measured element present in the sample [22]. In the present work an energy dispersive spectrometer (OXFORD ISIS-300 system) was used to identify the presence of the elements. Fig.9 shows the EDAX spectrum of DMU crystal. The elements like oxygen, nitrogen and carbon were detected in DMU crystal. The experiment shows that no other impurities have entered into DMU crystal during the solution growth.
0.5 1.0 1.5 2.0 2.5 3.0 3.5 4.0 4.5 5.0
keV 0
2 4 6 8 10 12 14 16 18 cps/eV
C N O
Fig.9: EDAX spectrum of DMU crystal
Thermal stability of the sample
Thermogravimetric and Differential Thermal analyses (TG/DTA) give information regarding as the phase transition temperature, melting point and the weight loss of the grown crystal, water of crystallization and different stages of decomposition of the sample [23].
0 100 200 300 400 500 600
0 20 40 60 80 100
Temperature/oC
TG
/%
-0.5 0.0 0.5 1.0 1.5 2.0 2.5 3.0 3.5
D
TA
/(m
W
/m
g)
Fig.10: TG/DTA curves of DMU crystal
The recorded TG’DTA thermal curves for DMU crystal are presented in the figure 10. From the thermal curves, it is the clear indication of melting point of DMU crystal at 105 oC, at which there is no weight loss of the sample. The
endothermic peat at 278 oC is corresponding to the decomposition of the sample because there is a huge weight loss at this temperature. The emission of gaseous particles is noticed in the temperature range 300-600 oC. Hence, there are three thermal processes are taking place in the sample and they are melting, decomposition and emission of gaseous particles from the sample. The sharpness of the endothermic peaks shows good degree of crystallinity of the grown DMU crystal.
Electric impedance spectroscopy
The impedance is the electrical opposition to the current when an AC voltage applied to a sample and it is the resistance and reactance of the electrical components.
0 1 2 3 4 5 6
-2.00E+009 0.00E+000 2.00E+009 4.00E+009 6.00E+009 8.00E+009 1.00E+010 1.20E+010
Z'
(o
hm
)
Log f
Fig.11: Variation of real part of impedance as a function of log frequency for DMU crystal at 30 oC
0 1 2 3 4 5 6
0.00E+000 -1.00E+010 -2.00E+010 -3.00E+010 -4.00E+010 -5.00E+010 -6.00E+010
Z'
'(o
hm
)
log f
Fig.12: Variation of imaginary part of impedance as a function of log frequency for DMU crystal at 30 oC
The frequency dependent properties of a material are represented as complex impedance Z* and which is related as Z *(ω) =Z’-jZ’’ where Z’ and Z’’ are the real and imaginary components of impedance [24]. The variation of real part of impendence (Z’) and imaginary part of impedance (Z’’) with frequencies at temperature 30oC are shown in the Figures 11 and 12.
From the result it is observed that the real and imaginary part of impedance decreases with the increase in frequency. The high value of impedance at low frequency indicates low ionic mobility in the grown DMU crystal. The peaks in the plots of impedance versus frequency are corresponding to relaxation process and the peak frequency is equal to relaxation frequency. It is observed that the values of impedance of the sample are very low in the high frequency region and this is due to decrease of different types of polarization taking place in the sample.
Third order NLO studies
https://www.phoenixpub.org/journals/index.php/jaar
6
of the sample position. When both open aperture and closedaperture methods are used for the measurements, the ratio of the signals determines the nonlinear refraction of the sample. The theory part of Z-scan technique is given elsewhere [25, 26]. The Z-scan curves for the sample are shown in the Figures 13 and 14.
0 1 2 3 4 5
16.0 16.5 17.0 17.5 18.0 18.5 19.0 19.5 20.0
N
or
m
al
iz
ed
T
ra
ns
m
itt
an
ce
(a
rb
.u
ni
ts
)
Z(mm)
Fig.13: Open aperture Z-scan curve for DMU crystal
-2 0 2 4 6 8 10 12 14 16
14 16 18 20
No
rm
al
ize
d Tr
an
sm
itt
an
ce
(a
rb
.un
its)
Z(mm)
Fig.14: Closed aperture Z-scan curve for DMU crystal
In the closed Z-scan curve, there is a peak followed by a valley and it corresponds to the signature of negative nonlinearity. The calculated value of the nonlinear refractive index (n2) is - 5.382 x 10⁻¹¹ m2/W. As sample has positive refractive index, it results in focusing nature of the material. From open aperture Z-scan curve, it can be observed that the valley lies beyond the focus and the nonlinear absorption is coefficient is found to be 4.158 x 10⁻⁴ m/W. Third order susceptibility of DMU crystal is 7.262 x 10⁻⁷ esu. The value of (χ(3)) is found to be larger and it is due to the π electron cloud movement from the donor to acceptor which makes the molecule highly polarized.
Conclusions
Single crystals of dimethyl urea were grown form aqueous solution by slow evaporation technique. The X-ray diffraction studies confirm the orthorhombic structure of the grown DMU crystal. The FTIR and FT-Raman analyses confirm the presence of various functional groups present in DMU crystal. UV-Vis NIR spectrum confirms its suitability for SHG application. TG/DTA reveals that this compound is thermally stable up to 105 oC. SHG studies reveal that DMU crystal is the promising material for NLO applications. Energy Dispersive X-ray analysis is used to identify the elemental composition of material. Third order NLO parameters for the sample were determined by Z-scan
method.The impedance spectrum results have been used to estimate the electrical properties of the sample. All these studies confirm that the grown crystal is the potential candidate for the fabrication of nonlinear optical devices.
Acknowledgement
The authors like to thank the staff members of Sophisticated Test Instrumentation Centre (STIC), Cochin University, Cochin for providing the single crystal and powder X-ray diffraction analyses and extend our thanks to Dr. Basheer Ahamed, Professor of Physics, B.S. Abdur Rahman University, Vandalur, Chennai for providing the SHG analysis of the title compound. The authors like to thank staff members of PSN College of Engineering, Tirunelveli for the impedance analysis of the sample. Also the authors are thankful for the research support provided to carry out other studies in VOC College, Tuticorin, Karunya University, Coimbatore, NIT, Trichy.
References
[1] D.S. Chemla, J. Zyss (Eds.), Nonlinear Optical Properties of Organic Molecules and Crystals I, Academic Press, Orlando, 1987.
[2] D.J. Williams (Ed.), Nonlinear Optical Properties of Organic and Polymeric Materials, American Chemical Society, Washington, DC, 1983.
[3] B. Kirtman, B. Champagne, Int. Rev. Phys. Chem. 16 (1997) 389.
[4] R.A. Hann, D. Bloor (Eds.), Organic Materials for Non linear Optics, Royal Society of Chemistry, London, 1989.
[5] G.J. Ashwell, D. Bloor (Eds.), Organic Materials for Non-linear Optics III, Royal Society of Chemistry, Cambridge, 1993.
[6] J. Messier, F. Kajzar, P. Prasad, D. Ulrich (Eds.), Nonlinear Optical Effects in Organic Polymers, Kluwer Academic Publishers, Dordrecht,1989.
[7] J. Messier, F. Kajzar, P. Prasad (Eds.), Organic Molecules for Nonlinear Optics and Photonics, Kluwer Academic Publishers, Dordrecht,1991.
[8] T. Kobayashi (Ed.), Nonlinear Optics of Organics and Semiconductors,Springer-Verlag, Berlin, 1989.
[9] M. Ardoino, L. Zeng, C. Razzetti, M. Zha, L. Zanotti, M. Curti, Mater Chem Phys, 66 (2000), 299-302. [10]E. de Matos Gomes, V. Venkataramanan, E. Nogueira,
M. Belsley, F. Proenc, A. Criado, M.J. Dianez, M.D. Estrad, S. Perez-Garrido, Synth Met, 115 (2000), pp. 225-228.
[11]V.K. Dixit, S. Vanishri, H.L. Bhat, E. de Matos Gomes,
M. Belsley, C. Santinha, G. Arunmozhi, V.
Venkataramanan, F. Proena, A. Criado, J. Cryst. Growth, 253 (2003), pp. 460-466.
[12] https://pubchem.ncbi.nlm.nih.gov/compound/1_3-dimethylurea
[13]Halbout JM, Sarhangi A, Tang CL. Appl Phys Lett 1980; 37:864–866.
[14]Pratik M.Wankhade, Gajanan G.Muley, Results in Physics, 3, 2013, 97-102.
[15]Muley GG, Rode MN, Pawar BH., Optoelectron. Adv. Mater-Rapid Commun. 2009; 3:704–705.
[16]Kurtz SK, Perry TT. J Appl. Phys. 1968; 39:3798–813. [17]H. Lipson, H. Steeple, Interpretation of X-ray Powder
https://www.phoenixpub.org/journals/index.php/jaar
7
[18]Ravi U, Srinivasan K, Anbukumar S, Ramasamy P. J.Cryst. Growth 1994; 137:598–604.
[19]Robert M. Silverstein, Francis X. Webster, David J. Kiemle, Spectrometric Identification of Organic Compounds, 7th ed., Wiley & Sons, INC., 2005. [20]K.J.Arun, S. Jayalekshmi, J. Miner. Mater. Charact.
Engg, 8 (2009) 599.
[21]M.A.Gaffara, A.Abu El-Fadl, Bin Anooz, Physica B, 327 (2003)43–54.
[22]http://en.wikipedia.org/wiki/EDAX
[23]M.E.Brown, Thermal Analysis: Techniques and
Applications, Chapman and Hall, New York (1988).
[24]J.R.Macdonald, Impedance Spectroscopy-Solid
Materials and Systems, John Wiley & Sons, 1987. [25] A. Shanthi, C. Krishnan, P.Selvarajan, Spectrochimica
Acta Part A: Molecular and Bimolecular Spectroscopy, 122 (2014) 521–528.