Original Article
The case-only independence assumption: associations
between genetic polymorphisms and smoking among
controls in two population-based studies
M Elizabeth Hodgson1, Andrew F Olshan1,4, Kari E North1,5, Charles L Poole1, Donglin Zeng2, Chiu-Kit Tse1, Tope O Keku3, Joseph Galanko1, Robert Sandler4, Robert C Millikan1,4,6
1Departments of Epidemiology and 2Biostatistics, Gillings School of Global Public Health, 3Center for Gastrointes-tinal Biology and Disease, 4Lineberger Comprehensive Cancer Center, School of Medicine, 5Carolina Center for Genome Sciences, University of North Carolina, Chapel Hill, North Carolina 27599; 6Deceased
Received July 16, 2012; Accepted October 19, 2012; Epub November 15, 2012; Published November 30, 2012
Abstract: The independence assumption for a case-only analysis of statistical interaction, i. e. that genetic (G) and environmental exposures (E) are not associated in the source population, is often checked in surrogate populations. Few studies have examined G-E association in empirical data, particularly in controls from population-based stud-ies, the type of controls expected to provide the most valid surrogate estimates of G-E association. We used controls from two population-based case-control studies to evaluate G-E independence for 43 selected genetic polymor-phisms and smoking behavior. The odds ratio (ORz) was used to estimate G-E association and, therefore, the mag-nitude of bias introduced into the case-only odds ratio (COR). Odds ratios of moderate magmag-nitude [mmORz], defined as ORz≤0.7 or ORz>=1.4, were found at least one of the six smoking measures (ever, former, current, cig/day, years smoked, pack-years) for 45% and 59% of the SNPs examined in the control groups of two independently conducted North Carolina studies, respectively. Consequently, case-only estimates of G-E interaction in the context of a multi-plicative benchmark would be biased for these SNPs and smoking measures. MmORzs were found more often for smoking amount than smoking status. We recommend that a stand-alone case-only study should only be conducted when G-E independence can be verified for each polymorphism and exposure metric with population-specific data. Our results suggest that ORz is specific to each underlying population rather than an estimate of a ‘universal’ ORz for that SNP and smoking measure. Further, misspecification of smoking is likely to introduce bias into the COR.
Keywords: Case-only, controls, gene-environment interaction, genetic polymorphisms, smoking
Introduction
The case-only study design as proposed by Prentice et. al. and popularized by Piegorsch and Khoury et.al. [1, 2] been used increasingly over the last 20 years to estimate the magni-tude of statistical interaction between two exposures, most often gene-environment inter-action (GxE) in cancer studies. Provided the independence assumption is met (i.e. that the genetic and environmental factors are indepen-dent in the population that produced the cases), the case-only study estimates the syn-ergy index (SIM), a measure of statistical inter-action based upon a multiplicative benchmark. Correlation of two exposures among cases (the case-only odds ratio, COR) is interpretable as an estimate of SIM if there no correlation of the
two exposures among controls (measured by the control-only odds ratio, ORz) [3]. Data simu-lations have demonstrated that small viosimu-lations of the independence assumption strongly bias the case-only interaction parameter [4]. Albert et. al. varied the magnitude of control group G-E association to explore the effect of indepen-dence assumption violation on the COR. As the magnitude of gene-environment association in controls (ORz) increased above the null, the COR was increasingly and proportionally biased away from the SIM.
must utilize data from other sources to evalu-ate the independence assumption. There is scant literature on empirical G-E control group associations, and few published estimates of ORz that can be used to guide investigators who wish to conduct these case-only analyses. However, using data from a study of XRCC1 genotype and lung cancer, Albert et. al. showed empirically that the magnitude of ORz equaled the magnitude of bias introduced into the COR relative to the SIM [4]. In another example, an ORz of 1.2, representing the association between genotype and alcohol drinking status, biased the COR by nearly 30%, exceeding one commonly used threshold for an acceptable level of bias due to confounding (10%). When ORz has a similar magnitude but opposite direc-tion to the SIM, a case-only study may fail to detect interaction effects (Type II error) [4, 7, 8]. The case-only study has been suggested as a screening tool to identify candidate genes that may interact with environmental exposures, however, appreciable bias in the COR would invalidate such an approach. Few studies have provided empirical evidence of the extent of the potential bias in the COR.
The purpose of the current study is to more fully examine the validity of the independence assumption of the case-only design, using two population-based case-control studies to explore specific gene-smoking control group associations (ORz). The control groups are from the Carolina Breast Cancer Study (CBCS) and the North Carolina Colon Cancer Study (NCCCS). The SNPs chosen are often used to study gene-smoking interaction and/or gene-smoking behavior. They include SNPs for genes in the DNA repair, xenobiotic metabolism, and cell cycle control pathways. Both studies oversampled African Americans, and the NCCCS has both male and female participants, so effect measure modifi-cation and/or confounding by age, race and gender could also be addressed. Finally, all genes were grouped by the function of the gene pathway they participated in, and patterns in ORz according to biologic pathway were evaluated.
Materials and methods
Study populations
CBCS and NCCCS: The Carolina Breast Cancer Study and the North Carolina Colon Cancer
Study are population-based case-control studies conducted in central North Carolina in the mid- to late 1990’s (CBCS: Ncases=2311, Ncontrols=2022; NCCCS: Ncases=646, Ncontrols=1053) [9-13]. CBCS controls were pooled from Phase I (N=790), Phase II (N=774) and the Carcinoma in situ (N=458) study. For both studies, controls were selected from NC Division of Motor Vehicles lists (<65 years of age) and Health Care Financing Administration lists (≥65 years of age), using randomized recruitment and frequency matched on age, race and gender [14]. The CBCS and NCCCS used similar questionnaires and both have extensive data on tobacco smoking.
A panel of genetic polymorphisms was chosen from available genotype data in the CBCS and NCCCS based on relevance to smoking or smoking-related health effects. Genes selected from the CBCS included xenobiotic metabolism genes (CYP1A1, GSTM1, GSTP1, GSTT1, NAT1, NAT2, COMT), DNA repair genes (base excision repair: APE 148, hOGG1, MYH, XRCC1; double strand break repair: BRCA2, NBS1, XRCC2, XRCC3, XRCC4; mismatch repair: MGMT; nucleotide excision repair: ERCC1, ERCC6, RAD23B, XPC, XPD, XPF, XPG), and others (MnSOD, MPO, NQO1, CDH1, TGFB1). NCCCS genes included: xenobiotic metabolism genes (GSTM1, GSTT1, MEH), DNA repair genes (base excision repair: ADPRT, ADPRTL2, APE 148, XRCC1; double strand break repair: NBS1, XRCC3; mismatch repair: MLH1, MSH3, MSH6; nucleotide excision repair: RAD23B, XPC, XPD, XPF, XPG), and MnSOD. Methods of collection and genotyping have been described previously [15-25].
Statistical methods
most common allele (“no variant”) formed the referent group (G-) and were compared to het-erozygotes plus homozygotes for the less com-mon allele (G+, “any variant”).
Smoking status was categorized as ever, for-mer or current smoker. Three measures of smoking amount were used: duration (<10 years, 11-20 years, >20 years), intensity (<1/2 pack/day, 1/2-1 pack/day, >1 pack/day) and pack-years (PY: ≤35 PY, >35 PY). Pack-years (PYs) were derived from categorical variables used for packs/day and years smoked (pack-years were equal to the midpoint of the catego-ry for number of years smoked multiplied by the
midpoint of the category for number of packs smoked/day).
Each control group was further evaluated for effect measure modification of ORz by stratify-ing on race (white, African American), age (CBCS: <50y, ≥ 50y; NCCCS: <65y, >65y) and gender (NCCCS only). Age cutpoints were based on the age distributions in each study. A likeli-hood ratio test was performed comparing mod-els with and without a race*smoking interaction term. Strata were not pooled when the interac-tion term was significant (α=0.05) for a majority of smoking measures.
Full CBCS and NCCCS Non-African American women, 40-74 y
CBCS NCCCS CBCS NCCCS
N % N % N % N %
Total N 2022 1053 1107 222
Gender
Female 2022 100 535 50.8 1107 100 222 100
Male 0 518 49.2 0 0
Race
White* 1234 61.0 616 58.5 1107 100 222 100
African American 788 39.0 437 41.5 0 0
Age at selection (years)
Mean +/-SD 52.6 +/-11.2 66.1+/-9.5 55.1+/- 10.0 63.5+/-8.2
Median 50 68 53 66
Range 21-74 40-81 40-74 41-74
Smoking behavior Smoking Status
Never 1087 53.8 450 42.9 558 50.4 119 53.6
Former 547 27.1 412 39.2 344 31.1 76 34.2
Current 388 19.2 188 17.9 205 18.5 27 12.2
2022 1050 1107 222
Duration (years)
<10 271 29.1 128 21.4 143 15.0 30 29.4
11-20 235 25.3 130 21.7 265 27.8 18 17.6
>20 424 45.6 340 56.9 546 57.2 54 52.9
930 598 954 102
Intensity (pack/day)
<1/2 329 35.4 188 31.6 161 29.5 31 30.1
1/2 - 1 324 34.8 223 37.5 189 34.7 42 40.8
>1 277 29.8 184 30.9 195 35.8 30 29.1
930 595 545 103
Pack-years†
N 925 593 542 102
Mean +/- SD 17.5 +/-17.3 27.1+/-27 20.7+/-18.3 26.3+/-27.4
Median 11.6 18.8 19.1 21
Range 0.1-80 0.1-137.5 79.8 124.8
≤35 pack-years 783 84.6 424 71.5 431 79.5 71 69.6
>35 pack-years 142 15.4 169 28.5 111 20.5 31 30.4
925 593 542 102
*Participants reporting non-African American race (98% white for CBCS, 98.9% white in NCCCS); †Smokers only. NOTE: CBCS=Carolina Breast Cancer Study, NCCCS=North Carolina Colon Cancer Study, SD=standard deviation, N=number of con-trols.
Table 2. Gene variants in CBCS and NCCCS Gene & codon/
nucleotide position rs# Common * allele (amino acid) Variant
* allele
(amino acid) common/variantNucleotide Gene name and official abbreviation† Study
ADPRT 762 rs1136410 Val Ala T/C poly (ADP-ribose) polymerase 1 [PARP1] NCCCS
ADPRTL2 328‡ C/T poly (ADP-ribose) polymerase 2 [PARP2] NCCCS
APE1 148 rs1130409 Asp Glu T/G APEX nuclease (multifunctional DNA repair enzyme) 1 [APEX1] Both
BRCA2 intron 24 rs206340 -- -- G/A breast cancer 2, early onset [BRCA2] CBCS
BRCA2 372 rs144848 Asn His A/C breast cancer 2, early onset [BRCA2] CBCS
CDH1 -160 rs16260 -- -- C/A cadherin 1, type 1, E-cadherin (epithelial) [CDH1] CBCS
COMT 1584 rs4680 Val Met G/A catechol-O-methyltransferase [COMT] CBCS
CYPIA1 M1 (CYP1A1*2A) rs4646903 (*1A) (*2A) T/C cytochrome P450, family 1, subfamily A, polypeptide 1 [CYP1A1] CBCS
CYPIA1 M2 (CYP1A1*2C) rs1048943 Ile (*1A) Val A/G cytochrome P450, family 1, subfamily A, polypeptide 1 [CYP1A1] CBCS
CYPIA1 M3 (CYP1A1*3) rs4986882 (*1A) (*3) T/C cytochrome P450, family 1, subfamily A, polypeptide 1 [CYP1A1] CBCS
CYPIA1 M4 (CYP1A1*4) rs1799814 Thr (*1A) Asn C/A cytochrome P450, family 1, subfamily A, polypeptide 1 [CYP1A1] CBCS
ERCC1 nt8092 rs3212986 Gln Lys C/A excision repair cross-complementing rodent repair deficiency,
comple-mentation group 1 (includes overlapping antisense sequence) [ERCC1] CBCS
ERCC6 1213 rs2228527 Arg Gly A/G excision repair cross-complementing rodent repair deficiency, comple-mentation group 6 [ERCC6] CBCS
ERCC6 1230 rs4253211 Arg Pro G/C excision repair cross-complementing rodent repair deficiency, comple-mentation group 6 [ERCC6] CBCS
GSTM1|| present null glutathione S-transferase mu 1 [GSTM1] Both
GSTP1 105** rs1695 Ile Val A/C glutathione S-transferase pi 1 [GSTP1] CBCS
GSTT1|| present null glutathione S-transferase theta 1 [GSTT1] Both
MEH 113 rs1051740 Tyr His T/C epoxide hydrolase 1, microsomal (xenobiotic) [EPHX1] NCCCS
MEH 139 rs55784606 His Tyr C/T epoxide hydrolase 1, microsomal (xenobiotic) [EPHX1] NCCCS
MGMT 84 rs12197 Leu Phe C/T O-6-methylguanine-DNA methyltransferase [MGMT] CBCS
MLH1 219 rs1799977 Ile Val A/G mutL homolog 1, colon cancer, nonpolyposis type 2 (E. coli) [MLH1] NCCCS
MNSOD 16†† rs4880 Val Ala T/C superoxide dismutase 2, mitochondrial [SOD2] Both
MPO-463 rs2333227 -- -- G/A myeloperoxidase [MPO] CBCS
MSH3 1036 rs26279 Thr Ala A/G mutS homolog 3 (E. coli) [MSH3] NCCCS
MSH3 940 rs184967 Arg Gln G/A mutS homolog 3 (E. coli) [MSH3] NCCCS
MSH6 39 rs1042821 Gly Glu G/A mutS homolog 6 (E. coli) [MSH6] NCCCS
MYH 324 rs3219489 Gln His G/C mutY homolog (E. coli) [MUTYH] CBCS
NAT1 rs1057126 (*10, rapid) (Non *10) T/A N-acetyltransferase 1 (arylamine N-acetyltransferase) [NAT1] CBCS
NAT2 Reference (*4, rapid) (*5, *6, *7, *14, slow) N-acetyltransferase 2 (arylamine N-acetyltransferase) [NAT2] CBCS
NBS1 185 rs1805794 Glu Gln G/C Nijmegen breakage syndrome 1 (nibrin) [NIB] Both
NQO1 187 rs1800566 Pro Ser C/T NAD(P)H dehydrogenase, quinone 1 [NQO1] CBCS
POLD1 119 rs1726801 Arg His G/A polymerase (DNA directed), delta 1, catalytic subunit 125kDa [POLD1] NCCCS
RAD23B rs1805329 Ala Val C/T RAD23 homolog B (S. cerevisiae) [RAD23B] Both
TGFB1 rs1800470 Leu Pro T/C transforming growth factor, beta 1 [TGFB1] CBCS
XPC 499 rs2228000 Ala Val C/T xeroderma pigmentosum, complementation group C [XPC] NCCCS
XPC 939 rs2228001 Lys Gln A/C xeroderma pigmentosum, complementation group C [XPC] Both
XPD 312 rs1799793 Asp Asn G/A excision repair cross-complementing rodent repair deficiency, comple-mentation group 2 [ERCC2] Both
XPD 751 rs13181 Lys Gln A/C excision repair cross-complementing rodent repair deficiency, comple-mentation group 2 [ERCC2] Both
XPF 415 rs1800067 Arg Gln G/A excision repair cross-complementing rodent repair deficiency, comple-mentation group 4 [ERCC4] Both
XPF 662 rs2020955 Ser Pro T/C excision repair cross-complementing rodent repair deficiency,
comple-mentation group 4 [ERCC4] CBCS
XPG 1104 rs17655 Asp His G/C excision repair cross-complementing rodent repair deficiency,
comple-mentation group 5 [ERCC5] Both
XRCC1 194 rs1799782 Arg Trp C/T X-ray repair complementing defective repair in Chinese hamster cells
1 [XRCC1] Both
XRCC1 280 rs25489 Arg His G/A X-ray repair complementing defective repair in Chinese hamster cells
1 [XRCC1] Both
XRCC1 399 rs25487 Arg Gln G/A X-ray repair complementing defective repair in Chinese hamster cells
1 [XRCC1] Both
XRCC2 188 rs3218536 Arg His G/A X-ray repair complementing defective repair in Chinese hamster cells
2 [XRCC2] CBCS
XRCC3 241 rs 861539 Thr Met C/T X-ray repair complementing defective repair in Chinese hamster cells
3 [XRCC3] Both
XRCC4-28073‡‡ rs2075685 T G T/G X-ray repair complementing defective repair in Chinese hamster cells
4 [XRCC4] CBCS
Gene pathway/SNP|| Ever smokers
‡ Current smokers§
ORz† NAA AA <50y ≥50y ORz NAA AA <50y ≥50y Xenobiotic metabolism**
CYPIA1 M1 1.0 0.8 1.1 1.3 0.7 1.0 0.8 1.1 1.0 1.0
CYPIA1 M2 1.8 1.6 -1 -1 -1 #### -1 -1 -1
CYPIA1 M3 0.9 -1 1.0 -1 -1 #### ### 1 -1 -1
CYPIA1 M4 1.3 1.5 -1 -1 -1 2.5 2.9 0 -1 -1
GSTM1 1.0 1.2 0.8 1.1 1.0 1.1 1.0 1.1 1.3 0.7
GSTP1 1.2 1.4 0.8 1.2 1.2 0.7 0.7 0 0.7 0.7
GSTT1 1.0 0.7 1.5 0.9 1.1 1.1 0.9 0 0.9 -1
NAT1 0.9 1.1 0.8 1.0 1.0 1.2 1.2 0 1.5 -1
NAT2 0.9 1.1 0.9 1.1 1.0 1.3 2.1 1 1.5 -1
COMT 0.8 0.6 1.2 1.0 0.7 0.9 0.7 1.3 0.9 0.9
DNA repair
Base excision repair
APE1 148 1.1 1.3 0.9 1.3 1.0 1.2 1.3 1.0 1.3 1.0
hOGG1 1.0 1.0 1.1 1.1 1.0 0.9 1.0 0.8 1.0 0.8
MYH 324 1.0 1.0 0.8 1.0 0.9 0.8 0.9 0.8 0.8 0.8
XRCC1 194 1.1 1.0 1.3 1.2 1.1 1.1 0.9 1.5 1.0 1.3
XRCC1 280 0.9 0.9 0.9 0.7 1.1 0.9 0.8 0 0.8 -1
XRCC1 399 1.0 1.1 1.1 1.1 1.1 1.2 1.2 1.4 1.2 1.3
Double strand break repair
BRCA2 24 0.9 0.9 0.9 0.9 0.9 0.9 0.8 1.1 0.9 0.9
BRCA2 372 1.2 1.2 1.2 1.0 1.4 1.2 1.1 1.2 1.0 1.4
NBS1 185 1.2 1.3 1.0 1.4 1.1 1.0 1.1 1.1 1.2 0.9
XRCC2 188 0.9 0.8 -1 1.0 0.9 0.9 0.9 1 1.1 -1
XRCC3 241 0.9 0.9 1.0 1.0 0.9 1.2 1.2 1.2 1.2 1.2
XRCC4 -28073 1.2 1.2 1.3 1.5 1.0 1.2 1.1 1.4 1.5 1.0
Mismatch repair
MGMT 84 0.9 0.9 1.0 1.0 0.9 0.8 0.9 0.7 0.8 0.8
Nucleotide excision repair
ERCC1 8092 1.0 0.9 1.1 1.0 0.9 1.0 0.8 1.1 0.8 1.1
ERCC6 1213 1.2 1.4 1.0 1.3 1.2 1.6 1.7 1.4 1.6 1.5
ERCC6 1230 0.9 0.9 1.2 1.0 0.8 1.1 1.1 1 1.6 0.8
HRAD23B 1.1 1.1 1.0 1.2 1.0 1.2 1.3 0 1.1 1.3
XPC 939 0.9 0.9 1.0 0.9 1.0 1.0 1.1 0.9 1.0 1.0
XPD 312 1.0 1.0 1.1 1.1 1.1 1.1 1.1 1.0 1.0 1.2
XPD 751 1.2 1.2 1.1 1.1 1.3 1.2 1.1 1.3 1.0 1.4
XPF 415 1.0 1.1 -1 1.0 1.0 1.0 0.9 0 0.7 1.2
XPF 662 1.1 ### 1.2 1.0 1.4 1.4 ### 1.4 1.5 1.3
XPG 1104 0.9 1.0 0.7 0.9 0.9 0.8 0.8 0.9 0.9 0.8
Cell adhesion
CDH1 0.8 0.8 0.8 0.9 0.8 0.8 0.8 0.9 0.9 0.8
Cell growth
TGFB1 1.1 1.1 1.1 1.3 0.9 0.8 0.8 0.9 0.9 0.7
Oxidative stress defense
MnSOD 1.0 0.9 1.0 1.1 0.8 0.9 0.8 0.9 0.8 0.9
MPO 1.0 1.2 0.9 0.8 1.4 1.0 1.2 0.8 0.9 1.3
NQO1†† -99 1.3 0.8 1.2 1.0 1.0 1.3 0.7 1.2 1.0
Gene pathway/SNP|| Former smokers
‡ Current smokers‡
ORz NAA AA <50y ≥50y ORz NAA AA <50y ≥50y Xenobiotic metabolism**
CYPIA1 M1 1.0 0.8 1.1 1.5 0.6 1.0 0.8 1.2 1.1 0.8
CYPIA1 M2 2.1 -1 -1 -1 #### -1 0 -1 -1
CYPIA1 M3 #### -1 0 -1 -1 #### ### 0 -1 -1
CYPIA1 M4 -1 -1 #### -1 0 -1 -1
GSTM1 1.0 1.3 0 0.9 1.1 1.1 1.1 1.0 1.3 0.8
GSTP1 1.8 1.9 0 1.9 1.5 0.8 0.9 0 0.8 -1
GSTT1 0.9 0.7 0 -1 -1 1.1 -1 0 -1 -1
NAT1 0.8 1.0 0 0.7 1.1 1.1 1.3 0 1.4 -1
NAT2 0.8 0.9 0 0.9 0.9 1.2 -1 0 1.4 -1
COMT 0.8 0.6 1.1 1.0 0.7 0.9 0.6 1.3 0.9 0.8
DNA repair
Base excision repair
APE1 148 1.1 1.2 0.8 1.2 1.0 1.2 1.4 1.0 1.4 1.0
hOGG1 1.1 1.0 1.3 1.1 1.1 1.0 1.0 0.8 1.0 0.9
MYH 324 1.1 1.1 1.0 1.2 1.0 0.9 0.9 0.7 0.9 0.8
XRCC1 194 1.1 1.1 1.2 1.3 1.0 1.2 1.0 1.5 1.1 1.3
XRCC1 280 0.9 1.0 0 0.7 1.2 0.9 0.8 0 0.8 -1
XRCC1 399 1.0 1.0 0.9 0.9 1.0 1.2 1.2 1.4 1.2 1.3
Double strand break repair
BRCA2 24 1.0 1.0 0.8 1.0 0.9 0.9 0.8 1.0 0.9 0.9
BRCA2 372 1.2 1.2 1.2 1.0 1.4 1.3 1.2 1.3 1.0 1.5
NBS1 185 1.2 1.4 0.9 1.4 1.1 1.1 1.2 1.0 1.4 0.9
XRCC2 188 0.9 0.9 0 0.9 1.0 0.8 0.8 0 1.0 -1
XRCC3 241 0.8 0.8 0.9 0.9 0.8 1.1 1.1 1.2 1.2 1.1
XRCC4 -28073 1.1 1.2 1.1 1.3 1.0 1.3 1.2 1.5 1.6 1.0
Mismatch repair
MGMT 84 1.1 1.0 1.2 1.2 1.0 0.8 0.9 0.7 0.9 0.8
Based on directed acyclic graphs [26], and their status as matching factors, age (continu-ous), race (white or African American) and gen-der (NCCCS only) were included as potential confounders of the gene-smoking relationship. We also evaluated first degree family history of any cancer and total family income as con-founders. Neither variable met the criteria for confounding in this study (unit change of |0.15| or more in the β coefficient estimating ORz). Associations were characterized by magnitude
of ORz and precision of the 95% CI. An ORz ≥1.4 or <0.7 was considered a moderate magnitude association (mmORz) and evidence of non-null association. Unacceptable imprecision was defined as odds ratio estimates with confi-dence limit ratios >4 (CLR, upper CI limit/lower CI limit) and were excluded unless otherwise stated. SAS 9.1 was used for all modeling [27]. Agreement between the CBCS and NCCCS was assessed using a weighted kappa statistic [28]. Nucleotide excision repair
ERCC1 8092 1.0 0.9 1.0 1.2 0.8 1.0 0.8 1.1 0.9 1.0
ERCC6 1213 1.0 1.1 0.8 1.0 1.0 1.6 1.8 1.3 1.6 1.5
ERCC6 1230 0.8 0.8 1 0.7 0.8 1.0 1.0 1 1.4 0.7
HRAD23B 1.0 1.0 1.2 1.2 0.9 1.2 1.3 0 1.1 1.3
XPC 939 0.9 0.8 1.1 0.8 0.9 1.0 1.0 0.9 0.9 1.0
XPD 312 1.0 1.0 1.2 1.1 1.0 1.1 1.1 1.1 1.0 1.2
XPD 751 1.1 1.2 1.0 1.1 1.2 1.2 1.2 1.2 1.0 1.5
XPF 415 1.1 1.1 0 1.2 0.9 1 0.9 0 0.8 1.2
XPF 662 1.0 ### 1.1 0.7 1.4 1.3 ### 1.4 1.3 1.5
XPG 1104 1.0 1.1 0.7 0.9 1.0 0.8 0.9 0.8 0.8 0.8
Cell adhesion
CDH1 0.8 0.9 0.7 0.9 0.8 0.8 0.8 0.9 0.9 0.7
Cell growth
TGFB1 1.2 1.3 1.2 1.6 1.0 0.9 0.8 1.0 1.1 0.7
Oxidative stress defense
MnSOD 1.1 1.0 1.0 1.3 0.8 0.9 0.8 0.9 0.9 0.8
MPO 1.0 1.2 1.0 0.8 1.3 1.0 1.2 0.8 0.8 1.4
NQO1†† 1.0 1.2 0.8 1.2 1.0 1.0 1.4 0.7 1.2 1.0
*Odds ratios are race and age adjusted unless stratified by race or age, respectively; †Odds ratio not displayed if 95% confi-dence limit ratio (upper limit/lower limit) >4; ‡Referent is never smokers for all smoking categories unless otherwise noted; §Referent is not-current smokers (former + never); § ||SNP referent = homozygous for common allele, compared to heterozygotes + homozygous for less common alleles, GSTM1 & GSTT1 referent=present; **Primary functional category; gene may function in additional pathways e.g. COMT in estrogen metabolism; ††Could not be pooled for some measures of smoking. LRT p-value for race*smoking interaction term <0.05; Bold = Overall OR
z. = ORz ≤0.7
= ORz ≥1.4
≤10 years‡ 11-20 years >20 years Gene pathway/
SNP|| ORz† NAA AA <50y ≥50y ORz NAA AA <50y ≥50y ORz NAA AA <50y ≥50y Xenobiotic metabolism6
CYPIA1 M1 1.0 1.2 1.0 1.3 -1.0 1.3 -1.0 -1.0 1.4 -1.0 0.8 0.7 0.9 -1.0 0.6
CYPIA1 M2 -1.0 -.0 -1.0 -1.0 #### -1.0 -1.0 -1.0 -1.0 #### -1.0 -.0 -1.0 -1.0
CYPIA1 M3 ### -.0 -1.0 -1.0 #### -1.0 -1.0 -1.0 #### -1.0 -.0 -1.0 -1.0
CYPIA1 M4 ### -1.0 ## -1.0 -1.0 #### -1.0 -1.0 -1.0 #### -1.0 -.0 -1.0 -1.0
GSTM1 1.1 1.3 -.0 1.0 -1.0 1.0 0.9 -1.0 1.4 -1.0 1.0 1.3 -.0 -1.0 1.1
GSTP1 1.9 1.8 -.0 -1.0 -1.0 1.0 1.2 -1.0 0.9 -1.0 1.0 1.3 -.0 -1.0 1.2
GSTT1 -1.0 -.0 -1.0 -1.0 1.0 -1.0 -1.0 -1.0 -1.0 1.0 -1.0 -.0 -1.0 1.3
NAT1 0.6 -1.0 -.0 -1.0 -1.0 1.1 -1.0 -1.0 -1.0 -1.0 1.1 1.2 -.0 -1.0 -1.0
NAT2 0.8 -1.0 -.0 -1.0 -1.0 0.9 -1.0 -1.0 -1.0 -1.0 1.1 1.5 -.0 -1.0 1.1
COMT 1.0 -1.0 -.0 -1.0 -1.0 0.8 0.5 -1.0 0.6 -1.0 0.8 0.7 -.0 -1.0 0.8
DNA repair
Base excision repair
APE1 148 1.2 1.2 1.0 1.4 0.9 1.1 1.3 0.9 1.1 1.1 1.1 1.3 0.9 1.4 1.0
hOGG1 1.4 1.1 1.9 1.3 1.3 1.1 1.1 1.0 1.2 0.8 0.9 0.9 0.8 0.7 1.0
MYH 324 1.0 1.1 0.8 1.0 1.0 1.0 0.9 1.1 1.0 0.8 1.0 1.1 0.7 1.1 0.9
XRCC1 194 1.4 1.4 1.4 1.5 1.5 0.9 0.7 -1.0 1.4 -1.0 1.1 1.0 1.3 0.9 1.2
XRCC1 280 0.8 0.8 1.0 -1.0 -1.0 0.9 -1.0 -1.0 -1.0 -1.0 1.0 1.1 -1.0 -1.0 1.1
XRCC1 399 0.8 0.8 0.8 0.8 1.0 1.1 1.2 0.9 1.0 1.3 1.2 1.1 1.5 1.7 1.1 Double strand break repair
BRCA2 24 0.9 1.1 0.7 0.9 0.9 1.0 0.9 1.3 1.0 0.9 0.9 0.8 0.9 0.8 0.9
BRCA2 372 1.0 1.0 1.1 0.9 1.3 1.5 1.7 0.9 1.2 1.6 1.3 1.1 1.6 1.0 1.4
NBS1 185 1.2 1.2 1.0 1.3 0.9 1.3 1.3 1.5 1.8 1.0 1.1 1.4 0.7 1.1 1.1
XRCC2 188 0.9 0.7 1.0 1.0 -1.0 0.9 0.9 -1.0 -1.0 -1.0 0.9 0.9 -1. 1.2 0.8
XRCC3 241 0.8 0.8 0.9 0.8 0.8 0.8 0.9 0.8 1.1 0.7 1.1 0.9 1.2 1.2 0.9
XRCC4 1394 1.1 1.0 1.7 1.4 1.0 1.0 1.1 1.1 1.7 0.7 1.3 1.4 1.1 1.3 1.2 Mismatch repair
MGMT 84 1.3 1.3 1.1 1.1 1.4 1.0 0.9 1.4 1.0 1.1 0.7 0.8 0.6 0.9 0.7
Nucleotide excision repair
ERCC1 8092 1.0 1.0 0.9 1.1 0.7 1.1 0.8 1.7 1.2 0.8 0.9 0.9 0.9 0.8 1.0
ERCC6 1213 1.2 1.1 1.3 1.3 1.0 1.2 1.3 1.0 1.2 1.1 1.2 1.5 0.9 1.3 1.2
ERCC6 1230 0.8 0.8 1.0 1.0 0.8 0.9 0.8 -1.0 0.8 1.0 1.0 0.9 -1.0 1.5 0.8
HRAD23B 1.2 1.0 -.0 1.5 0.7 0.9 0.8 -1.0 0.8 0.9 1.2 1.3 0.8 1.2 1.1
XPC 939 1.0 1.1 0.9 0.9 1.3 0.9 0.7 1.2 0.9 0.8 0.9 0.9 0.8 0.8 0.9
XPD 312 0.9 1.0 0.8 0.9 0.8 1.2 1.1 1.5 1.3 1.2 1.1 1.1 1.2 1.1 1.1
XPD 751 0.9 1.1 0.7 0.9 1.1 1.3 1.3 1.3 1.3 1.2 1.3 1.2 1.3 1.1 1.3
XPF 415 1.1 1.3 -.0 1.3 -1.0 0.9 0.9 -1.0 -1.0 -1.0 1.0 1.0 -1.0 1.0 1.0
XPF 662 1.1 1.2 0.9 -1.0 1.4 1.4 1.0 -1.0 1.0 1.2 -1.0 1.1
XPG 1104 0.9 1.1 0.7 0.9 1.0 1.0 1.2 0.8 1.0 1.1 0.9 1.0 0.7 0.8 0.9
Cell adhesion
CDH1 0.9 0.9 0.7 0.9 0.8 0.7 0.7 0.7 0.7 0.8 0.8 0.8 0.9 1.0 0.8
Cell growth
TGFB1 1.3 1.4 1.2 1.5 1.2 1.1 1.1 1.0 1.2 0.9 1.0 0.9 1.0 1.2 0.8
Oxidative stress defense
MnSOD 1.0 1.0 0.8 1.1 0.8 1.0 0.8 1.3 1.1 0.7 1.0 0.9 1.0 1.0 0.9
MPO 0.9 1.2 0.7 0.6 1.8 1.1 1.0 1.0 1.0 1.0 1.1 1.3 1.0 0.9 1.4
NQO1†† 1.2 0.8 1.1 1.0 1.0 1.3 1.1 1.2 1.2 1.1 1.4 0.6 1.4 0.9
*Odds ratios are race and age adjusted unless stratified by race or age, respectively; †Odds ratio not displayed if 95% confidence limit ratio (upper limit/lower limit) >4; ‡Referent is never smokers for all smoking categories unless otherwise noted; ||SNP referent = homozygous for common allele, compared to heterozygotes + homozygous for less common alleles,
GSTM1 & GSTT1 referent=present; **Primary functional category; gene may function in additional pathways e.g. COMT in estrogen metabolism; ††Could not be pooled for some measures of smoking. LRT p-value for race*smoking interaction term <0.05; Bold = Overall ORz.
Table 4. Gene variant-smoking duration association in the CBCS, overall and by race*,†
= ORz ≤0.7 = ORz ≥1.4
<1/2 pack/day‡ 1/2 - 1 pack/day >1 pack/day Gene
path-way/SNP|| ORz2 NAA AA <50y ≥50y ORz NAA AA <50y ≥50y ORz NAA AA <50y ≥50y Xenobiotic metabolism**
CYPIA1 M1 0.9 0.8 1.0 1.3 -1.0 1.0 -1.0 1.3 1.2 -1.0 1.0 1.0 1.0 -1.0 -1.0
CYPIA1 M2 .0 -.0 -10 -1.0 #### -1.0 -.0 -1.0 -1.0 #### -1.0 1.0 -1.0 -1.0
CYPIA1 M3 #### -1.0 -.0 -1.0 -1.0 #### #### -.0 -1.0 -1.0
CYPIA1 M4 -1.0 #### -1.0 -.0 -1.0 -1.0
GSTM1 0.9 1.0 -.0 1.2 -1.0 0.9 1.1 -.0 1.0 -1.0 1.3 1.4 -.0 1.1 1.5
GSTP1 1.2 1.5 1.0 1.4 -1.0 1.8 2.1 -.0 -1.0 -1.0 0.9 0.9 1.0 -1.0 -1.0
GSTT1 1.3 1.0 -.0 -1.0 -1.0 1.1 -1.0 1.0 -1.0 -1.0 #### -1.0 -0 -1.0 -1.0
NAT1 0.8 1.0 -.0 -1.0 -1.0 1.2 -1.0 - -1.0 -1.0 0.9 1.1 1.0 -1.0 -1.0
NAT2 0.8 1.0 -.0 -1.0 -1.0 1.0 -1.0 -.0 -1.0 -1.0 1.1 1.5 1.0 -1.0 -1.0
COMT 0.9 0.5 1.5 1.3 0.6 1.2 -1.0 1.0 0.9 -1.0 0.6 0.5 1.0 -1.0 -1.0
DNA repair
Base excision repair
APE1 148 1.3 1.3 1.3 1.8 1.0 0.9 1.2 0.6 1.2 0.8 1.2 1.4 0.8 1.0 1.4
hOGG1 0.9 0.8 1.1 1.1 0.8 1.1 1.1 1.1 1.1 1.1 1.1 1.0 1.0 1.0 1.0
MYH 324 1.0 1.0 0.9 1.0 0.9 0.9 1.0 0.7 1.0 0.8 1.0 1.0 1.3 1.1 1.0
XRCC1 194 1.2 1.4 0.9 1.4 1.0 1.0 0.6 1.9 1.1 0.8 1.2 1.2 1.0 1.2 1.4
XRCC1 280 0.9 0.9 1.0 -1.0 1.4 1.0 0.8 1.0 0.8 -1.0 0.8 0.9 ## -1.0 -1.0
XRCC1 399 0.9 1.0 0.9 0.8 1.1 1.1 1.2 1.3 1.2 1.2 1.1 1.1 1.6 1.4 1.0 Double strand break repair
BRCA2 24 0.8 1.0 0.7 0.8 0.9 1.0 0.9 1.3 1.1 0.9 0.9 0.9 1.0 0.8 1.0
BRCA2 372 1.1 0.9 1.5 1.1 1.1 1.2 1.2 1.0 0.8 1.5 1.6 1.6 -.0 1.2 1.8
NBS1 185 1.1 1.2 1.0 1.2 1.0 1.2 1.4 1.0 1.2 1.2 1.2 1.4 1.0 1.7 1.0
XRCC2 188 0.8 0.7 1. 1.0 -1.0 0.8 0.7 1.0 0.8 0.8 1.1 1.1 .0 1.1 1.2
XRCC3 241 0.9 0.7 1.2 1.0 0.8 0.9 1.1 0.8 1.1 0.8 0.8 0.9 0.8 0.8 0.9
XRCC4 1394 1.1 0.9 1.4 1.5 0.9 1.2 1.1 1.6 1.8 1.0 1.2 1.5 0.7 1.2 1.3 Mismatch repair
MGMT 84 1.1 1.1 1.1 1.3 0.9 0.8 0.9 0.7 0.6 1.1 0.9 0.8 1.2 1.1 0.8 Nucleotide excision repair
ERCC1 8092 1.0 0.9 1.0 1.2 0.7 1.0 1.1 1.0 1.0 1.1 0.9 0.7 1.5 0.8 0.9
ERCC6 1213 1.3 1.3 1.2 1.7 1.0 1.3 1.4 1.3 1.3 1.5 1.0 1.3 - 1.0 1.1
ERCC6 1230 1.0 1.0 1 1.1 1.0 1.0 0.9 1.2 0.8 0.8 0.8 - 0.9 0.7
HRAD23B 1.0 1.0 1.0 1.3 0.8 1.1 1.1 -. 1.1 1.0 1.2 1.2 - 1.1 1.2
XPC 939 1.1 1.0 1.2 1.1 1.1 0.8 0.8 0.8 0.8 0.8 0.9 0.9 0.9 0.8 1.1
XPD 312 1.0 1.0 1.0 1.1 0.9 1.1 1.1 1.1 1.2 1.1 1.1 1.0 1.6 0.9 1.2
XPD 751 1.1 1.3 1.1 1.0 1.4 1.2 1.2 1.2 1.2 1.1 1.2 1.3 1.0 1.0 1.3
XPF 415 0.9 0.9 1 1.2 1.0 0.9 1 0.9 1.0 1.1 1.3 - 0.9 1.5
XPF 662 1.4 # 1.6 1.5 1.7 0.9 0.9 0.7 1.3 0.9 # 1.0 -
-XPG 1104 0.9 1.0 0.8 1.1 0.8 0.9 1.1 0.6 0.8 1.0 0.9 1.0 0.7 0.8 1.1 Cell adhesion
CDH1 0.9 1.0 0.8 1.0 0.8 0.8 0.8 0.8 0.9 0.8 0.7 0.7 0.7 0.7 Cell growth
TGFB1 1.2 1.2 1.1 1.4 1.1 1.1 1.1 1.0 1.3 0.9 0.9 0.9 1.0 1.2 0.8 Oxidative stress defense
MnSOD 1.0 0.9 0.9 1.0 0.8 1.0 0.8 1.1 1.0 0.9 1.0 1.0 0.8 1.2 0.8
MPO 1.0 1.4 0.8 0.7 1.5 1.0 1.1 1.0 0.8 1.4 1.1 1.1 1.2 1.0 1.2
NQO1†† 1.2 0.8 1.1 0.9 1.2 1.5 1.0 1.5 1.1 0.9 1.2 - 1.0 1.0 Table 5. Gene variant-smoking intensity association in the CBCS, overall and by race*,†
*Odds ratios are race and age adjusted unless stratified by race or age, respectively; †Odds ratio not displayed if 95% CI width (upper limit/lower limit) >4; ‡Referent is never smokers for all smoking categories unless otherwise noted; ||SNP referent = homozygous for common allele, compared to heterozygotes + homozygous for less common alleles, GSTM1 & GSTT1
referent=present; **Primary functional category; gene may function in additional pathways e.g. COMT in estrogen metabolism; ††Could not be pooled. LRT p-value for race*smoking interaction term <0.05; Bold = Overall OR
z.
= ORz ≤0.7 = ORz ≥1.4
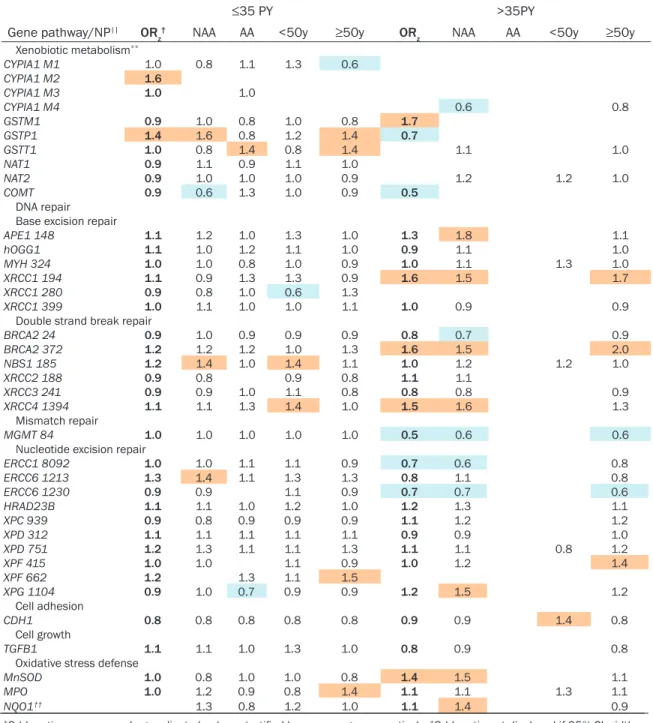
≤35 PY >35PY Gene pathway/NP|| OR
z† NAA AA <50y ≥50y ORz NAA AA <50y ≥50y
Xenobiotic metabolism**
CYPIA1 M1 1.0 0.8 1.1 1.3 0.6 999.0 -1.0 -1.0 -1.0 -1.0
CYPIA1 M2 1.6 -1.0 -.0 -1.0 -1.0 -99.0 99.0 -1.0 -9.0 -1.0
CYPIA1 M3 1.0 -1.0 1.0 -1.0 -1.0 -1.0 -1.0 -1.0 -1.0
CYPIA1 M4 99.0 -1.0 -.0 -1.0 -1.0 -99.0 0.6 -1.0 -1.0 0.8
GSTM1 0.9 1.0 0.8 1.0 0.8 1.7 -1.0 -1.0 -1.0 -1.0
GSTP1 1.4 1.6 0.8 1.2 1.4 0.7 -1.0 -1.0 -1.0 -1.0
GSTT1 1.0 0.8 1.4 0.8 1.4 -99.0 1.1 -1.0 -1.0 1.0
NAT1 0.9 1.1 0.9 1.1 1.0 -99.0 -1.0 -1.0 -1.0 -1.0
NAT2 0.9 1.0 1.0 1.0 0.9 -99.0 1.2 -1.0 1.2 1.0
COMT 0.9 0.6 1.3 1.0 0.9 0.5 -1.0 -1.0 -1.0 -1.0
DNA repair Base excision repair
APE1 148 1.1 1.2 1.0 1.3 1.0 1.3 1.8 -1.0 -1.0 1.1
hOGG1 1.1 1.0 1.2 1.1 1.0 0.9 1.1 -1.0 -1.0 1.0
MYH 324 1.0 1.0 0.8 1.0 0.9 1.0 1.1 -1.0 1.3 1.0
XRCC1 194 1.1 0.9 1.3 1.3 0.9 1.6 1.5 -1.0 -1.0 1.7
XRCC1 280 0.9 0.8 1.0 0.6 1.3 -99.0 -1.0 99.0 -1.0 -1.0
XRCC1 399 1.0 1.1 1.0 1.0 1.1 1.0 0.9 -1.0 -1.0 0.9
Double strand break repair
BRCA2 24 0.9 1.0 0.9 0.9 0.9 0.8 0.7 -1.0 -1.0 0.9
BRCA2 372 1.2 1.2 1.2 1.0 1.3 1.6 1.5 -1.0 -1.0 2.0
NBS1 185 1.2 1.4 1.0 1.4 1.1 1.0 1.2 -1.0 1.2 1.0
XRCC2 188 0.9 0.8 -.0 0.9 0.8 1.1 1.1 -1.0 -1.0 -1.0
XRCC3 241 0.9 0.9 1.0 1.1 0.8 0.8 0.8 -1.0 -1.0 0.9
XRCC4 1394 1.1 1.1 1.3 1.4 1.0 1.5 1.6 -1.0 -1.0 1.3
Mismatch repair
MGMT 84 1.0 1.0 1.0 1.0 1.0 0.5 0.6 -1.0 -1.0 0.6
Nucleotide excision repair
ERCC1 8092 1.0 1.0 1.1 1.1 0.9 0.7 0.6 -1.0 -1.0 0.8
ERCC6 1213 1.3 1.4 1.1 1.3 1.3 0.8 1.1 -1.0 -1.0 0.8
ERCC6 1230 0.9 0.9 1.0 1.1 0.9 0.7 0.7 -1.0 -1.0 0.6
HRAD23B 1.1 1.1 1.0 1.2 1.0 1.2 1.3 -1.0 -1.0 1.1
XPC 939 0.9 0.8 0.9 0.9 0.9 1.1 1.2 -1.0 -1.0 1.2
XPD 312 1.1 1.1 1.1 1.1 1.1 0.9 0.9 -1.0 -1.0 1.0
XPD 751 1.2 1.3 1.1 1.1 1.3 1.1 1.1 -1.0 0.8 1.2
XPF 415 1.0 1.0 -.0 1.1 0.9 1.0 1.2 999.0 -1.0 1.4
XPF 662 1.2 1.3 1.1 1.5 999.0 999.0 -1.0 -1.0 -1.0
XPG 1104 0.9 1.0 0.7 0.9 0.9 1.2 1.5 -1.0 -1.0 1.2
Cell adhesion
CDH1 0.8 0.8 0.8 0.8 0.8 0.9 0.9 -1.0 1.4 0.8
Cell growth
TGFB1 1.1 1.1 1.0 1.3 1.0 0.8 0.9 -1.0 -1.0 0.8
Oxidative stress defense
MnSOD 1.0 0.8 1.0 1.0 0.8 1.4 1.5 -1.0 -1.0 1.1
MPO 1.0 1.2 0.9 0.8 1.4 1.1 1.1 -1.0 1.3 1.1
NQO1†† 1.3 0.8 1.2 1.0 1.1 1.4 -1.0 -1.0 0.9
*Odds ratios are race and age adjusted unless stratified by race or age, respectively; †Odds ratio not displayed if 95% CI width (upper limit/lower limit) >4; ‡Referent is never smokers for all smoking categories unless otherwise noted; §Pack-years= midpoint of category for number of years smoked x midpoint of category for number of packs smoked/day; ||SNP referent = homozygous for common allele, compared to heterozygotes + homozygous for less common alleles, GSTM1 & GSTT1
referent=present; **Primary functional category; gene may function in additional pathways e. g. COMT in estrogen metabo-lism; ††Could not be pooled. LRT p-value for race*smoking interaction term <0.05; Bold = Overall OR
z.
Table 6. Gene variant-PY association in the CBCS, overall and by race*,†
= ORz ≤0.7 = ORz ≥1.4
The weighted kappa measures agreement beyond what would be expected due to chance alone using a multi-level ordinal scale to cate-gorize a series of subjects. The categories used for ORz were: a) ORz<0.9, b) 0.9≤ORz≤1.1 and c) ORz>1.1. Because race, age and gender distri-butions differed across the two studies, datas-ets restricted to white women 40-74 years of age were also compared. Due to reduced sam-ple size in the restricted NCCCS dataset, preci-sion requirements were relaxed (ORz with CLR <5 were included) to provide sufficient esti-mates for comparison of most polymorphisms. SAS 9.1 was used to calculate weighted kappa statistics [27].
We examined the effects of exposure mis-specification on ORz using different metrics for smoking classification.If the exposure mea-surement used to evaluate the independence assumption was too crude (e.g. ever/never smoking rather than dose, duration or PY), a sizable ORz could be missed. We also compared using the p-value for ORz when evaluating the independence assumption to using magnitude and precision (95%CI) of the estimate as a deci-sion tool.
Results
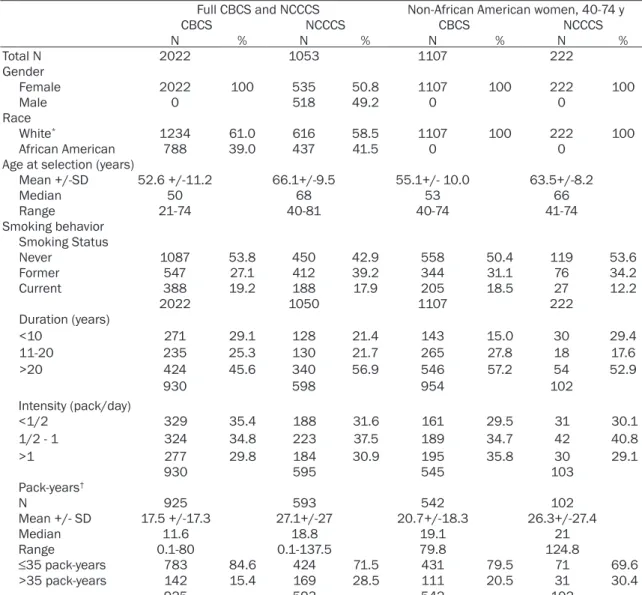
Characteristics of the two study populations are presented in Table 1. Controls from the NCCCS were older than the CBCS and included both men and women. Consistent with gender and age differences in smoking prevalence in the US [29, 30], there was a higher proportion of never smokers and a shorter average smok-ing duration in CBCS controls compared to the NCCCS.
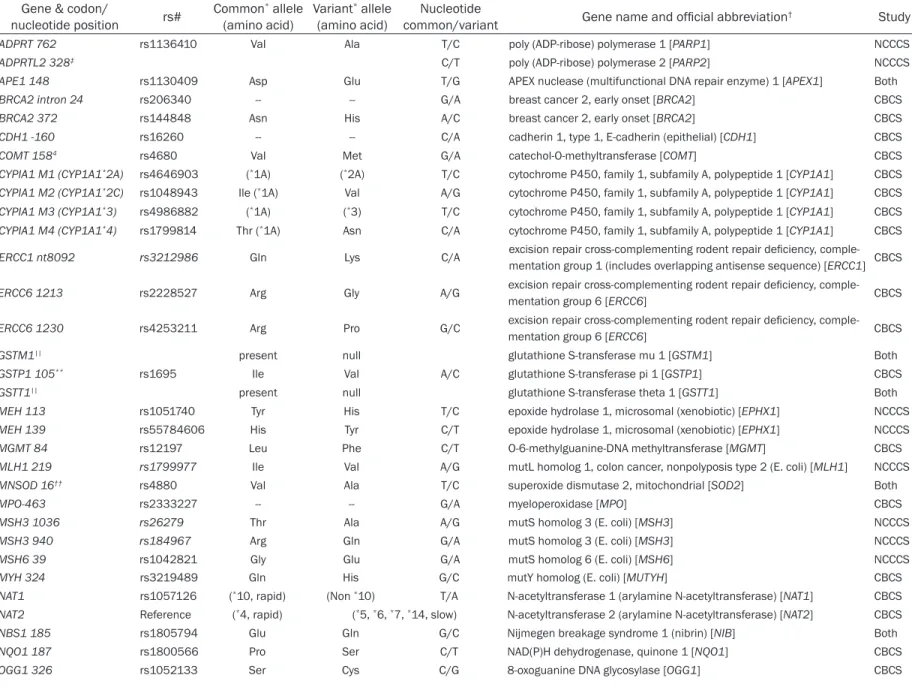
In the CBCS, 38 polymorphisms in 29 genes were evaluated; 17 were DNA repair genes. In the NCCCS, 25 polymorphisms and four haplo-types from 19 genes were evaluated. Fifteen genes were DNA repair genes. Table 2 provides the rs# and official name for each SNP.
Four SNPs (3%) were out of Hardy Weinberg equilibrium (α=0.05), two in CBCS controls (CYP1A1 in non-African Americans, XRCC3 241 in African Americans) and two in NCCCS con-trols (RAD23B and XPF 415 in non-African Americans) approximately what one would expect by chance alone. Percent ‘any variant’ for all loci, with the exception of GSTT1, was
consistent between the CBCS and NCCCS with-in race. Allele frequencies and HWE p-values for CBCS and NCCCS controls, stratified by race, are available on request.
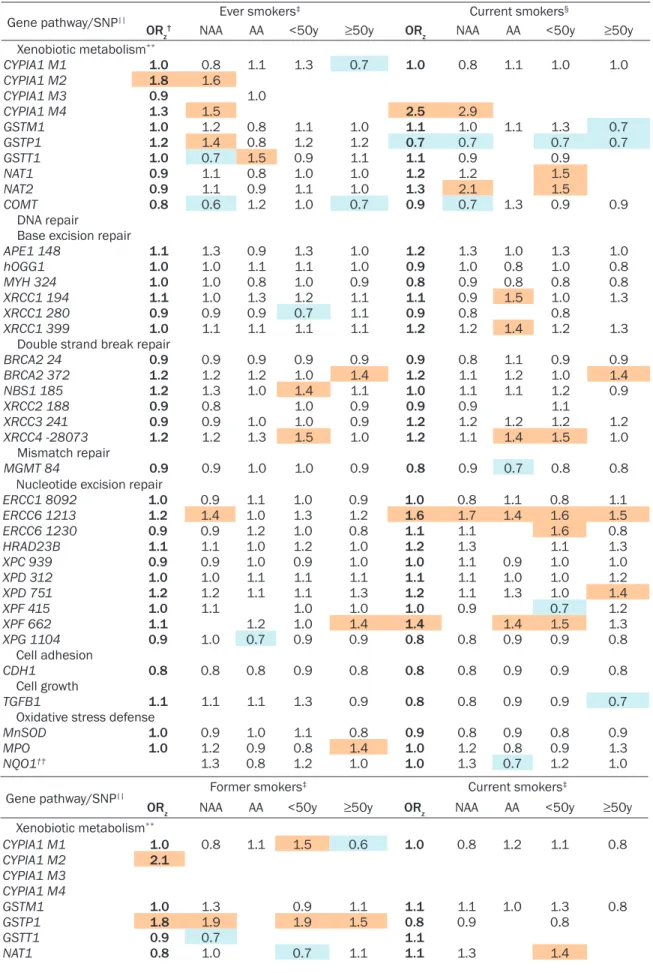
Tables 3-6 and Tables 7-11 present overall and race-, age- and gender-stratified ORz for CBCS and NCCCS, respectively. All results are adjust-ed for race, age [continuous] and gender unless stratified by that same factor.
All models were adjusted for matching vari-ables (race, age and gender) unless stratified or restricted by these factors. Approximately half of the polymorphisms in the CBCS showed joint confounding by race and age (difference of |>0.15| in β coefficients), almost entirely in for-mer smoking and/or >35 PY. Confounding by race and age were more marked in measures of smoking amount than smoking status. Unadjusted and race-, age-, and gender-adjust-ed estimates did not vary substantially in the NCCCS. Family history of any cancer and family income were not confounders in either dataset.
CBCS
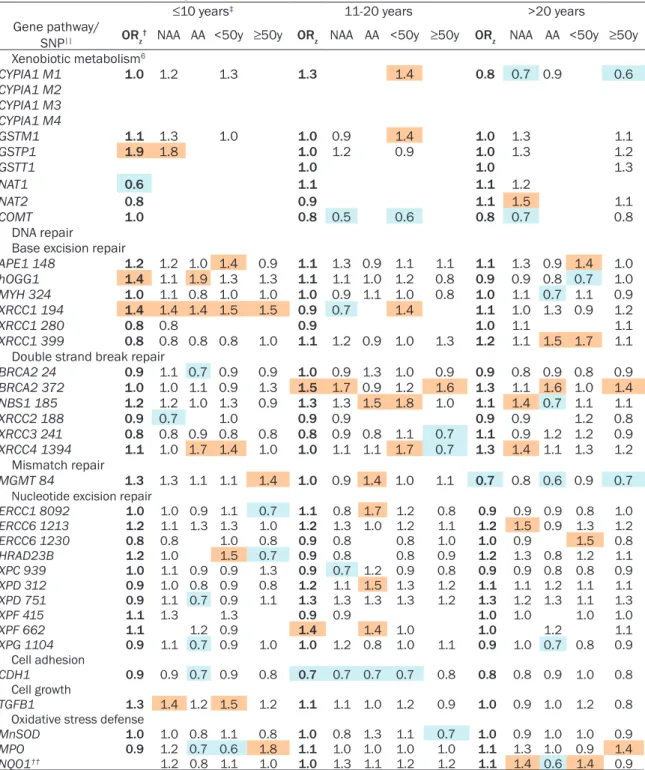
Xenobiotic metabolizing genes were slightly overrepresented among the SNPs showing moderate associations with smoking behavior (range: 0.5 - 2.5). DNA repair genes were over-represented among the weaker associations (0.7-1.6). Among the metabolism genes, CYP1A1 M2 was associated with smoking sta-tus and <35 PY (vs. never). COMT was inversely associated with high intensity and >35 PY of smoking, but not with any measures of smoking status. Among DNA repair genes, XPF 662, XRCC1 194, BRCA2 372, and MGMT 84 showed associations with smoking behavior, particularly for smoking amount (duration, dose or PY). Of the 21 evaluable DNA repair genes, six were associated with high PY, with four of them (ERCC6 1230, ERCC1 8092 and XRCC4 -28073, MnSOD) associated only with PY but not smoking status, duration or intensity. In the CBCS, three SNPs showed consistency across smoking categories with mmORzs in at least one smoking status category and at least one smoking dose category: CYP1A1 M2, GSTP1, and XPF 662 (Tables 3-6).
Gene pathway/ Gene variant||
Ever Current vs. not current
ORz† W M NAA AA <65y ≥65y ORz W M NAA AA <65y ≥65y Xenobiotic metabolism**
GST hap C†† 1.2 1.3 1.1 1.0 1.7 1.4 1.1 1.0 1.4 0.9 0.7 1.5 1.0 1.1 GST hap A‡‡ 1.4 1.6 1.2 0.9 2.2 1.8 1.1 1.5 1.4 2.3 1.5 1.4
GST hap B‡‡ 0.8 0.8 0.6 0.7 ## -1.0 0.7 0.6 -1.0
GST hap D‡‡ 1.3 1.3 1.3 1.2 1.7 1.6 1.1 0.9 0.7 0.8 -1.0 1.0 0.8 GSTM1 1.0 1.0 1.0 1.0 1.1 1.0 1.0 0.7 1.1 0.5 0.8 0.7 0.7 0.8
GSTT1§§ 1.0 0.9 0.7 1.5 1.0 0.9 1.1 1.1 0.7 1.8 1.0 1.3
MEH 113 0.7 0.7 0.8 0.8 0.7 0.7 0.9 0.8 0.6 0.6 0.7 0.5 0.5 0.8
MEH 139 0.8 1.3 1.0 1.0 1.5 1.1 1.2 0.6 1.0 0.7 0.8 -1.0 0.8 0.9
DNA repair
POLD1 119 0.7 1.2 0.9 1.1 ## 1.3 0.9 0.8 1.1 0.8 1.1 -1.0 1.2 0.7 Base excision repair
ADPRT 762 1.1 1.3 0.9 1.1 ## 1.1 1.1 1.2 1.8 0.9 1.1 -1.0 1.3 1.1
ADPRTL2 328 1.1 1.2 1.0 1.2 ## 1.1 1.1 1.1 ## 1.0 1.2 -1.0 1.0 1.1
APE1 148 1.1 1.3 1.0 1.2 1.0 1.1 1.1 1.0 1.2 0.9 1.2 0.9 0.8 1.3
XRCC1 194 0.8 0.6 ## 0.8 0.9 -1.0 0.8 0.9 -1.0
XRCC1 280 1.3 ## ## 1.2 ## -1.0 -1.0
XRCC1 399 1.1 1.3 0.9 1.1 1.0 0.8 1.3 1.0 0.8 1.1 0.9 1.0 0.7 1.3 Double strand break repair
NBS1 185 0.9 0.7 0.7 0.7 0.7 0.6 0.8 0.8 0.7 0.9 1.4 0.6 0.9 0.7
XRCC3 241 0.9 0.7 1.1 0.8 1.1 0.9 0.9 1.1 1.2 1.1 1.2 1.1 1.2 1.1 Mismatch repair
MLH1 219 1.1 0.7 1.3 0.8 1.3 1.6 0.8 0.8 0.9 1.3 0.9 1.4 1.2 1.1
MSH3 1036 1.1 1.8 0.8 1.2 1.3 1.4 1.1 1.0 0.9 0.6 0.6 -1.0 1.0 -1.0
MSH3 940 1.2 1.1 0.7 0.9 0.8 0.8 0.9 0.7 0.8 0.6 0.6 0.7 0.8 0.6
MSH6 39 0.9 0.8 1.0 0.9 0.9 1.0 0.8 0.7 0.8 0.8 0.6 1.2 0.9 0.8 Nucleotide excision repair
RAD23B 1.1 0.6 0.9 0.7 0.9 0.9 0.7 1.0 0.4 1.0 0.8 0.7 0.8 0.7
XPC 499 0.8 0.9 0.8 0.8 1.3 1.1 0.8 1.1 1.0 1.1 0.9 1.1 1.0
XPC 939 1.2 1.3 1.1 1.3 1.1 1.0 1.3 1.0 1.2 0.8 1.1 0.8 0.8 1.1
XPD 312 1.0 1.1 0.9 1.0 1.0 1.1 1.0 0.9 0.9 0.8 0.9 1.1 0.7
XPD 751 1.2 1.4 1.1 1.2 1.2 1.4 1.2 1.0 1.1 0.9 0.8 1.3 1.1 0.9
XPF 415 1.0 1.7 1.1 -1.0 1.1 1.3 1.5 1.7 -1.0
XPG 1104 1.0 1.1 0.8 0.9 1.0 1.4 0.8 1.2 1.2 1.2 1.1 1.4 1.7 0.9 Oxidative stress defense
MNSOD 1.0 1.2 0.9 1.1 1.0 1.2 0.9 1.1 0.8 1.1 1.1 0.9 0.9 1.1
Table 7. Gene variant-smoking status associations in the NCCCS, overall and by gender and race*,†
*Odds ratios are race, age and gender adjusted unless stratified by race, age or gender, respectively; †Odds ratio not displayed if confidence limit ratio >4; ‡Referent is never smokers for all smoking categories unless otherwise noted; § Referent is not-current smokers (former + never); ||SNP referent = homozygous for common allele, compared to heterozygotes + homozygous for less common alleles, GSTM1 & GSTT1 referent=present; **Primary functional category; gene may function in additional pathways e.g. COMT in estrogen metabolism; ††GST hap C = haplotype of GSTT1 present & GSTM1 present (referent) vs. all other GSTT1 & GSTM1 combinations of present and null combined; ‡‡GST hap A=GSTT1 null & GSTM1 present, GST hap B=GSTT1 null & GSTM1 null, GST hap D=GSTT1 present & GSTM1 null; GST hap C is referent; ***Pack-years= midpoint of category for number of years smoked x midpoint of category for number of packs smoked/day; §§Could not be pooled for some measures of smoking. LRT p-value for race*smoking interaction term <0.05; Bold = Overall OR
z. = ORz ≤0.7
= ORz ≥1.4
Former Current Gene pathway/
Gene variant|| ORz† W M NAA AA <65y ≥65y ORz W M NAA AA <65y ≥65y Xenobiotic metabolism **
GST hap C†† 1.3 1.2 1.2 1.0 1.6 1.5 1.1 1.2 1.5 1.0 0.8 1.9 1.2 1.1 GST hap A‡‡ 1.3 1.5 1.1 0.9 1.7 -1.0 1.0 1.7 1.0 -1.0 -1.0 1.0 -1.0 -1.0 GST hap B‡‡ 0.9 1.0 -.0 0.8 -.0 -1.0 0.7 -1.0 1.0 -1.0 -1.0 -.0 -1.0 -1.0 GST hap D‡‡ 1.4 1.3 1.5 1.2 -.0 1.8 1.2 1.1 -.0 0.9 0.9 -.0 -1.0 -1.0 GSTM1 1.2 1.0 1.2 1.1 1.3 1.2 1.1 0.8 1.1 0.6 0.8 -.0 0.8 0.8
GSTT1 0.9 1.0 0.8 0.8 1.2 1.0 0.8 1.1 1.0 0.6 2.0 1.0 1.1
MEH 113 0.8 0.8 0.9 0.8 0.9 0.8 0.9 0.7 0.6 0.6 0.6 0.5 0.4 0.7
MEH 139 0.9 1.3 1.1 1.1 -.0 1.3 1.2 0.6 1.1 0.8 0.8 -.0 0.9 1.0 DNA repair
POLD1 119 0.7 1.2 1.0 1.1 -.0 1.3 1.0 0.7 1.0 0.8 1.2 -.0 1.3 -1.0
Base excision repair
ADPRT 762 1.0 1.1 0.9 1.1 -.0 1.0 1.1 1.2 -.0 0.8 1.1 -.0 1.2 -1.0
ADPRTL2 328 1.1 1.1 1.0 1.2 -.0 1.1 1.1 1.1 -.0 1.0 1.3 -.0 1.1 1.2
APE1 148 1.1 1.3 1.0 1.2 1.0 1.3 1.0 1.1 1.3 0.9 1.3 0.9 0.9 1.3
XRCC1 194 0.8 0.6 1.0 0.7 -.0 -1.0 0.8 0.8 -.0 -1.0 -1.0 -.0 -1.0 -1.0
XRCC1 280 1.3 1.0 -.0 1.3 -.0 -1.0 -1.0 -1.0 -.0 -1.0 -1.0 1.0 -1.0 -1.0
XRCC1 399 1.1 1.5 0.8 1.2 0.9 0.9 1.3 1.0 0.9 1.0 1.0 -.0 0.6 1.5 Double strand break repair
NBS1 185 0.9 0.7 0.8 0.6 0.8 0.6 0.8 0.8 -.0 0.7 1.1 0.5 0.7 0.7
XRCC3 241 0.8 0.7 1.1 0.7 1.1 0.8 0.9 1.0 1.0 1.1 1.0 1.2 1.1 1.0 Mismatch repair
MLH1 219 1.2 0.7 1.3 0.8 1.2 1.6 0.7 0.9 0.8 1.5 0.8 1.5 1.5 0.9
MSH3 1036 1.1 2.1 0.9 1.4 1.5 1.5 1.3 1.0 1.0 -1.0 0.7 -.0 -1.0 -1.0
MSH3 940 1.4 1.2 0.8 1.0 0.8 0.8 1.0 0.8 0.8 0.6 0.7 0.7 0.7 0.6
MSH6 39 1.0 0.8 1.0 1.0 0.8 1.1 0.8 0.7 0.8 0.9 0.6 1.1 0.9 0.8
Nucleotide excision repair
RAD23B 1.1 0.7 0.9 0.7 1.0 1.0 0.7 1.0 0.4 1.0 0.7 0.7 0.8 0.6
XPC 499 0.8 0.9 0.7 0.7 -.0 1.0 0.7 1.0 0.9 0.9 0.8 -.0 1.1 0.9
XPC 939 1.3 1.3 1.2 1.3 1.2 1.1 1.3 1.1 1.4 0.9 1.3 0.9 0.9 1.2
XPD 312 1.1 1.2 0.9 1.0 1.1 1.1 1.1 0.9 1.0 0.8 0.9 1.0 1.2 0.7
XPD 751 1.3 1.5 1.1 1.3 1.1 1.4 1.2 1.1 1.3 0.9 1.0 1.3 1.3 1.0
XPF 415 0.9 -.0 -.0 0.9 -.0 -1.0 1.1 1.2 1.0 -1.0 1.6 -.0 -1.0 -1.0
XPG 1104 0.9 1.1 0.8 0.9 0.9 1.1 0.8 1.2 1.2 1.0 1.0 1.4 1.8 0.8 Oxidative stress defense
MNSOD 1.0 1.4 0.8 1.1 1.0 1.4 0.9 1.1 0.9 1.0 1.1 0.9 1.0 1.0
Table 8. Gene variant-smoking status associations in the NCCCS, overall and by gender and race*,†
*Odds ratios are race, age and gender adjusted unless stratified by race, age or gender, respectively; †Odds ratio not displayed if confidence limit ratio >4; ‡Referent is never smokers for all smoking categories unless otherwise noted; ||SNP referent = homozygous for common allele, compared to heterozygotes + homozygous for less common alleles, GSTM1 & GSTT1
referent=present; **Primary functional category; gene may function in additional pathways e.g. COMT in estrogen metabolism; ††GST hap C = haplotype of GSTT1 present & GSTM1 present (referent) vs. all other GSTT1 & GSTM1 combinations of present and null combined; ‡‡GST hap A=GSTT1 null & GSTM1 present, GST hap B=GSTT1 null & GSTM1 null, GST hap D=GSTT1 pres-ent & GSTM1 null; GST hap C is referent; ***Pack-years= midpoint of category for number of years smoked x midpoint of cat-egory for number of packs smoked/day; §§Could not be pooled for some measures of smoking. LRT p-value for race*smoking interaction term <0.05; Bold = Overall ORz.
= ORz <=0.7 = ORz >=1.4
Table 9. Gene variant-smoking duration association in the NCCCS, overall and by gender and race*,†
<10y 11-20y >20 y
Gene pathway/
Gene variant|| ORz† W M NAA AA Y O ORz W M NAA AA Y O ORz W M NAA AA Y O Xenobiotic metabolism**
GST hap C†† 1.5 1.6 1.4 1.3 1.2 1.1 - 0.9 1.0 1.1 1.0 1.2 1.2 1.1 0.8 1.1 1.0 GST hap A‡‡ 1.6 .0 -1.0 .0 1.3 1 -1.0 -.0 -.0 1.4 1.6 1.2 0.7
GST hap B‡‡ -0 -1.0 -. -1 1 -1.0 -.0 1.0 0.7 1.0 -.0 0.6 GST hap D‡‡ 1.7 -0 1.6 10 1.1 1 1.1 -.0 1.0 1.2 1.3 1.2 1.0
GSTM1 1.3 1.2 1.3 1.2 1.1 0.9 1 0.8 1.0 0.8 1.0 1.0 1.0 1.0 1.0 0.8 1.0
GSTT1 1.0 1.3 0.8 0.8 0.9 1.0 - 1.0 0.9 1.1 0.9 0.9 1.0 0.9 0.6 1.1 0.9
MEH 113 0.7 1.1 1.0 1.0 1.4 0.7 1 0.9 0.8 0.9 0.7 0.8 0.6 0.7 0.7 0.9 0.7
MEH 139 1.0 1.2 1.4 1.4 1.3 0.8 1 0.8 1.0 1.0 1.5 0.7 1.3 0.9 0.9 1.5 DNA repair
POLD1 119 0.7 1.0 -.0 1.2 - 0.9 0 0.9 -.0 -.0 0.7 1.2 1.0 1.2 Base excision repair
ADPRT 762 1.2 1.0 1.4 -.0 0.7 1 0.7 -.0 -.0 1.2 1.5 1.0 1.1
ADPRTL2 328 1.0 0.7 1.1 0.9 1.0 1.2 1.2 -.0 -.0 1.2 1.3 1.0 1.3
APE1 148 1.4 0.8 1.3 1.3 1.1 1 1.8 1.2 1.0 1.2 1.0 1.3 0.8 1.2 1.0 1.2
XRCC1 194 1.0 -1.0 -1. -.0 1 -.0 -.0 0.9 1.0 -.0 0.8
XRCC1 280 1.0 1.0 -1.0 -1. -1.0 1 -.0 1.0 1.2 1.0 -.0 -1.0
XRCC1 399 1.3 1.1 1.3 1.3 1.7 1.2 0 0.9 1.2 1.0 1.8 1.0 1.2 0.8 1.0 1.8 Double strand break repair
NBS1 185 0.9 1.0 1.0 -1.0 -.0 1.2 1 0.9 -1.0 -.0 -.0 0.8 0.6 0.7 0.8
XRCC3 241 0.7 0.5 1.1 0.7 0.7 0.7 . 0.7 0.6 1.0 0.5 1.0 0.9 1.3 0.9 1.0 0.5 Mismatch repair
MLH1 219 1.4 1.1 0.8 0.9 1.0 1 1.0 1.0 1.0 1.1 0.6 1.2 0.8 1.0
MSH3 1036 1.0 -.0 1.2 1.2 1.1 0 1.2 1.0 1.5 1.0 1.4 0.8 1.2 1.5
MSH3 940 1.2 1.0 -.0 1.0 0.7 1.6 0 1.0 0.9 -.0 1.3 1.1 1.2 0.7 0.9 1.3
MSH6 39 0.8 0.9 1.0 1.0 .9 1.0 0.9 0 1.2 1.1 1.7 1.0 0.9 0.6 0.9 0.8 1.7 1.0 Nucleotide excision repair
RAD23B 1.2 0.5 1.0 0.8 1.1 0.5 0.8 1.0 0.7 0.9 0.7 1.1 0.7 0.9 0.7 0.9 0.7
XPC 499 0.8 1.0 0.7 0.7 0.6 0.9 0.7 0.7 1.3 0.9 0.8 0.9 0.8 1.3
XPC 939 1.0 0.9 1.1 0.9 0.7 1.3 1.1 1.2 1.2 1.0 1.0 1.1 1.3 1.8 1.1 1.6 1.0 1.0 1.1
XPD 312 1.3 1.1 1.3 1.2 1.3 1.0 0.9 1.0 0.8 0.9 1.1 0.8 0.9 - 0.8
XPD 751 1.5 1.9 1.2 1.6 1.4 1.5 1.3 1.8 1.3 1.8 1.0 1.2 0.9 1.0 1.3 1.8
XPF 415 1.0 1.0 .0 1.0 1.1 1.0 -.0 1.2
XPG 1104 0.7 1.0 0.8 0.8 0.7 0.8 0.6 0.6 1.3 0.5 1.2 1.5 1.0 1.1 1.3 0.5 Oxidative stress defense
MNSOD 1.0 1.2 0.8 1.1 1.2 0.9 1.4 0.8 1.1 1.3 0.9 0.9 1.1 0.9 1.1 1.3 0.9
*Odds ratios are race, age and gender adjusted unless stratified by race, age or gender, respectively; †Odds ratio not displayed if confidence limit ratio >4; ‡Referent is never smokers for all smoking categories unless otherwise noted; ||SNP referent = homozy-gous for common allele, compared to heterozygotes + homozyhomozy-gous for less common alleles, GSTM1 & GSTT1 referent=present; **Primary functional category; gene may function in additional pathways e.g. COMT in estrogen metabolism; ††GST hap C = hap-lotype of GSTT1 present & GSTM1 present (referent) vs. all other GSTT1 & GSTM1 combinations of present and null combined; ‡‡GST hap A=GSTT1 null & GSTM1 present, GST hap B=GSTT1 null & GSTM1 null, GST hap D=GSTT1 present & GSTM1 null; GST hap C is referent; ***Pack-years= midpoint of category for number of years smoked x midpoint of category for number of packs smoked/day; §§Could not be pooled for some measures of smoking. LRT p-value for race*smoking interaction term <0.05; Bold = Overall ORz.
= ORz ≤0.7 = ORz ≥1.4
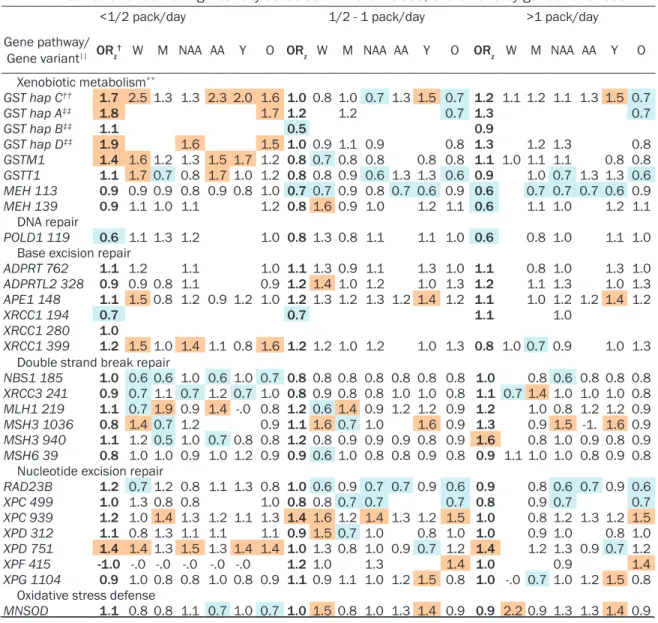
<1/2 pack/day 1/2 - 1 pack/day >1 pack/day Gene pathway/
Gene variant|| ORz† W M NAA AA Y O ORz W M NAA AA Y O ORz W M NAA AA Y O Xenobiotic metabolism**
GST hap C†† 1.7 2.5 1.3 1.3 2.3 2.0 1.6 1.0 0.8 1.0 0.7 1.3 1.5 0.7 1.2 1.1 1.2 1.1 1.3 1.5 0.7 GST hap A‡‡ 1.8 1.7 1.2 -.0 1.2 -1.0 -.0 -1 0.7 1.3 1 - -1 1. 0.7 GST hap B‡‡ 1.1 1.0 -.0 -1.0 1.0 1 -1.0 0.5 -1. 1.0 -1.0 -.0 - -1.0 0.9 -. -. -1 -. -1 -1.0 GST hap D‡‡ 1.9 -.0 -.0 1.6 1.0 1 1.5 1.0 0.9 1.1 0.9 -.0 -1 0.8 1.3 -. 1.2 1.3 - -1 0.8 GSTM1 1.4 1.6 1.2 1.3 1.5 1.7 1.2 0.8 0.7 0.8 0.8 -.0 0.8 0.8 1.1 1.0 1.1 1.1 - 0.8 0.8
GSTT1 1.1 1.7 0.7 0.8 1.7 1.0 1.2 0.8 0.8 0.9 0.6 1.3 1.3 0.6 0.9 -. 1.0 0.7 1.3 1.3 0.6
MEH 113 0.9 0.9 0.9 0.8 0.9 0.8 1.0 0.7 0.7 0.9 0.8 0.7 0.6 0.9 0.6 -. 0.7 0.7 0.7 0.6 0.9
MEH 139 0.9 1.1 1.0 1.1 1.0 1 1.2 0.8 1.6 0.9 1.0 -1. 1.2 1.1 0.6 - 1.1 1.0 -. 1.2 1.1 DNA repair
POLD1 119 0.6 1.1 1.3 1.2 -.0 1 1.0 0.8 1.3 0.8 1.1 1.0 1.1 1.0 0.6 1 0.8 1.0 -. 1.1 1.0 Base excision repair
ADPRT 762 1.1 1.2 10 1.1 -.0 - 1.0 1.1 1.3 0.9 1.1 -1. 1.3 1.0 1.1 - 0.8 1.0 1.3 1.0
ADPRTL2 328 0.9 0.9 0.8 1.1 1.0 - 0.9 1.2 1.4 1.0 1.2 -.0 1.0 1.3 1.2 -. 1.1 1.3 -. 1.0 1.3
APE1 148 1.1 1.5 0.8 1.2 0.9 1.2 1.0 1.2 1.3 1.2 1.3 1.2 1.4 1.2 1.1 1 1.0 1.2 1.2 1.4 1.2
XRCC1 194 0.7 -0 -.0 1.0 -.0 -.0 -.0 0.7 1.0 -.0 -.0 -.0 -.0 -1.0 1.1 -. -. 1.0 -. -. -.0
XRCC1 280 1.0 1.0 -. 1.0 -.0 -.0 -.0 -.0 1.0 10 -.0 -.0 -.0 -1.0 -1.0 -. -. - -. -.0
XRCC1 399 1.2 1.5 1.0 1.4 1.1 0.8 1.6 1.2 1.2 1.0 1.2 -.0 1.0 1.3 0.8 1.0 0.7 0.9 -. 1.0 1.3 Double strand break repair
NBS1 185 1.0 0.6 0.6 1.0 0.6 1.0 0.7 0.8 0.8 0.8 0.8 0.8 0.8 0.8 1.0 1.0 0.8 0.6 0.8 0.8 0.8
XRCC3 241 0.9 0.7 1.1 0.7 1.2 0.7 1.0 0.8 0.9 0.8 0.8 1.0 1.0 0.8 1.1 0.7 1.4 1.0 1.0 1.0 0.8
MLH1 219 1.1 0.7 1.9 0.9 1.4 -.0 0.8 1.2 0.6 1.4 0.9 1.2 1.2 0.9 1.2 1.0 1.0 0.8 1.2 1.2 0.9
MSH3 1036 0.8 1.4 0.7 1.2 -.0 1.0 0.9 1.1 1.6 0.7 1.0 -.0 1.6 0.9 1.3 1.0 0.9 1.5 -1. 1.6 0.9
MSH3 940 1.1 1.2 0.5 1.0 0.7 0.8 0.8 1.2 0.8 0.9 0.9 0.9 0.8 0.9 1.6 -.0 0.8 1.0 0.9 0.8 0.9
MSH6 39 0.8 1.0 1.0 0.9 1.0 1.2 0.9 0.9 0.6 1.0 0.8 0.8 0.9 0.8 0.9 1.1 1.0 1.0 0.8 0.9 0.8 Nucleotide excision repair
RAD23B 1.2 0.7 1.2 0.8 1.1 1.3 0.8 1.0 0.6 0.9 0.7 0.7 0.9 0.6 0.9 1.0 0.8 0.6 0.7 0.9 0.6
XPC 499 1.0 1.3 0.8 0.8 -.0 -.0 1.0 0.8 0.8 0.7 0.7 -.0 -.0 0.7 0.8 -.0 0.9 0.7 -.0 1.0 0.7
XPC 939 1.2 1.0 1.4 1.3 1.2 1.1 1.3 1.4 1.6 1.2 1.4 1.3 1.2 1.5 1.0 -.0 0.8 1.2 1.3 1.2 1.5
XPD 312 1.1 0.8 1.3 1.1 1.1 -.0 1.1 0.9 1.5 0.7 1.0 -.0 0.8 1.0 1.0 -.0 0.9 1.0 1.0 0.8 1.0
XPD 751 1.4 1.4 1.3 1.5 1.3 1.4 1.4 1.0 1.3 0.8 1.0 0.9 0.7 1.2 1.4 -.0 1.2 1.3 0.9 0.7 1.2
XPF 415 -1.0 -.0 -.0 -.0 -.0 -.0 -.0 1.2 1.0 -.0 1.3 -.0 -.0 1.4 1.0 -.0 -.0 0.9 -.0 -.0 1.4
XPG 1104 0.9 1.0 0.8 0.8 1.0 0.8 0.9 1.1 0.9 1.1 1.0 1.2 1.5 0.8 1.0 -.0 0.7 1.0 1.2 1.5 0.8 Oxidative stress defense
MNSOD 1.1 0.8 0.8 1.1 0.7 1.0 0.7 1.0 1.5 0.8 1.0 1.3 1.4 0.9 0.9 2.2 0.9 1.3 1.3 1.4 0.9
*Odds ratios are race, age and gender adjusted unless stratified by race, age or gender, respectively; Odds ratio not displayed if 95% confidence limit ratio (upper limit/lower limit) >4; †Odds ratio not displayed if confidence limit ratio >4; ‡Referent is never smokers for all smoking categories unless otherwise noted; ||SNP referent = homozygous for common allele, compared to het-erozygotes + homozygous for less common alleles, GSTM1 & GSTT1 referent=present; **Primary functional category; gene may function in additional pathways e.g. COMT in estrogen metabolism; ††GST hap C = haplotype of GSTT1 present & GSTM1 present (referent) vs. all other GSTT1 & GSTM1 combinations of present and null combined; ‡‡GST hap A=GSTT1 null & GSTM1 present,
GST hap B=GSTT1 null & GSTM1 null, GST hap D=GSTT1 present & GSTM1 null; GST hap C is referent; ***Pack-years= midpoint of category for number of years smoked x midpoint of category for number of packs smoked/day; §§Could not be pooled for some measures of smoking. LRT p-value for race*smoking interaction term <0.05; Bold = Overall OR
z.
Table 10. Gene variant-smoking intensity association in the NCCCS, overall and by gender and race*,†
= ORz ≤0.7 = ORz ≥1.4
≤35 PY*** >35PY*** Gene pathway/
Gene variant|| ORz† W M NAA AA <65y ≥65y ORz W M NAA AA <65y ≥65y Xenobiotic metabolism**
GST hap C†† 1.3 1.6 1.1 1.1 1.7 1.5 1.2 1.0 1.0 1.1 0.8 1.0 -1.0 1.0 GST hap A‡‡ 1.5 1.9 1.2 1.0 2.1 -1.0 1.2 1.2 -.0 1.0 -1.0 1.0 -1.0 -1.0 GST hap B‡‡ 0.8 1.2 -.0 0.8 -.0 -1.0 -1.0 -1.0 1.0 -.0 -1.0 -.0 -1.0 -1.0 GST hap D‡‡ 1.4 1.6 1.3 1.3 1.8 1.8 1.2 1.0 -.0 1.2 1.0 -.0 -1.0 0.9 GSTM1 1.1 1.3 1.0 1.1 1.1 1.1 1.1 0.9 -.0 1.0 0.9 1.0 -1.0 1.0
GSTT1 1.2 0.8 0.8 1.4 1.1 0.9 -.0 0.9 0.6 -.0 -1.0 0.9
MEH 113 0.8 0.7 0.9 0.8 0.8 0.7 1.0 0.7 -1. 0.6 0.7 -.0 -1.0 0.6
MEH 139 0.8 1.4 1.0 1.1 1.4 1.2 1.2 0.6 1.0 1.0 0.9 -.0 -1.0 1.2
DNA repair
POLD1 119 0.7 1.1 0.9 1.0 -.0 1.2 0.9 0.6 1.0 1.0 1.2 1.0 -1.0 1.0 Base excision repair
ADPRT 762 1.1 1.2 1.0 1.2 1.0 1.0 1.2 1.0 1.0 -.0 1.0 -.0 -1.0 0.9
ADPRTL2 328 1.1 1.2 1.0 1.2 1.0 1.0 1.1 1.2 -.0 1.0 1.2 -.0 -1.0 1.2
APE1 148 1.1 1.2 0.9 1.2 1.0 1.1 1.0 1.2 1.0 1.0 1.4 -.0 -1.0 1.3
XRCC1 194 0.8 0.5 -.0 0.7 0.9 -1.0 0.7 0.8 -.0 -.0 -1.0 -.0 -1.0 -1.0
XRCC1 280 1.2 1.0 -.0 -1.0 1.0 -1.0 -1.0 -1.0 -.0 -.0 -1.0 - -1.0 -1.0
XRCC1 399 1.2 1.2 1.0 1.3 1.0 0.8 1.4 0.9 -.0 0.7 0.9 -.0 -1.0 1.0 Double strand break repair
NBS1 185 1.0 0.7 0.8 0.7 0.7 0.7 0.8 0.8 -.0 0.6 -1.0 -.0 -1.0 0.7
XRCC3 241 0.8 0.8 0.9 0.7 1.1 0.9 0.8 1.1 1.0 1.5 1.1 -.0 -1.0 1.2 Mismatch repair
MLH1 219 1.2 0.8 1.6 1.0 1.3 1.8 0.9 1.0 -.0 1.0 0.6 -.0 -1.0 0.6
MSH3 1036 1.0 1.7 0.8 1.1 1.3 1.4 1.1 1.5 1.0 0.8 1.3 -.0 -1.0 1.3
MSH3 940 1.2 0.9 0.7 0.9 0.8 0.8 0.9 1.3 1.0 0.7 1.0 -.0 -1.0 1.1
MSH6 39 0.8 0.9 1.0 1.0 0.9 1.1 0.9 1.0 1.0 0.9 0.7 -.0 -1.0 0.7 Nucleotide excision repair
RAD23B 1.0 0.6 1.0 0.7 0.9 0.9 0.7 1.1 1.0 0.8 0.7 -.0 -1.0 0.5
XPC 499 0.9 1.1 0.8 0.8 1.3 1.0 0.9 0.7 1.0 0.8 0.6 1.0 -1.0 0.6
XPC 939 1.1 1.1 1.1 1.2 1.1 1.0 1.3 1.5 1.0 1.1 1.6 1.0 -1.0 1.6
XPD 312 1.0 1.0 1.0 1.0 1.0 1.0 1.0 1.0 1.0 0.8 0.9 1.0 -1.0 0.8
XPD 751 1.2 1.4 1.1 1.3 1.1 1.2 1.3 1.2 1.0 1.0 1.0 1.0 -1.0 0.9
XPF 415 0.9 10 -.0 1.0 1.0 -1.0 1.1 1.1 1.0 -.0 1.1 1.0 -1.0
XPG 1104 0.9 0.9 0.8 0.8 1.0 1.1 0.8 1.3 1.0 0.9 1.3 1.0 -1.0 0.8 Oxidative stress defense
MNSOD 1.1 1.1 0.8 1.0 0.9 1.2 0.8 0.8 1.0 1.1 1.5 1.0 -1.0 1.4
Table 11. Gene variant-pack-years of smoking association in the NCCCS, overall and by gender and race*,†
*Odds ratios are race, age and gender adjusted unless stratified by race, age or gender, respectively; †Odds ratio not displayed
if confidence limit ratio >4; ‡Referent is never smokers for all smoking categories unless otherwise noted; ||SNP referent
= homozygous for common allele, compared to heterozygotes + homozygous for less common alleles, GSTM1 & GSTT1
referent=present; **Primary functional category; gene may function in additional pathways e.g. COMT in estrogen metabolism; ††GST hap C = haplotype of GSTT1 present & GSTM1 present (referent) vs. all other GSTT1 & GSTM1 combinations of present and null combined; ‡‡GST hap A=GSTT1 null & GSTM1 present, GST hap B=GSTT1 null & GSTM1 null, GST hap D=GSTT1 pres-ent & GSTM1 null; GST hap C is referent; *** Pack-years= midpoint of category for number of years smoked x midpoint of cat-egory for number of packs smoked/day; §§Could not be pooled for some measures of smoking. LRT p-value for race*smoking interaction term <0.05; Bold = Overall ORz.
= ORz ≤0.7 = ORz ≥1.4
other metabolism gene and two DNA repair genes (both NER) showed moderate associa-tions with current smoking. For duration, two metabolism SNPs (GSTP1 and NAT1) and two DNA repair SNPs (OGG1 and XRCC1 194) had mmORzs for <10yrs. Only one SNP was associ-ated with the longest duration of smoking (MGMT 84). Eleven SNPs were associated with either low or high PY, including five that were not associated with any other measure of smoking.
When the CBCS ORzs were stratified by race, there was little evidence of heterogeneity. Using p-values to evaluate effect measure modification by race, approximately 6% of the likelihood ratio tests for a race-smoking inter-action term were significant at α=0.05, about what would be expected by chance. There was no pattern of significant interaction by race for any given smoking measure. Only NQO1 was significant for interaction for more than one smoking measure; ORz differed significantly for all smoking measures and was inverse for African Americans and positive for non-African Americans.
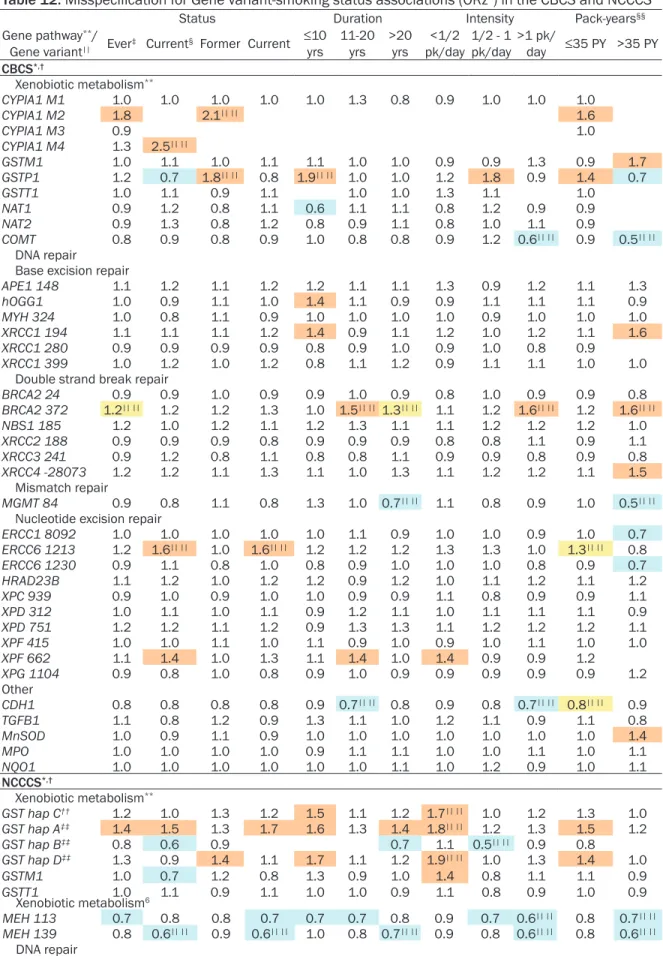
Misspecification of smoking exposure strongly affected the frequency of bias in the COR (Table 12). SNPs with mmORzs for smoking amount rarely showed equivalent mmORzs for smoking status.
NCCCS
In the NCCCS controls, five SNPs in four genes (MEH 113, MEH 139, GSTM1, POLD1 119, MSH3 940) and three haplotypes of GST, were moderately associated with smoking behavior (Tables 7-11). MEH 113 and MEH 139 were both inversely associated with smoking for at least one smoking status category and one smoking amount category. The bulk of moder-ate ORzs in the metabolic genes can be attrib-uted to the two SNPs in the MEH gene. POLD1 119, a DNA repair gene, was most consistently associated with smoking across categories. As in the CBCS, metabolism genes were overrep-resented in the stronger associations and DNA repair genes in the weaker associations. Associations between metabolism SNPs and smoking were consistently inverse.
Within smoking categories, three of the four metabolism gene SNPs (GSTM1, MEH 113 &
139) were inversely associated with smoking status; three DNA repair SNPs showed inverse mmORzs for smoking status (POLD 119, MSH3 940 and MSH6 39). All measures of amount showed clustering of positive associations in MMR and NER DNA repair genes, and inverse associations for metabolic genes and BER DNA repair genes. Six SNPs were associated with high PY (MEH 113, MEH 139, POLD 119, MSH3 1036, XPC 499 and XPC 939), two of which had no association with any other smoking mea-sure (MSH3 1036, XPC 499).
When stratified by gender, only MSH3 940 dif-fered significantly across more than one smok-ing measure. ORzs for ever smoking, duration and PY were higher among women than men when positive or closer to the null when inverse. MSH3 1036 showed the same pattern however the LRT for gender was not significant for any measure of smoking.
No strong patterns emerged with stratification by race, although estimates were often on opposite sides and close to the null. The excep-tion was GSTT1 where stratificaexcep-tion by race pro-duced moderate inverse associations in whites and moderate positive associations in African Americans for most evaluable smoking mea-sures (ever, current, and intensity). Approximately 3% of the likelihood ratio tests for a race-smoking interaction term were statis-tically significant.
As in the CBCS, exposure misspecification fre-quently produced bias. For smoking amount, there were 20 SNPs or haplotypes with moder-ate magnitude associations; only 6 showed a similar result for smoking status.
CBCS and NCCCS
Status Duration Intensity Pack-years§§ Gene pathway**/
Gene variant|| Ever‡ Current§ Former Current ≤10 yrs 11-20
yrs >20 yrs pk/day<1/2 1/2 - 1 pk/day >1 pk/day ≤35 PY >35 PY
CBCS*,†
Xenobiotic metabolism**
CYPIA1 M1 1.0 1.0 1.0 1.0 1.0 1.3 0.8 0.9 1.0 1.0 1.0
CYPIA1 M2 1.8 - 2.1|| || 1.6
CYPIA1 M3 0.9 1.0
CYPIA1 M4 1.3 2.5|| ||
-GSTM1 1.0 1.1 1.0 1.1 1.1 1.0 1.0 0.9 0.9 1.3 0.9 1.7
GSTP1 1.2 0.7 1.8|| || 0.8 1.9|| || 1.0 1.0 1.2 1.8 0.9 1.4 0.7
GSTT1 1.0 1.1 0.9 1.1 99.0 1.0 1.0 1.3 1.1 -999.0 1.0
NAT1 0.9 1.2 0.8 1.1 0.6 1.1 1.1 0.8 1.2 0.9 0.9
NAT2 0.9 1.3 0.8 1.2 0.8 0.9 1.1 0.8 1.0 1.1 0.9
COMT 0.8 0.9 0.8 0.9 1.0 0.8 0.8 0.9 1.2 0.6|| || 0.9 0.5|| || DNA repair
Base excision repair
APE1 148 1.1 1.2 1.1 1.2 1.2 1.1 1.1 1.3 0.9 1.2 1.1 1.3
hOGG1 1.0 0.9 1.1 1.0 1.4 1.1 0.9 0.9 1.1 1.1 1.1 0.9
MYH 324 1.0 0.8 1.1 0.9 1.0 1.0 1.0 1.0 0.9 1.0 1.0 1.0
XRCC1 194 1.1 1.1 1.1 1.2 1.4 0.9 1.1 1.2 1.0 1.2 1.1 1.6
XRCC1 280 0.9 0.9 0.9 0.9 0.8 0.9 1.0 0.9 1.0 0.8 0.9 -99.0
XRCC1 399 1.0 1.2 1.0 1.2 0.8 1.1 1.2 0.9 1.1 1.1 1.0 1.0
Double strand break repair
BRCA2 24 0.9 0.9 1.0 0.9 0.9 1.0 0.9 0.8 1.0 0.9 0.9 0.8
BRCA2 372 1.2|| || 1.2 1.2 1.3 1.0 1.5|| || 1.3|| || 1.1 1.2 1.6|| || 1.2 1.6|| ||
NBS1 185 1.2 1.0 1.2 1.1 1.2 1.3 1.1 1.1 1.2 1.2 1.2 1.0
XRCC2 188 0.9 0.9 0.9 0.8 0.9 0.9 0.9 0.8 0.8 1.1 0.9 1.1
XRCC3 241 0.9 1.2 0.8 1.1 0.8 0.8 1.1 0.9 0.9 0.8 0.9 0.8
XRCC4 -28073 1.2 1.2 1.1 1.3 1.1 1.0 1.3 1.1 1.2 1.2 1.1 1.5
Mismatch repair
MGMT 84 0.9 0.8 1.1 0.8 1.3 1.0 0.7|| || 1.1 0.8 0.9 1.0 0.5|| || Nucleotide excision repair
ERCC1 8092 1.0 1.0 1.0 1.0 1.0 1.1 0.9 1.0 1.0 0.9 1.0 0.7
ERCC6 1213 1.2 1.6|| || 1.0 1.6|| || 1.2 1.2 1.2 1.3 1.3 1.0 1.3|| || 0.8
ERCC6 1230 0.9 1.1 0.8 1.0 0.8 0.9 1.0 1.0 1.0 0.8 0.9 0.7
HRAD23B 1.1 1.2 1.0 1.2 1.2 0.9 1.2 1.0 1.1 1.2 1.1 1.2
XPC 939 0.9 1.0 0.9 1.0 1.0 0.9 0.9 1.1 0.8 0.9 0.9 1.1
XPD 312 1.0 1.1 1.0 1.1 0.9 1.2 1.1 1.0 1.1 1.1 1.1 0.9
XPD 751 1.2 1.2 1.1 1.2 0.9 1.3 1.3 1.1 1.2 1.2 1.2 1.1
XPF 415 1.0 1.0 1.1 1.0 1.1 0.9 1.0 0.9 1.0 1.1 1.0 1.0
XPF 662 1.1 1.4 1.0 1.3 1.1 1.4 1.0 1.4 0.9 0.9 1.2
XPG 1104 0.9 0.8 1.0 0.8 0.9 1.0 0.9 0.9 0.9 0.9 0.9 1.2
Other
CDH1 0.8 0.8 0.8 0.8 0.9 0.7|| || 0.8 0.9 0.8 0.7|| || 0.8|| || 0.9
TGFB1 1.1 0.8 1.2 0.9 1.3 1.1 1.0 1.2 1.1 0.9 1.1 0.8
MnSOD 1.0 0.9 1.1 0.9 1.0 1.0 1.0 1.0 1.0 1.0 1.0 1.4
MPO 1.0 1.0 1.0 1.0 0.9 1.1 1.1 1.0 1.0 1.1 1.0 1.1
NQO1 1.0 1.0 1.0 1.0 1.0 1.0 1.1 1.0 1.2 0.9 1.0 1.1
NCCCS*,†
Xenobiotic metabolism**
GST hap C†† 1.2 1.0 1.3 1.2 1.5 1.1 1.2 1.7|| || 1.0 1.2 1.3 1.0 GST hap A‡‡ 1.4 1.5 1.3 1.7 1.6 1.3 1.4 1.8|| || 1.2 1.3 1.5 1.2
GST hap B‡‡ 0.8 0.6 0.9 0.7 1.1 0.5|| || 0.9 0.8
GST hap D‡‡ 1.3 0.9 1.4 1.1 1.7 1.1 1.2 1.9|| || 1.0 1.3 1.4 1.0
GSTM1 1.0 0.7 1.2 0.8 1.3 0.9 1.0 1.4 0.8 1.1 1.1 0.9
GSTT1 1.0 1.1 0.9 1.1 1.0 1.0 0.9 1.1 0.8 0.9 1.0 0.9
Xenobiotic metabolism6
MEH 113 0.7 0.8 0.8 0.7 0.7 0.7 0.8 0.9 0.7 0.6|| || 0.8 0.7|| || MEH 139 0.8 0.6|| || 0.9 0.6|| || 1.0 0.8 0.7|| || 0.9 0.8 0.6|| || 0.8 0.6|| || DNA repair