Sweep-N-Go 3.0
By
Maria Pieroni
Senior Project
ELECTRICAL ENGINEERING DEPARTMENT
California Polytechnic State University
San Luis Obispo
i
TABLE OF CONTENTS
Section Page
Table of Contents ... i
Lists of Tables and Figures ... ii
Abstract ... iv
I. Introduction ...1
II. Requirements and Specifications ...2
III. Functional Decomposition ...7
IV. Project Planning ...11
V. Design ...13
VI. User Experience Implementation ...16
VII. Instrument Connectivity Implementation ...30
VIII. Testing...37
IX. Conclusions ...44
References ...47
ii LISTS OF TABLES AND FIGURES
Table Page
Table 1: Sweep-N-Go 3.0 Requirements and Specifications ... 3
Table 2: Sweep-N-Go 3.0 Deliverables ... 5
Table 3: Level 0 Block Diagram Function Table ... 7
Table 4: Level 1 Block Diagram Function Table ... 9
Table 5: Cost Estimates ... 12
Figures Figure 1: Level 0 Block Diagram ... 7
Figure 2: Level 1 Block Diagram ... 9
Figure 3: Gannt Chart ... 11
Figure 4: Bench Connections ... 13
Figure 5: Example LabVIEW Code ... 14
Figure 6: Sweep-N-Go 2.0 Design Structure ... 14
Figure 7: Sweep-N-Go 3.0 Design Structure ... 15
Figure 8: Sweep-N-Go 2.0 Step 1 UI... 16
Figure 9: Sweep-N-Go 2.0 Step 2 UI... 17
Figure 10: Sweep-N-Go 3.0 Step 1 UI... 17
Figure 11: Sweep-N-Go 3.0 Step 2 UI... 18
Figure 12: Sweep-N-Go 2.0 Step 3 UI... 19
Figure 13: Sweep-N-Go 2.0 Step 4 UI... 20
Figure 14: Sweep-N-Go 3.0 Step 3 UI... 20
Figure 15: Sweep-N-Go 3.0 "Instruments Connected" Tab ... 21
Figure 16: Sweep-N-Go 3.0 "Debug Panel" Tab ... 21
Figure 17: GUI DIfference 2.0 vs 3.0 ... 22
Figure 18: Increment Sweep Logic "Calculate_Voltage.vi" ... 23
Figure 19: Update X and Y axis Menus... 24
Figure 20: INIT_DROP_MENU.vi ... 25
Figure 21: Empty Drop Menu Check... 25
Figure 22: Create Timestamp File Name ... 27
Figure 23: Append Data to File ... 27
Figure 24: Sweep-N-Go 2.0 Write to File ... 28
Figure 25: Get_Data_From_File.vi ... 28
Figure 26: LabVIEW Code Queries Instrument Addresses ... 30
Figure 27: FIND_VISA_ADDRESS.VI ... 30
Figure 28: WRITE_GPIB VI ... 31
Figure 29: IDN_QUERY ... 31
Figure 30:Bench 9 User Interface ... 32
Figure 31: Rigol Multimeter Identification... 33
iii
Figure 33:CHECK_OPEN_ERROR.vi... 34
Figure 34: Instrument Connectivity Error Message... 35
Figure 35: HIDE_UNCONNECTED.vi ... 35
Figure 36: grey_out.vi ... 36
Figure 37:Update Agilent VISA Address ... 36
Figure 38: Diode Connected Circuit ... 37
Figure 39: JFET Connected Circuit ... 37
Figure 40: Diode Data Saved CSV File ... 38
Figure 41: Diode Characteristics ... 39
Figure 42: JFET Characteristics... 40
Figure 43:NI MAX Debugging Interface ... 41
Figure 44: VISA Test Panel Agilent Power Supply ... 42
Figure 45: VISA Test Panel Fluke Multimeter ... 42
iv ABSTRACT
This project improves the current performance of the Sweep-N-Go LabVIEW program used in Cal Poly electrical engineering laboratories. Sweep-N-Go expedites the laboratory data
1 CHAPTER 1 Introduction:
The custom-designed LabVIEW software program known as “Sweep-N-Go” (Version 2.0), previously installed on electrical engineering laboratory computers at Cal Poly, simplifies and expedites the data collection process utilized in electrical engineering laboratories [13]. The software program implements automated testing protocols and tools, thereby increasing the efficiency and accuracy of the data collection process. Generally, automated testing tools perform repetitive tasks that people would otherwise complete manually. While slower and less accurate, manual testing can provide certain benefits by allowing students time manipulating the data. This can help students draw insights that they might miss otherwise if they used automated data collection [11]. This concern should not negatively impact the use of Sweep-N-Go,
however, since Cal Poly students have several lab courses throughout their four-year EE curriculum providing them with multiple opportunities to gain experience manually inputting data and gaining this experience. Additionally, the lab experiments requiring the use of Sweep-N-Go often do so, because the assignments require the collection of large amounts of data over long periods of time to limit the changes in the circuit due to external factors (heat, magnetic waves, noise from jumper cables, etc.). Manual entry of large data sets can take too much time to implement and compromise data integrity.
Student exposure to Sweep-N-Go not only enhances the data collection process, but it also introduces the student to an important product market. Exposure to automated testing makes student education more representative of the current industry. According to a PR Newswire article, the automated test industry will be worth $28.8 billion dollars in 2024 [12]. Sweep-N-Go aims to provide students with an understanding of new circuit concepts in laboratoriesvia
automated testing. For this reason, Sweep-N-Go requires students to select the instruments and input the values over which to sweep. In this setup, students do not merely press a button after making relevant circuit connections that says, “take data for EE 346 lab 3”. Students experience the capabilities of the lab equipment and the speed at which instruments collect data from the creation of a standardized test.
The current version of the Sweep-N-Go program communicates with the following laboratory instruments: an oscilloscope, power supply, source meter, multimeter, and a
waveform generator. The user inputs the parameters from which she wants to collect data (such as changing the input voltage from 0 to 10 volts in 0.5 V steps). The program automatically controls the instruments, stores the data in a file and displays the data in a graphical format [1]. For labs requiring significant data collection and analysis, this program can greatly reduce the time needed for students to compete the lab.
2
3 CHAPTER 2 Customer Needs Assessment
Sweep-N-Go 3.0 users (customers) include Cal Poly electrical/computer engineering students and faculty. To explore customer needs, I asked electrical engineering students what frustrates them about the current version of Sweep-N-Go. They reported frustration with
debugging issues related to equipment or code errors that cause the system to fail. Furthermore, the customers identified a need for an improved, more intuitive user interface. Students also reported a desire for the program to sweep through the data more quickly and for the program to save data more easily in a table/Excel document for streamlined interpretation. Faculty also expressed a need for a more consistent working version of Sweep-N-Go. They identified a need to debug the system as it relates to GPIB addresses (communication with lab equipment) and expressed similar frustrations as students regarding the lack of a user-friendly interface and user guidance. Faculty members experience stress since students look to their professors for solutions and repeatedly ask faculty for assistance fixing the same Sweep-N-Go problems in every lab section.
Circumstantial Customer Needs Assessment
An additional customer needs due to the coronavirus pandemic includes remote lab access and data collection. Sweep-N-Go facilitates this need even though that was not the original purpose of improving it. After a lab instructor builds and connects a circuit, students could run Sweep-N-Go and collect data points to analyze and gain understanding of the circuit. Sweep-N-Go could also serve to take just one data measurement even though it facilitates a larger data collection set. This could allow students to still interact with the laboratory equipment remotely and have the Cal Poly “learn by doing” experience during the pandemic.
Requirements and Specifications
The customer needs specified above determine the following marketing requirements in Table 1. Several instruments on the bench determine the speed and limitations of the program [6-10]. The program uses the Agilent Oscilloscope exclusively as a voltmeter for Sweep-N-Go functionalities. Furthermore, each laboratory computer does not consistently map the same GPIB addresses for each instrument causing additional hurdles. Since efficiency vitally impacts the marketability of the project, it follows the program must run without causing further debugging frustrations. The engineering specifications follow in Table I from the abstract with additional details.
Table 1: Sweep-N-Go 3.0 Requirements and Specifications
Marketing Requirements
Engineering
Specifications Justification
7 Program sets all voltage and current outputs to 0 after a sweep concludes.
4
output voltage and current to 0 after sweep completes.
7 Program sets all voltage and current outputs to 0, when a sweep gets interrupted.
In case of a malfunction or error, the code stops powering the circuit. This avoids unnecessary potential danger.
5 Sweep-N-Go 3.0 interfaces with at least the following instruments using the indicated GPIB addresses [13]:
Instrument GPIB Address Fluke 8840A DMM 1 Agilent E3640A DC Power Supply 5 Agilent 54622A Oscilloscope 7 Agilent 33120A Function Generator 10 Agilent 34401A DMM 22 Keithley 2400 SourceMeter 24
Laboratory computers generally configure these intruements with these specific GPIB addresses for the program to work. If any of addresses change, the program fails to communicate with the instruments on the bench causing the program to malfunction.
1, 2 EE/CPE students can complete setup of software in under 10 minutes.
Several students say that they spend entire lab periods trying to get Sweep-N-Go to work. This specification implies students could figure out the usage of the program significantly faster. 2, 5 Allow for communication with new lab
equipment (Rigol DP832 DC Power Supply and Keysight MSO-X 2022A InfiniVision Scope) [14], [6] using USB.
Since the EE department purchased new equipment for select lab benches, Sweep-N-Go must account for these new instruments. This requirement ensures all students have access to a working program.
3 No components need to be purchased for project completion.
Any project considers costs and affordability important factors because this determines the success of selling the product to customers. Because Cal Poly already pays for LabVIEW, this project does not cost anything to make and is free for student use. Labor constitutes the only cost of the project.
1, 2 Collected data from the sweep outputs as a CSV (comma separated values) file with only relevant data.
5 1, 2 The information needed to use the
program (User Guide) is documented and available online.
Since most students do not have familiarity with LabVIEW, the documentation of the process to open and run the program helps students efficiently set up the program and collect data without frustration.
1, 6, 9 Failure rate of the program (need for the program to be restarted) less than 5%.
Since the solution to several bugs in the current software requires restarting the program, the new version aims to ensure fewer bugs and a higher performance rate. 9 All instruments powered before starting
the program.
Since two-thirds of the instruments on a high-speed GPIB daisy chain connection must be powered, students must power all instruments on the bench to assure this does not interfere with the program’s performance.
6, 4 Increase programming comments currently in code by 50%.
To further help future students and professors make changes to the program, the code contains well-documented and
understandable comments. Marketing Requirements
1. User Friendly 2. Efficient
3. Free for student use 4. Sustainable
5. Implementable in all lab setups 6. Long-lasting
7. Promotes Lab Safety 8. Fosters Student Learning 9. Reliable
6 Delivery
Date Deliverable Description
1/21/2020 Design Review 2/25/2020 EE 461 Demo 3/13/2020 EE 461 Report 5/12/2020 EE 462 Demo
5/25/2020 ABET Sr. Project Analysis 6/05/2020 Sr. Project Expo Poster 6/12/2020 EE 462 Report
[1] R. Ford and C. Coulston, Design for Electrical and Computer Engineers, McGraw-Hill, 2007, p. 37
[2] IEEE Std 1233, 1998 Edition, p. 4 (10/36), DOI: 10.1109/IEEESTD.1998.88826
7 CHAPTER 3 Level 0 Block Diagram
The following level 0 block diagram in Figure 1 demonstrates the overall functionality of the system. Table 3 describes the functionality of Sweep-N-Go, which has two inputs and one output. The user sets data points which constitute the inputs to the program. The user enters values they wish to sweep as an input to the relevant circuit. A specified instrument on the bench reads the data from the circuit and sends that data to the program which it stores in an Excel, Comma Separated Value, document. These data points update to a graph with clearly labeled axis after the sweep completes.
Figure 1: Level 0 Block Diagram
TABLE 3
LEVEL 0BLOCK DIAGRAM FUNCTION TABLE
Table 3: Level 0 Block Diagram Function Table
Module Sweep-N-Go 3.0
Inputs -User-Entered Parameters
First, the user chooses instruments from which to collect data.
Then the user chooses what instrument (Agilent Supply, SourceMeter, Function Generator, and RIGOL power supply) they want to sweep and specify start, stop, and step values. Finally, the user enters further device options offered.
-Instruments on bench Oscilloscope
8
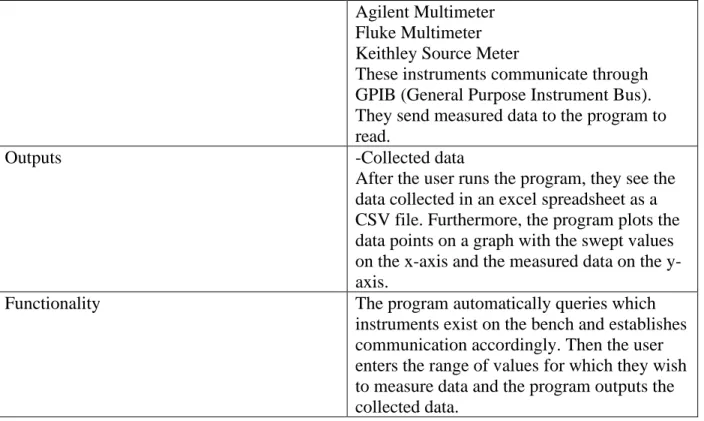
Agilent Multimeter Fluke Multimeter Keithley Source Meter
These instruments communicate through GPIB (General Purpose Instrument Bus). They send measured data to the program to read.
Outputs -Collected data
After the user runs the program, they see the data collected in an excel spreadsheet as a CSV file. Furthermore, the program plots the data points on a graph with the swept values on the x-axis and the measured data on the y-axis.
Functionality The program automatically queries which
instruments exist on the bench and establishes communication accordingly. Then the user enters the range of values for which they wish to measure data and the program outputs the collected data.
This basic outline shows the overall functionality, but going one level deeper helps to better explain how the program completes the functionality previously specified.
Level 1 Block Diagram
Figure 2 shows the level one block diagram of Sweep-N-Go 3.0. Since LabVIEW interfaces the hardware, this diagram demonstrates the interaction of the software and the
9
Figure 2: Level 1 Block Diagram
Table 4: Level 1 Block Diagram Function Table
Module Startup Sequence
Inputs After the user powers all bench instruments,
they choose instruments from which to collect data.
The user also selects which instrument (Agilent Supply, SourceMeter, Function Generator, and RIGOL power supply) he wants to sweep and specify start, stop, and step values. Finally, the user selects further device options offered.
Outputs Instructions for instrument setup and
communication.
Functionality Establishes communication protocols with the
instruments on the bench via GPIC and USB. Sets initial values of the outputs on the relevant instruments based upon user inputs.
Module Instruments
Inputs -Instructions for instrument setup and
10
-Instructions from the iterative part of the code setting a new value on an instrument output.
Outputs Data read from the selected instrument.
Usually a voltage or current value.
Functionality The instruments read instructions from code
and sets appropriate outputs. They then report the measured data to the software to be saved.
Module Store and Sweep
Inputs This module of code reads the measured data
from the specified instrument.
Outputs Sends instructions to the appropriate
instrument to change the output value of the instrument. Keeps sending these values iteratively until the program collects all data. Once the sweep completes, the program saves data and outputs is as both a graph and in an Excel spreadsheet.
Functionality The block of code reads measured data, saves
it, then instructs the relevant instrument to change its output value by a variable value. The block of code does this iterative process until the program collects all data and outputs the results to the user.
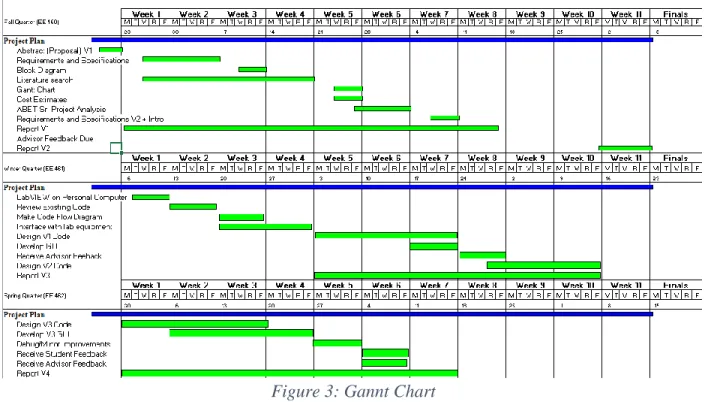
11 CHAPTER 4 Gantt Chart
Figure 3 represents the estimated timeline and project plan for making improvements to the current Sweep-N-Go (Version 2.0). Fall quarter entails preparing the project report and refining requirements and specifications. Winter quarter starts by familiarizing myself with the current version of Sweep-N-Go and recognizing common bugs. I anticipate this to only take a week to complete, and then plans to create a programmatic flow diagram. By week 4, I plan to have interfaced with all the relevant lab equipment and have developed a plan for software changes. By the end of Winter quarter, I complete version one of the software and acquire student and faculty feedback. At the start of Spring quarter, I begin on version two of the software to accommodate for the feedback received Winter quarter. I plan to complete the final second version by week six of Spring quarter.
Figure 3: Gannt Chart
Cost Estimate
12
estimate of the time required to finish this project will take to complete yields approximately 200 hours. The optimistic view of the time spent on the project yields 120 hours. Realistically, I anticipate spending somewhere around 150 hours on the project. Using the PERT analysis, the estimated overall time the project takes to complete is 𝑡𝑖𝑚𝑒 = 180+120+4(150)
6 =
153 . Conceptually, I would charge $75/hour as a competitive salary for an engineer. Table 5: Cost Estimates
Item Cost
Labor 153 hours*$75/hour = $11,475
Lab Kit $8
Total $11,483
13 CHAPTER 5 Programing Language
The original developer of Sweep-N-Go, Arthur Young, chose to write the program in LabVIEW. People commonly use LabVIEW for data acquisition and instrument control, since there exist several built-in functions which communicate with connected instruments. This makes LabVIEW a perfect fit for Sweep-N-Go functionalities. The program communicates with the standard IEEE-488 communication protocols for GPIB (General Purpose Interface Bus). GPIB protocols mandate that two thirds of all instruments on the bus must be powered on to ensure communication. Therefore, Sweep-N-Go asks students to power all instruments on the bench to ensure proper communication. LabVIEW also communicates through USB connections which correlates to the Rigol Power Supply on most Electrical Engineering lab benches and other new laboratory equipment such as Rigol Multimeters. Through these communication capabilities, a LabVIEW program can write commands to instruments and read the values they report to save them in a file. Figure 4 shows the communication lines through which Sweep-N-Go operates.
Figure 4: Bench Connections
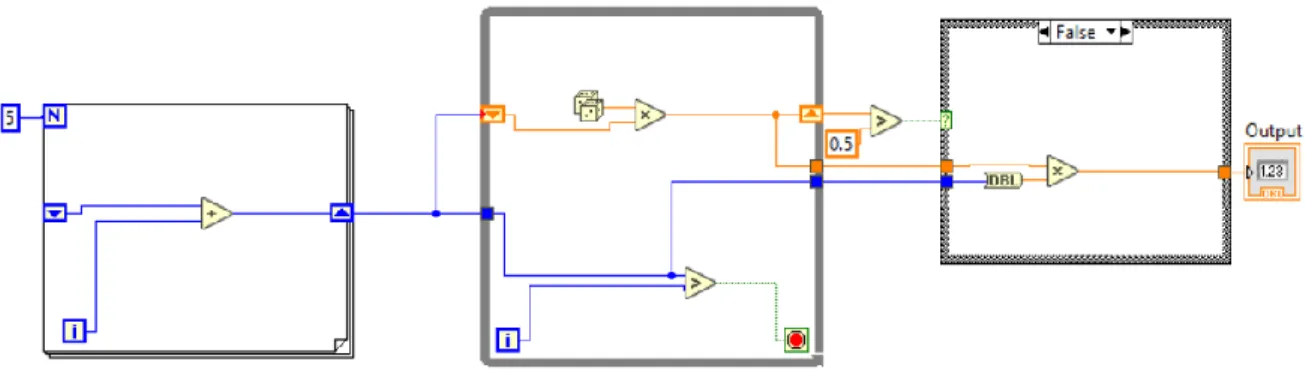
LabVIEW uses a visual programming language in which they call functions “virtual
14
Figure 5: Example LabVIEW Code
The logic moves from left to right and outputs a number in the indicator. LabVIEW represents VIs as small boxes that have different icons with input and output connections. Once the developer obtained a basic understanding of the software, she works to understand the overall design of Sweep-N-Go 2.0 and make improvements.
Design
Arthur Young’s design of Sweep-N-Go in 2003 implements a basic structure of waiting in a while loop until the user presses the “SWEEP” button to start. The program then moves into a FOR loop iterating a calculated number based on the user-input sweep parameters. In each iteration, a VI sets output voltages/currents and then reads the data to be saved to a file. Another VI in the FOR loop reports that data to a graph updated every iteration. Figure 6 shows the basic LabVIEW design structure of Arthur’s code.
Figure 6: Sweep-N-Go 2.0 Design Structure
15
In the design for Sweep-N-Go 3.0, there exists a preliminary VI before the WHILE loop to initialize and query the instrument connection addresses. The program disables all user-interface interactions until this process completes. Once in the WHILE loop, the program has an event structure which acts as an interrupt system for different user interactions. Depending on what the user clicks, the program makes different options available to limit user error. The event structure checks for fourteen different user-defined actions including an “EXIT” option which stops the program entirely. When the user presses the “SWEEP” button, the event structure initializes instrument settings and enqueues the sweep data to run in a parallel WHILE loop. This parallel structure allows the user to enqueue several sweeps and still interact with the UI. Figure 7 shows the LabVIEW design structure of Sweep-N-Go 3.0.
Figure 7: Sweep-N-Go 3.0 Design Structure
16 CHAPTER 6
User Interface
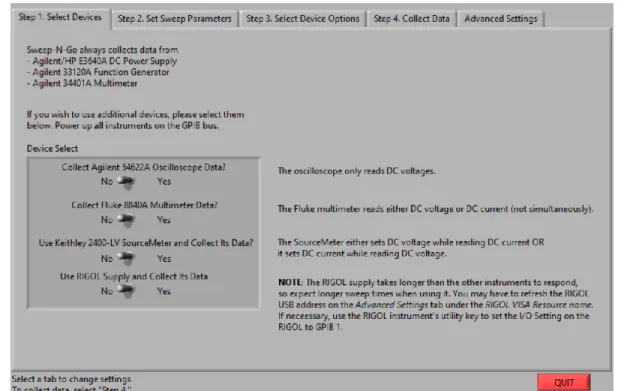
Sweep-N-Go 2.0 requires the user to take four steps to run the program. The user goes through these steps by clicking on consecutive tabs. The first tab in Sweep-N-Go 2.0, shown in Figure 8, requires the user to indicate which instruments they intend to use during the sweep. However, three instruments (the Agilent Power Supply, Agilent Multimeter, and the Function Generator) always run in Sweep-N-Go 2.0. In the updated version, no instruments automatically run during the sweep to decrease user confusion and increase efficiency during the sweep.
Figure 8: Sweep-N-Go 2.0 Step 1 UI
17
Figure 9: Sweep-N-Go 2.0 Step 2 UI
Sweep-N-Go 3.0 removes this first step and instead has buttons indicating instrument usage next to the places the user sets sweep parameters as seen in Figure 10.
18
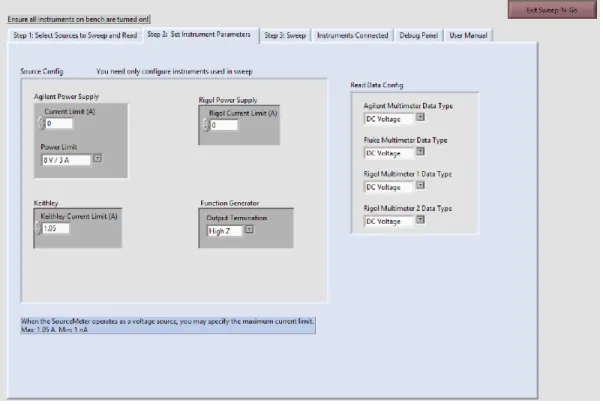
Figure 11: Sweep-N-Go 3.0 Step 2 UI
Furthermore, Sweep-N-Go 3.0 includes a separate box adjacent to the “sweep
parameters” for the user to indicate which read-only instruments they use in their data collection. The same configuration and placement of instruments correlates to the next tab in “Step 2. Set Instrument Parameters” shown in Figure 11. This helps the user navigate to relevant settings they wish to adjust, since parameters only apply to used instruments. Figure 12 shows Sweep-N-Go 2.0’s tab for device options which contains a list that does not separate which options correlate to each instrument. This list not only requires more reading but could potentially cause the user to miss an important configuration, since the interface sandwiches different instrument
19
Figure 12: Sweep-N-Go 2.0 Step 3 UI
20
Figure 13: Sweep-N-Go 2.0 Step 4 UI
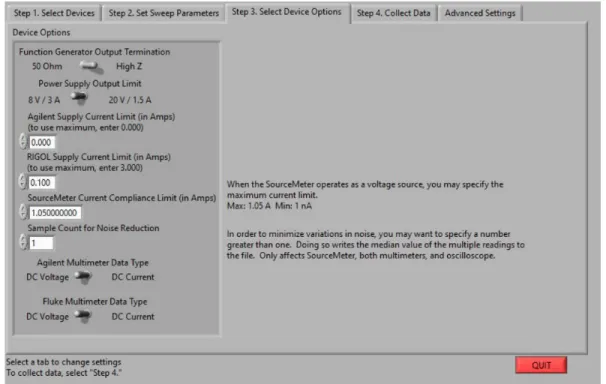
Figure 14: Sweep-N-Go 3.0 Step 3 UI
21
Figure 15: Sweep-N-Go 3.0 "Instruments Connected" Tab
Figure 16 shows the debug panel which the user can manually change the instrument addresses to fix connectivity problems. Furthermore, the user can see the numeric real-time data values to understand why potential discrepancies may appear during the sweep.
22
Finally, Sweep-N-Go 3.0 features a “User Manual” tab, which serves to help users understand the program within the program. This way, students can easily find instructions instead of clicking on a website or referencing their lab manuals.
Additionally, the developer made some aesthetic choices to improve Sweep-N-Go. Firstly, instead of using the toggle switches, the developer replaced them all with drop-down menus. The developer also changed the color from bright green to periwinkle for improved visual interpretation. Figure 17 shows the overall changes made to the user interface with Sweep-N-Go 2.0 on the left and Sweep-Sweep-N-Go 3.0 on the right.
23
The developer made several additional changes to improve the user experience of Sweep-N-Go. User Inputs
To reduce errors when inputting instrument instructions, Sweep-N-Go 2.0 and 3.0 both coerce user-input values. They both ensure that the user cannot enter negative voltages when entering sweep parameters. Furthermore, the programs set a maximum voltage range coercion according to instrument limitations.
However, Sweep-N-Go 2.0 also coerces the “step” inputs, so the user cannot input anything less than 0. This requirement does not prevent the user from sweeping a higher value to a lower one, but they must input a positive step increment. In Sweep-N-Go 3.0, the user may enter positive values to indicate a positive sweep and negative step values to indicate a
backwards sweep. This makes more logical sense to users, and, if the user mistakenly entered the wrong-signed step value, Sweep-N-Go 3.0 automatically corrects this to continue the sweep.
Figure 18 shows the logic which fixes potential user errors regarding step values. The program subtracts the stop voltage from the start voltage to see if the user wants intends a
positive or negative sweep. Then, the program multiplies this value and the step value. If the user intends a negative sweep and inputs a negative step size value, the program outputs a positive value. Same with a positive sweep and a positive step size. However, if the value is negative, then the program changes the step value sign by multiplying it and -1. Then, the program outputs the correctly incremented voltage. Therefore, the user cannot enter a value that causes the sweep to increment outside the start and stop values.
Figure 18: Increment Sweep Logic "Calculate_Voltage.vi"
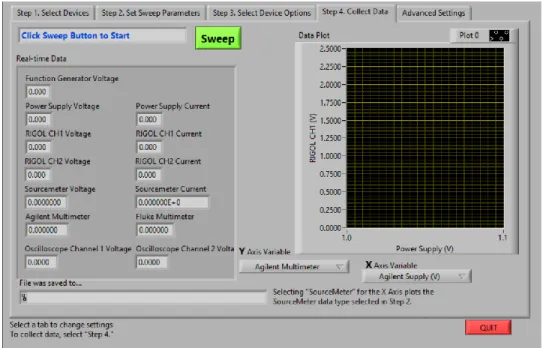
Once the user sets all parameters they need to sweep, then they move to “Step 3: Sweep” to collect data and see it update the graph. The user must only specify the axis data and press the “Sweep” button.
Data Options
24
specifications. The event structure waits to see if the user clicks a Boolean button indicating instrument use and then runs the INIT_DROP_MENU VI as seen in Figure 19.
Figure 19: Update X and Y axis Menus
This VI checks each Boolean indicating whether the user intends to implement an instrument in the sweep and adds a string representing data accordingly. The VI takes inputs “Read Data Config”, “Read Data From”, and “Sweep Parameters”. “Read Data Config” reports whether the user intends to read DC Voltage or DC Current from the multimeters or
25
Figure 20: INIT_DROP_MENU.vi
This feature reduces user error when selecting data to plot on each axis. Furthermore, the drop-down menus do not contain so many options that the user might overlook the required data. Additionally, this reminds the user to select the Boolean indicators according to which
instruments they intend to implement in the sweep since the drop-down menus remain empty until the user specifies this information.
However, during testing, the developer realized the drop-down menus keep the default values previously selected if the user de-selects all used instruments. Therefore, when the event structure times out (when the user does not interact with the other cases for .1 milliseconds) the drop-down menu checks to ensure that there exists at least one instrument selected. If the string array is empty, the program re-writes the drop-down menus to hold no values as seen in Figure 21.
26
This way the user cannot sweep using default values in the drop-down menus. This addition to Sweep-N-Go creates an easily navigated user interface and reduces potential user error.
Furthermore, if the user does not select data to read from the drop-down menus of the x and y axis the program stops the sweep if either the x or y axis drop down menus remain empty. The user receives the message “Please select data to display on the x and y axis then hit the "Sweep" button. If options are not available, check to ensure that you have selected the devices you are using for the sweep. Also consider restarting the computer to reset instrument
communications.”
The user must then make the appropriate changes to start the sweep. Once the user has appropriately selected the data to read and set other parameters accordingly, they press the “Sweep” button to start the data collection.
User Experience During Sweep
Depending on what parameters the user set, the sweep could potentially take several seconds and potentially a couple minutes. To indicate this time commitment, Sweep-N-Go 3.0 provides a progress bar to inform the user approximately how much remaining time exists. Since the program calculates the number of iterations for a sweep, it updates the progress bar
accordingly. The program divides the current iteration count by the total iterations and multiplies by 100 to output the percentage complete. The progress bar updates every iteration of the FOR loop and appears directly above the “SWEEP” button in the user interface.
Furthermore, instead of prompting the user with a dialog box to inform them the sweep completed, Sweep-N-Go 3.0 instead shows a Boolean indicator labeled “Sweep Complete” which lights up green when complete. The program resets this indicator at the beginning of every sweep and when the program first runs. This feature informs the user without using an annoying pop-up.
Additionally, the “Quit Sweep” button stops the sweep while allowing the program to continue running. When the user presses this button, the progress bar informs the user the of the data not collected, but the “Sweep Complete” indicator turns green to indicate the stopped sweep. The collected data still saves to a unique file even when the user aborts the sweep early. Saving Data
27
Figure 22: Create Timestamp File Name
Furthermore, the program saves each file to a designated “Sweep-N-Go data” folder so all the files exist in the same place. The program saves the file as a CSV, or comma separated value. This way users can analyze and graph all the data saved in this tabular form.
Like the INIT_DROP_MENU.vi, the program selects the file headers according to instruments used in the sweep. This way, the user only saves relevant data and does not need to parse out columns of useless data. The program initializes the headers before entering the FOR loop in which the program appends the data to the file.
The data appends to the file in the SET_AND_READ.vi in which the program saves all the data in a string array and removes the empty strings to output an array the length of relevant data. Figure 23 shows this process within the SET_AND_READ function.
Figure 23: Append Data to File
28
Figure 24: Sweep-N-Go 2.0 Write to File
Furthermore, once the program saves all relevant data to the file, it can read this file to adjust the data plotted on the graph.
Switching Data on Axis
Users may accidentally choose x and y axis data they do not wish graphed. Sweep-N-Go 3.0 allows users to change the data graphed during or after a sweep. When the user changes the x or y axis value, the upper-WHILE loop event structure triggers and the program updates the graph.
The function “Get_Data_From_File”, seen in Figure 25, has inputs “file path” and “axis string value” and outputs “data array” to replace the current graph data. This function reads the data from the saved file and returns a string array of file headers. For each header, the function checks the desired string axis value. When the desired value equals the string header value, the TRUE case reads the numerical file values corresponding to the column header. After removing the header information, the function outputs the desired data array.
29
The output data then replaces the current x or y axis plotted data. Since the sweep runs parallel to this operation, the graph updates new data during the sweep if either the x or y axis string value changes. This feature helps users to not re-run the sweep if they clicked the wrong value in the drop-down menus. This could potentially save users minutes and reduce the power used to re-run sweeps.
30 CHAPTER 7 Instrument Addresses
Sweep-N-Go 2.0 commonly breaks due to incorrect addressing of the bench instruments, leading to failed communication. Therefore, the developer designed a dynamic query of
instrument addresses to ensure ongoing instrument communication. Figure 26 shows the program’s process of first finding a list of all the USB addresses and then writing them to the correct instrument. The program then completes the same process for GPIB addresses.
Figure 26: LabVIEW Code Queries Instrument Addresses
To find the list of USB or GPIB addresses, the program queries the computer’s localhost. Figure 27 shows the code for the VI named “FIND_VISA_ADDRESS” which has the input “Bus Type” and returns the output “VISA RESOURCE NAMES” which is an array of strings
containing the relevant addresses. The program then inputs this array to the next VI to pair each address to the appropriate instrument. To accomplish this, the program communicates with each address and asks for the instrument’s identification.
Figure 27: FIND_VISA_ADDRESS.VI
31
However, when testing the developer found some lab benches for which there exist several addresses that do not connect to any instrument and make this process very slow. Therefore, there exists a condition that checks if this process takes longer than 5 seconds and aborts the FOR loop of “*IDN?” commands.
Figure 28: WRITE_GPIB VI
Once the loop stops because of the time condition, another VI runs and uses the hard-coded GPIB/USB addresses to check individual instrument connection. Furthermore, in the case that the computer does not find any addresses, there exists a case that checks all instruments still not connected with two default cases. The first case checks GPIB1 and then secondly checks GPIB0 default connections if the instrument is still not connected. Figure 29 shows the process in which the program queries a default address using the *IDN? command if there exists no instrument connectivity. If the query reports identification equal to the expected (hard-coded) instrument identification, the Boolean reports TRUE and the program updates the address. This process serves as a last check before starting user-interaction with the program.
32
Furthermore, since this process can take several seconds, the program updates a progress bar at each step to inform the user how long they must wait, until they can interact with the program. The process should take no longer than 15 seconds due to the timeout conditions set in place. The progress bar updates in quarters since there exist four VIs to complete this process.
This initialization process mostly improves the addressing USB connected devices, since every bench has a unique address. Therefore, benches holding new, USB connected instruments can run Sweep-N-Go as well.
New Laboratory Equipment
Not all benches in the electrical engineering laboratories house the same equipment. Therefore, Sweep-N-Go must accommodate these differences allowing all lab groups to efficiently complete their laboratory experiments. For example, bench 9 in room 148 houses a Rigol Power Supply, two Rigol multimeters, and an oscilloscope. There exist no instruments connected through GPIB on this bench. Hard-coded address values would lead to zero instrument connectivity. Figure 30 shows the user interface in which the program only allows users to work with the instruments on bench 9.
Figure 30:Bench 9 User Interface
33
Figure 31: Rigol Multimeter Identification
To include these multimeters in the sweep, the developer made several VIs to initialize, read, and close the instruments. To do this, the developer referenced SCPI commands to set the multimeter to read voltage or current and when to report the value read [16].
While the initialization process eliminates hard-coding issues, there existed several areas in the Sweep-N-Go 2.0 code where errors could occur. Therefore, the next section covers
information relating to reducing propagating errors. Reducing Errors
34
Figure 32: Sweep-N-Go 2.0 VISA_open.vi
This error causes other functionalities to fail as well causing the whole sweep to crash. To remedy this, there exist no implicit instruments in Sweep-N-Go 3.0. The user specifies each instrument they wish to use in the sweep and the program only opens those instruments. The CHECK_OPEN_ERROR.vi function, as seen in Figure 33, checks if the user specified to use the instrument in the sweep and outputs the error status.
Figure 33:CHECK_OPEN_ERROR.vi
If an error appears, the program then identifies the first problematic instrument and notifies the user which instrument does not have proper connectivity. Furthermore, the program prevents the sweep from continuing and instructs the user on how to check instrument
35
Figure 34: Instrument Connectivity Error Message
If there exist no errors, the program goes to the “TRUE” case and initializes the sweep. However, to prevent the user from selecting an unconnected instrument, the function
HIDE_UNCONNECTED, in Figure 35, checks each instrument connectivity status and greys out and disables buttons thereby not allowing the user to select unconnected instruments. This
prevents errors and reduces user responsibility to examine the “Connected Instruments” tab.
36
Figure 36: grey_out.vi
However, this caused some concern for the case in which the program found no
connectivity with any the bench instruments. Therefore, as a fail-safe, on the “Debug Panel” tab the user can input an instrument address they found through manually querying the instrument or looking on NI MAX. While the average user would probably not execute this feature, it would pose useful for any laboratory assistant who possesses advanced knowledge of Sweep-N-Go. The event structure waits until the user causes a value change corresponding to a specific instrument’s address and checks errors in opening the VISA connection to the input address. If there exists no error, the program sets the new address for the specified instrument and sets the Boolean instrument connection TRUE. Furthermore, if the input address produces an error when opening the VISA connection, the program does not set the new address and sets the Boolean indicator FALSE. To accommodate this change, the above HIDE_UNCONNECTED function updates every loop iteration when the event structure is in the “timeout” case. Figure 37 shows the relevant code for the event in which the user changes the Agilent Power Supply address.
37 CHAPTER 8 Testing
Although the coronavirus pandemic impeded laboratory testing spring quarter, Dr. Braun worked to create a lab bench the developer could access remotely. Dr. Braun powered the room 148, bench 5 instruments for initial testing. Since the developer spent several weeks writing code without lab bench access, the testing process initially required ironing out logic flaws and
realizing new code requirements. After the developer adequately tested the program, Dr. Braun set up two circuits seen in Figure 38 and Figure 39 to see Sweep-N-Go 3.0’s capabilities. Firstly, the developer tested the diode circuit by sweeping the Rigol Channel 1 Power Supply from 0 to 3 V while measuring the voltage across the 982Ω with the Agilent Multimeter.
Figure 38: Diode Connected Circuit
Figure 39: JFET Connected Circuit
To measure and plot the diode characteristics, however, students must find the voltage across and current through the diode. The voltage across the diode equals the Rigol Power
38
Therefore, after the sweep completes, the developer opens the CSV file to interpret the data. Figure 40 shows the file and including Sweep-N-Go data and the interpreted diode voltage and current data. Plotting the current versus voltage, Figure 41 shows the diode characteristics.
39
Figure 41: Diode Characteristics
From this graph, the student can determine the threshold voltage for this diode to be approximately 0.57V. This one graph plots 31 data points and the sweep took 1 minute and 43 seconds to complete. This sweep took longer since the Rigol took five measurements at each increment and averaged the values. This means the sweep took 155 measurements in that time. Therefore, even though the sweep takes a couple minutes to complete, the user collects more accurate data faster than if they took this data manually. Furthermore, the sweep duration depends on how fast the computer runs. This variable causes some lab benches to take longer than others.
Next, the developer tested the JFET circuit in Figure 42 by sweeping the Agilent Power Supply (-VGS) from 0 to 3V and the Keithley from 10 to 0V (VDS) for each VGS. The user sets the Agilent Power Supply to loop position 1 and sets the Keithley loop position to 2. Then, the user sets the x axis to read the Keithley voltage and the y axis to read the Keithley current. Figure X shows the Sweep-N-Go graph displaying the JFET characteristics for four different VGS values. This sweep on the same computer took 1 minute and 23 seconds one week and 2 minutes the next week to read 44 data points. The variable time most likely results from network
bandwidth and or variable computer speed. 0 0.1 0.2 0.3 0.4 0.5 0.6 0.7
0.00E+00 5.00E-04 1.00E-03 1.50E-03 2.00E-03 2.50E-03 3.00E-03
Diod e Cu rre n t (A)
Diode Voltage (V)
40
Figure 42: JFET Characteristics
Students learn about both these circuit components in EE306 and test them in the 336 laboratory. Sweep-N-Go 3.0 helps students efficiently learn about diodes and transistors.
Unfortunately, since the developer fell behind schedule and due to COVID-19, no other students tested Sweep-N-Go 3.0 in the laboratory. However, the developer asked few electrical
engineering peers to attempt to break the program to account for user errors the developer did not consider. Through this process, the developer made appropriate changes. However, the developer not only tested the user-experience, but instrument connectivity as well.
Testing Instrument Connectivity
41
Figure 43:NI MAX Debugging Interface
One can query the devices to ensure connectivity and discover the address correlating to each instrument. Sweep-N-Go queries and discovers every instrument listed in NI MAX. However, NI MAX does not always recognize the connected instruments. Therefore, the developer created default instrument addresses to check each instrument. Furthermore, the list sometimes contains up to 50 addresses even though the electrical engineering benches only connect to at most seven instruments. To remedy potentially querying all these addresses (which would take quite some time), the program quits this process and the checks the default cases instead.
Furthermore, if the user finds all instruments unconnected, the user manual instructs them to go to NI MAX to find the addresses. Then, with the new capabilities, the user cab manually input this address and check its connectivity within the Sweep-N-Go 3.0 program. If NI MAX does not find any connected instruments, an advanced user could check all physical cable connections and restart the computer.
While testing instrument connections, NI MAX does not show which instrument
42
Figure 44: VISA Test Panel Agilent Power Supply
However, the older Fluke multimeter does not comply with current SCPI commands. Figure 45 shows the “identification” returned from querying the Fluke multimeter which does not tell the user any useful information. Sweep-N-Go 3.0 queries the Fluke multimeter by checking for the numeric information returned.
43
44 CHAPTER 9 Unimplemented Features
Although the Sweep-N-Go 3.0 greatly reduces errors and improves the user experience, there still exist areas of improvement. One such improvement would allow users to sweep logarithmically in addition to the current linear sweep. This would greatly expedite data collection in some cases.
Furthermore, student feedback requests improvements to the loop position selection. Sweep-N-Go 2.0 and 3.0 both ensure the user does not pick the same loop position for multiple instruments. The program alerts the user if they make this mistake and does not start the sweep. However, the program does not allow the user to sweep even if the user does not select the instruments that have the same loop position to sweep. An improvement to the program would check the same loop positions only if the user specified the instrument’s use.
Additionally, even though Sweep-N-Go 3.0 worked to create a robust querying system, potential issues may arise on other benches for which the developer did not test the program. The commenting throughout Sweep-N-Go 3.0 alleviates potential future development confusions. Difficulties Encountered
The developer competed Sweep-N-Go 3.0 during the coronavirus pandemic, which caused difficulties in testing. Luckily, Dr. Braun safely accessed the labs and worked to help the developer test remotely. However, while testing remotely, the Fluke multimeter readings did not make sense. The Fluke read values of -19V, -12V, -2V, and 9V randomly even though nothing was connected. After the developer spend hours debugging this issue, she later discovered that issue related to hardware, not software issue. If the developer could test this in-person, the debugging process would not have taken so long.
However, COVID-19 did not solely contribute project difficulties. The developer downloaded LabVIEW version 2019 on their personal computer, but the lab computers run version 2017 of the software. The developer converted the 2019 version to 2017 and back a couple times which caused some lost files along the way. The developer recovered everything eventually, but this file confusion led to burnt time.
Furthermore, as mentioned in the testing chapter, different benches caused different levels of difficulty. When testing pre-COVID, the developer would find empty lab benches during other lab classes to test instrument connectivity. However, the open lab benches were usually the ones no one else wanted to work at for a reason. Several times the developer worked at a bench with an extremely slow computer, which greatly reduced progress. Furthermore, the quest to find empty lab benches sometimes ended promptly, since students already occupies them all.
Planning Results
45
developer worked ahead of schedule, but fell behind around week 7. Although the developer had three revisions of the instrument connection query and verification functions, she completed version one of the code at the end of Winter quarter. Although the developer should have completed two versions of the project Winter quarter, Spring quarter allowed enough time to finish the project. The rest of the changes are minimal compared to the dynamic ability of the program to communicate with instruments on the bench. Furthermore, due to COVID, Spring quarter consisted of only 9 weeks long. Furthermore, social distancing regulations which restricted students from using laboratory equipment caused delays in bench testing. A revised version of the Gannt Chat can be seen in Figure 46.
FIGURE 8
REVISED GANNT CHART AS OF WINTER QUARTER 2020
Figure 46:Revised Gannt Chart
Conclusion
While there still exists room for improvement, Sweep-N-Go 3.0 greatly improves the user experience and programmatic reduces errors. The developer referenced past internship
experience working with LabVIEW to develop robust code. The improvements made upon Sweep-N-Go 2.0 creates a better learning environment for EE students, faculty, and technical support.
46
program successfully developed a dynamic instrument query to reduce instrument connectivity issues. Throughout the coding process, the developer learned about saving data to files, parallel loops, and creating an effective user interface.
Finally, this project would not be possible without Arthur Young’s and Dr. Braun’s previous work to create this program. Their ideas and existing code helped the developer of Sweep-N-Go 3.0 to build upon and improve. The Sweep-N-Go 3.0 code free download is posted on Arthur’s website under the “Downloads” tab for students’ and faculties convenience. The link to the reach this webpage is
https://courseware.ee.calpoly.edu/~dbraun/ayoung/aa-download.html for the reader’s convenience. Throughout the improvement process, Sweep-N-Go 3.0 accomplishes its goal to create an efficient and effective automated data acquisition in
47 References
[1] M. Z. Zulkifli, S. W. Harun, K. Thambiratnam and H. Ahmad, "Self-Calibrating Automated Characterization System for Depressed Cladding EDFA Applications Using LabVIEW Software With GPIB," IEEE Transactions on Instrumentation and Measurement, vol. 57, no. 11, pp. 2677-2681, Nov. 2008.
[2] Lina Karam; Naji Mounsef, "Introduction to Engineering: A Starter's Guide with Hands-On Digital Multimedia and Robotics Explorations," Introduction to Engineering: A Starter's Guide with Hands-On Digital Multimedia and Robotics Explorations, Morgan &
Claypool, 2008, pp.
[3] X. Yuan, M. B. Cohen and A. M. Memon, "GUI Interaction Testing: Incorporating Event Context," in IEEE Transactions on Software Engineering, vol. 37, no. 4, pp. 559-574, July-Aug. 2011.
[4] E. A. Miranda, C. N. Abdelahad, M. M. Beron and D. E. Riesco, "Inferring Use-cases from GUI Analysis," IEEE Latin America Transactions, vol. 13, no. 12, pp. 3942-3952, Dec. 2015.
[5] System and method for converting a graphical program including a structure node into a hardware implementation, by National Instruments. (2001, Sept.
27). Patent 20010025231. Accessed on: Oct. 21, 2019. [Online]. Available: USPTO.
[6] Keysight, “InfiniiVision 2000 X-Series Oscilloscopes,” 5990-6618EN datasheet, 8 Aug. 2008.
[7] Keysight Technologies, “Keysight 34401A 6½ Digit Multimeter”, 34401-90013 datasheet, Aug. 2014.
[8] Keysight Technologies, “Keysight Technologies 33120A Function/Arbitrary Waveform Generator”, 5968-0125EN datasheet, 31 Jul. 2014.
[9] Keithley, “Model 2400 Series SourceMeter”, datasheet, Aug. 2001.
[10] Keysight Technologies, “E3640A – E3649A Programmable DC Power Supplies”, 5968-7355EN datasheet, 3 May 2018.
[11] Author Unknown. What is Automated Testing? (2019). Retrieved December 7, 2019, from
https://smartbear.com/learn/automated-testing/what-is-automated-testing/.
[12] MarketsandMarkets. (2019, September 9). Automation Testing Market Worth $28.8 Billion by 2024 - Exclusive Report by MarketsandMarkets™. Retrieved December 7, 2019, from
https://www.prnewswire.com/news-releases/automation-testing-market-worth-28-8-billion-by-2024--exclusive-report-by-marketsandmarkets-300913922.html.
[13] Young, A. (2003). Automated Data Acquisition in Electronic Circuit Laboratories. Retrieved December 12, 2019, from
48
[14] Rigol, “DP800 Series Programmable DC Power Supply”, DP832 datasheet, March 2013. [15] EE Department Faculty Members, “EE and CPE LAB SAFETY RULES”, California
Polytechnic University, January 2010.
[16] Rigol Technologies, “DM3058 Digital Multimeter”, Programming Guide, October 2009. [17] “IEEE Code of Ethics,” IEEE, 2020. [Online]. Available:
49 TABLE 5
APPENDIX A — ANALYSIS OF SENIOR PROJECT DESIGN Project Title: Sweep-N-G0 3.0
Student’s Name: Maria Pieroni Student’s Signature: Maria Pieroni Advisor’s Name: Dr. Braun Advisor’s Initials: DB
• 1. Summary of Functional Requirements
This project improves the current performance of the Sweep-N-Go LabVIEW (Version 2.0) program used in Cal Poly electrical engineering laboratories. Sweep-N-Go expediates the laboratory data collection process through automated testing. The new version of the program (Sweep-N-Go Version 3.0) reduces user debugging time, improve sustainability, increase efficiency, and considers all new lab bench equipment. Sweep-N-Go Version 3.0 includes an enhanced Graphical User Interface (GUI) for which students provided feedback to optimize user-efficiency. The program interfaces with instruments on every standard Cal Poly electrical
engineering lab bench through both USB and GPIB communication. After the user runs the program, they have the capability to capture the graph of collected data and export the data to a CSV file for further interpretation.
• 2. Primary Constraints
The original author of Sweep-N-Go in LabVIEW, so the developer of the new version must program in this same language so she can reuse the existing code. Furthermore, the lab equipment with which the program interfaces remains constant with existing lab equipment, so many functions addressing these instruments remain unchanged. The GPIB addresses for each instrument and other constrains can be found in Table I in Chapter 2. The high-speed GPIB standard requires no less than 2/3rds of the instruments must be powered for proper connection. This constraint affects the progress towards a solution that allows students the option to not power on all instruments to run the program. The only development tools available for this project reside in the electronic circuit laboratories on the Cal Poly campus. Students may only access these labs when lab classes occupy them.
• 3. Economic
50
department profits since they see a higher success rate in labs requiring the use of Sweep-N-Go. The Sweep-N-Go 2.0 program already exists, but by the end of June 2020, the new version should come to completion. The developer expects the project to last for a very long time, since the computer saves the code. There may necessitate some maintenance to integrate any new equipment that Cal Poly might purchase in the future. A student or professor might also need to account for any unexpected bugs in the code. According to the Gantt chart included above, the developer expects to finish the project over 200 hours of work.
• 4. If manufactured on a commercial basis:
Students do not need to pay to use the program, so the school does not sell this program. Furthermore, since the program does not require any components other than pre-existing lab equipment, there does not exist a production cost for the product. To produce this product for free on a commercial basis, the developer could publish this code to an open source.
Additionally, there would exist instructions as to what equipment the user needs and the GPIB addresses correlating to these instruments. However, large-scale consumers would most likely not have any use for the program, since the instruments provided in the Cal Poly electrical engineering labs are very expensive and not every other lab provides the same equipment. • 5. Environmental
51
powered all day. While this allowed the developer to remotely test the program through logging onto that bench’s computer, this process led to powering these instruments for essentially half a quarter (5 weeks). Due to the pandemic, the testing process caused a negative impact to power usage and contribution to greenhouse gasses.
• 6. Manufacturability
The long-term viability of Sweep-N-Go 3.0 could be potentially impacted by new computer hardware and software configurations. Furthermore, any addition of new lab
equipment would require an upgrade of the code, requiring programming updates. The developer could post the code on an open-source platform for laboratories supplying the same equipment. However, it would be unlikely that laboratories outside Cal Poly supply the same equipment. Therefore, this project would unlikely be manufactured outside of Cal Poly’s Electrical Engineering labs.
• 7. Sustainability
This project should last, if it can be saved on a computer for student use. Therefore, this program should not have too many issues maintaining the completed system. However, there exist some potential upgrades, where someone would have to alter the code. Cal Poly might upgrade the lab equipment which would entail someone updating the communication between the equipment in LabVIEW. Furthermore, students may find fault with the GUI or run into a bug that would cause impetus for further improvements to the code. Additionally, some Keysight & Windows updates break Sweep-N-Go, requiring our technical staff or Dr. Braun to debug and repair the issue. If an upgrade is required, it may prove difficult to find someone to complete these improvements since few EE students know how to code in LabVIEW.
• 8. Ethical
From the ethical framework of psychological egoism, people act in their own self-interest. Since Sweep-N-Go increases efficiency in labs and decreases student frustration in debugging the program, students should want to use the upgraded version of the program. However, this program could potentially take away from students learning new circuit concepts through manual data collection process. Therefore, it is recommended that students undertake both manual and automated approaches. Sweep-N-Go allows students to be introduced to the benefits of automated testing, such as improved accuracy and efficiency. The program also shows the characteristics of the circuit for which they are collecting data so the students still see the trends and concepts of the new circuits they study.
Furthermore, since this project allows a senior to graduate, it helps all students taking the EE labs requiring this program, and the professors teaching these labs, the ethical theory of utilitarianism supports this project. While this project takes time input from the developer and the project’s advisor, the benefits outweigh this cost. This project creates the greatest good for the greatest number of people.
52
precautions for social distancing while working on this project. This abides by the IEEE standards to “hold paramount the safety, health, and welfare of the public” [17]. Finally, this report honestly represents all Sweep-N-Go 3.0 functionality and testing further abiding by the IEEE code of ethics.
• 9. Health and Safety
Since Sweep-N-Go controls lab bench equipment, students must take precautions to protect against unexpected high voltages or currents set on these instruments. Students should practice common safety practices outlined in all labs when powering the equipment [15]. The program sets all output voltages and current once the sweep is complete, thereby ensuring no equipment has the potential to harm circuit components or people while not running.
Furthermore, the documentation outlining how to use the code also covers these safety precautions and warns students of the connections the program has to the equipment.
Due to the coronavirus pandemic, additional safety concerns arose while testing remotely. Since Dr. Braun connected circuits to the instruments controlled remotely through Sweep-N-Go, this posed a fire hazard. If the program set voltage or current levels too high, the circuit components could burn and cause a fire. Communication between the developer and Dr. Braun reduced this hazard.
• 10. Social and Political
This project directly impacts EE/CPE students and professors at Cal Poly. Sweep-N-Go 3.0 benefits professors, since they do not have to spend as much time helping students debug the software, and it helps students measure data more efficiently through automated data collection. This also benefits the people in technical support who must help debug issues with the program when students and faculty cannot achieve a functioning program. Companies looking to hire Cal Poly students would also benefit from students familiar with LabVIEW and automated testing. Sweep-N-Go 3.0 accounts for the new equipment installed at some of the benches, so all students in the lab have access to the program’s full capacity.
• 11. Development