Solid-like features in dense vapors near the fluid critical point
George Ruppeiner, Nathan Dyjack, Abigail McAloon, and Jerry Stoops
Citation: The Journal of Chemical Physics 146, 224501 (2017); doi: 10.1063/1.4984915
View online: http://dx.doi.org/10.1063/1.4984915
View Table of Contents: http://aip.scitation.org/toc/jcp/146/22
Solid-like features in dense vapors near the fluid critical point
George Ruppeiner,1,a)Nathan Dyjack,2Abigail McAloon,3and Jerry Stoops1
1Division of Natural Sciences, New College of Florida, 5800 Bay Shore Road, Sarasota, Florida 34243, USA
2Center for Genes, Environment & Health, National Jewish Health, 1400 S Jackson St., Denver,
Colorado 80206, USA
3Oak Hill School, 86397 Eldon Schafer Dr, Eugene, Oregon 97405, USA
(Received 20 March 2017; accepted 22 May 2017; published online 8 June 2017)
The phase diagram (pressure versus temperature) of the pure fluid is typically envisioned as being featureless apart from the presence of the liquid-vapor coexistence curve terminating at the critical point. However, a number of recent authors have proposed that this simple picture misses important features, such as the Widom line, the Fisher-Widom line, and the Frenkel line. In our paper, we discuss another way of augmenting the pure fluid phase diagram, lines of zero thermodynamic curvature
R= 0 separating regimes of fluid solid-like behavior (R>0) from gas-like or liquid-like behavior (R<0). We systematically evaluateRfor the 121 pure fluids in the NIST/REFPROP (version 9.1) fluid database near the saturated vapor line from the triple point to the critical point. Our specific goal was to identify regions of positiveRabutting the saturated vapor line (“feature D”). We found the following: (i) 97/121 of the NIST/REFPROP fluids have feature D. (ii) The presence and character of feature D correlates with molecular complexity, taken to be the number of atomsQper molecule. (iii) The solid-like properties of feature D might be attributable to a mesoscopic model based on correlations among coordinated spinning molecules, a model that might be testable with computer simulations. (iv) There are a number of correlations between thermodynamic quantities, including the acentric factorω, but we found little explicit correlation betweenωand the shape of a molecule. (v) Feature D seriously constrains the size of the asymptotic fluid critical point regime, possibly resolving a long-standing mystery about why these are so small. (vi) Feature D correlates roughly with regimes of anomalous sound propagation.Published by AIP Publishing.[http://dx.doi.org/10.1063/1.4984915]
I. INTRODUCTION
Fluid thermodynamic properties are readily measurable, and large data sets have been collected. Most of these data have been fit to convenient functional forms, typically for the molar Helmholtz free energy, and made available on compre-hensive websites. In our paper, we use the NIST Chemistry WebBook1,2to compute the thermodynamic curvatureRfor a broad range of fluids in the general vicinity of the fluid critical point, though not in the asymptotic critical region. Of specific interest are anomalous regions of positiveRin the dense vapor phase that we attribute to the formation of solid-like repulsive clusters.
Several previous studies onRwere done along the liquid-vapor coexistence curve and its extension into the supercritical region (the Widom line).3–5More generally,Rwas calculated
for the full fluid phase diagram of four fluids6 and for ther-modynamic data collected from computer simulations of the Lennard-Jones (LJ) fluid.7 There was also an investigation of Rin water near a conjectured second critical point in the metastable liquid phase.8The picture that emerged from these efforts is consistent and compelling. In our present paper, we add to this picture the results obtained by looking at 121 pure fluids in the dense vapor phase.
We are certainly aware that fits to fluid data are not free from uncertainty since the filling of fluid regimes with data
a)
is incomplete and uneven. There are also regimes near the critical point that pose special experimental and theoretical difficulties. In addition, fit quality is generally tested against data only up to the second-order derivatives of the Helmholtz free energy, short of the third-order derivatives present in the curvatureR. Hence, specific results of any of our fluids might be challenged.
However, the large fluid data fitting project underlying NIST/REFPROP represents results likely to be stable against major near term changes. We thus view our present project as timely and convey the hope that our “big data” effort over the totality of NIST/REFPROP, with no pause to examine the detailed goodness of fit for any particular fluid, transmits ideas that are essentially correct and point the way to further productive research.
Fluid properties result from the interactions among many molecules. Basic principles of intermolecular interactions is a topic that has seen considerable recent advances, particu-larly via quantum computational methods. But, the transition from the microscopic regime to the macroscopic thermody-namic regime poses great difficulties. Beyond rarefield gases, statistical mechanics9,10 offers only approximation schemes and the solution to microscopic models specifically devised for a ready solution. Of course, computer simulations provide powerful mimics of real systems, but even these can overlook fundamental insight.
Our paper further develops a relatively new approach to fluids, where instead of building up from the microscopic level,
as in statistical mechanics, we build down from the macro-scopic level to the mesomacro-scopic level. The idea is to relate important mesoscopic patterns to readily measured thermo-dynamic properties. It has been argued that thermothermo-dynamic fluctuation theory, augmented by the logically necessary ther-modynamic curvatureR, offers the necessary link between the macroscopic and the mesoscopic.
The thermodynamic curvatureR, always calculated at the macroscopic level, measures the size scale of mesoscopic fluc-tuations. Very near the critical point, |R| gives the diverging correlation lengthξ:|R| ∝ξ3.11–13Elsewhere, even at length scales as small as cubic nanometers, R gives the approxi-mate volume of organized mesoscale structures. The sign of
R is also significant: R is positive/negative for states where repulsive/attractive intermolecular interactions dominate.
Most of the fluid’s temperature-pressure phase diagrams correspond to average molecular separation distances suffi-ciently large that the attractive part of the intermolecular inter-action potential dominates. Thus,R in fluids is found to be mostly negative, diverging to negative infinity at the critical point. Fluid states with positiveRare somewhat special and typically occur at large densities, in solid-like states dominated by repulsive intermolecular interactions.
Of interest in our paper, however, are instances of positive fluidRin the general vicinity of the critical point. We found such features in the majority of the 121 fluids we examined. Our paper is a comprehensive look at phenomena spanning a range of fluids. Another recent large scale fluid tabulation has been the determination of the Gr¨uneisen parameter for 28 fluids.14
II. THEORY AND BACKGROUND
In this section, we give a theoretical background.
A. Thermodynamic geometry
Thermodynamics is typically defined in the thermody-namic limit in which we have a uniform system characterized by a few macroscopic parameters.15For the pure fluid, we have the internal energyU, the number of particlesN, the volume
V, and the entropyS. The fundamental thermodynamic equa-tion setsU=U(S,N,V). Define the temperatureT =U,S, the
pressurep=U,V, and the chemical potentialµ=U,N, where
the comma notation indicates partial differentiation.
Define the Helmholtz free energy A=UTS, with this quantity per volume f=A/V. We may naturally write
f=f(T,ρ), an expression which yields all of the thermody-namic properties.15Here,ρ=N/V is the particle density. We
also have the entropy per volumes=S/V=f,Tand the
chem-ical potentialµ=f,ρ. The energy per volumeu=U/V=f +Ts,
andp= −u+Ts+µρ.
Consider some open subsystemA, with fixed volumeV, of a very large environmentA0.A0has a fixed thermodynamic
state with temperature and density (T0,ρ0). The
thermody-namic state (T,ρ) ofAfluctuates as particles and energy are randomly exchanged with its environment. As was first argued by Einstein in 1904, the probability density for finding the state of Ain a small range of (T,ρ) to (T +dT,ρ+dρ) is
proportional to9,10
P dT dρ∝exp (Stotal/kB)dT dρ, (1)
whereStotal is the entropy ofA0whenAis in the state with
coordinates (T,ρ), andkBis Boltzmann’s constant.
To write the probability density in Eq. (1) in familiar thermodynamic terms, expand Stotal to second order around
its maximum corresponding to {T,ρ}={T0,ρ0}. Standard
methods9–11yield
P∝exp −V
2∆`
2
!
, (2)
where the thermodynamic metric
∆`2 = 1 kBT
∂s
∂T
!
ρ
∆T2+ 1
kBT
∂ µ ∂ ρ !
T
∆ρ2, (3)
with∆T=T−T0and∆ρ=ρ−ρ0. The coefficients of∆T2and
∆ρ2in Eq.(3)may be evaluated in either of the states (T0,ρ0)
or (T,ρ), since small fluctuations always have these states close together. Below, we evaluate these metric coefficients at (T,ρ).
The thermodynamic metric Eq. (3) induces a thermo-dynamic curvature R on the manifold of thermodynamic states,11,12
R=√1 g " ∂ ∂T 1 √ g
∂gρρ
∂T
!
+ ∂ ρ∂ √1 g
∂gTT
∂ ρ !#
, (4)
where
gTT =
1
kBT
∂s
∂T
!
ρ, (5)
gρρ= 1
kBT
∂ µ ∂ ρ ! T , (6) and
g=gTTgρρ. (7)
There is substantial evidence3–8,11–13,16 thatR is a ther-modynamic measure of intermolecular interactions. It appears that |R| gives the characteristic size of organized mesoscopic fluctuations in fluid and magnetic systems. In the asymptotic critical region, this size is given by the correlation lengthξ,
ξ3 =−1
2R. (8)
We add that since the analysis of Ref.12, the values of the crit-ical parameters for the correlation length have been upgraded for seven simple fluids,17a study that might lead to another check of Eq.(8).
The sign of R also appears to be significant: R is positive/negative for systems in states dominated by repul-sive/attractive intermolecular interactions.Rfor systems with no interactions between microscopic constituents, such as the pure ideal gas and the paramagnet, haveR= 0. These general findings have been verified in a number of contexts.
B. Extended features of the fluid state
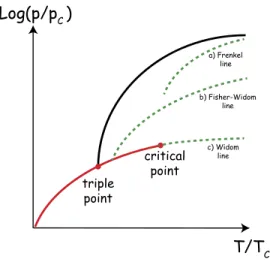
A theme in our paper is the identification of curves separating regimes of attractive and repulsive intermolecu-lar interactions. An early attempt to do this consists of the Fisher-Widom line marking the boundary between regimes of monotonic/oscillatory long-range decay of the pair corre-lation function G(r), corresponding to attractive/repulsive intermolecular interactions.21 This correspondence was demonstrated explicitly by calculations on several continuum models.21
Evanset al.22expanded on the Fisher-Widom argument, and Ruppeiner and Chance23discussed the Fisher-Widom line for the 1D Takahashi gas in the context of R. But a diffi-culty implementing this agenda with model calculations is that it requires a calculation ofG(r), and this is difficult to do beyond a few models in one dimension. However, modern computer simulation methods, for which a number of methods exist for calculating pair correlation functions, even for larger molecules, offer an update for this method. The Fisher-Widom line is shown schematically in Fig.1.
Another fluid line receiving recent attention is the Widom line,24–28representing the smooth continuation of the
liquid-vapor coexistence curve into the supercritical region. The Widom line is defined as the curve along whichξhas a maxi-mum. Experimental evidence for an abrupt crossover of certain dynamical fluid properties from gas-like on the low-pressure side to liquid-like on the high-pressure side has been reported along the Widom line.25
Since it is difficult to computeξ, the Widom line is usually determined using maxima in static thermodynamic response functions, such as the heat capacity. However, it was argued that, because of the proportionality Eq.(8), peaks in the readily calculatedR offer a better measure of the Widom line than response functions.3,5The Widom line is schematically shown
in Fig.1.
Yet another proposed addition to the fluid phase diagram is the Frenkel line, which is defined by the disappearance of
FIG. 1. Schematic diagrams of three curves supplementing the fluid phase diagram: (a) the conjectured Frenkel line, defined by the changing character of solid-like oscillations; (b) the Fisher-Widom line representing the crossover in the long-range pair correlation function decay from oscillatory to monotonic; and (c) the Widom line representing the smooth continuation of the boiling curve into the supercritical regime.
solid-like oscillations in particle dynamics. The Frenkel line marks a dynamic transition between the gas-like and liquid-like behaviors for which experimental evidence has been reported.29,30 The Frenkel line is schematically shown in
Fig.1.
Also yielding special curves in the dense fluid and solid states is the Roskilde-simple systems in which the simplic-ity of the repulsive intermolecular interaction yields univer-sal curves when expressed in terms of appropriately reduced thermodynamic variables.31This idea applies as well to real systems.
C. Mesoscopic structures in the fluid state
Useful for further discussions of fluids is a computer fluid composed of particles interacting via the Lennard-Jones (LJ) pair potential,
φ(r)=4 "
σ
r
12
−
σ
r
6#
, (9)
whereris the distance between two particles, andσandare the size and energy parameters. Figure2 shows this LJ pair potential, which offers a good approximation of the potential in real fluids. The arrows denote (a) approximately where LJ computer simulations indicateR= 0 in the supercritical regime for a range of reasonableT’s,7(b) where the pair potential has its minimum, and (c) where LJ computer simulations indicate the critical density.32
For real fluids in the gaseous state, and with a large intermolecular separation distancer, the attractive part of the intermolecular potential dominates, andRis negative. Attrac-tive interactions also dominate near the critical point, at which
R→ −∞. In the condensed liquid or solid states, where the molecules are essentially touching each other, we typically find |R|1/3on the order of a molecular separation distance. As
in the LJ fluid, the corresponding sign ofRmay be positive or negative, “solid-like” or “liquid-like,” respectively. The former case typically has the larger densities and has the molecules in the regime of repulsive interactions.
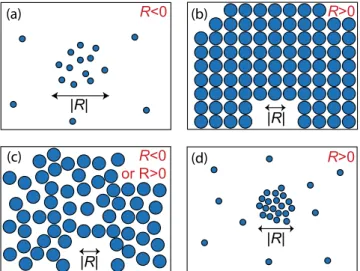
FIG. 3. Schematics of four organized mesoscopic particle configurations and theirR’s: (a) an attractive near critical point cluster, withR<0 and|R| ∼ξ3;
(b) the solid state, with positiveR∼vand withvthe molecular volume; (c) the compact liquid state, with positive or negativeRand|R| ∼v; and (d) a repulsive solid-like cluster held up by close-range particle repulsion, with positiveR∼cluster volume.
More difficult to interpret physically are anomalous states of positiveRin the vicinity of the critical point, with densities less than the condensed densities. We interpret such solid-like states in terms of fluctuating “repulsive clusters,” schemati-cally shown in Fig. 3, along with three other characteristic mesoscopic structures. Identifying repulsive cluster states in a broad range of dense vapors is the main point of our paper. One of us proposed4that the average repulsive cluster volume
is given byR, but the only previous case reported of positiveR
in the dense vapor phase was in water,6with clusters identified
in computer simulations.33
To form repulsive clusters requires a reasonably high den-sity, else the molecular collision rate is too low to overcome the natural tendency for these clusters to break up. But we do not want the density so high as to be in the liquid or solid state, which are quite different. Our suggestion here is that conditions for repulsive clusters might hold in the dense vapor phase, as schematically shown in Fig.4, where this state is referred to as feature D.
To summarize, the repulsive cluster state differs substan-tially from the solid state and from the solid-like liquid state. The latter two states have larger densities and positiveR val-ues on the order of the volume of a molecule. In contrast, the repulsive cluster state corresponds to lower densities, the characteristic more of a dense gas, and hasRthat may become much larger than the volume of a molecule.
D. Feature D and the Bethe, Zel’dovich, and Thompson (BZT) region
Feature D might relate to sound propagation anomalies in dense vapors near the liquid-vapor coexistence curve. The fluid sound velocitycis given by the isentropic compressibility,34
c2=−ν2 ∂p
∂ν !
s
, (10)
where ν and s denote the volume and entropy per mass, respectively. Anomalous sound propagation results from the
FIG. 4. A schematic fluid phase diagram, showing the triple point, the critical point, the sublimation curve, the melting curve, and the boiling curve. Red/blue indicates whether the sign ofRis positive/negative. Feature A is the solid phase, features B and C are in the liquid phase, but with conjectured solid-like properties, feature D corresponds to the repulsive cluster phase of primary interest in our paper, and feature E is the majority of the gas phase. The red dot
Rmaxdenotes the location of the maximum value ofRwithin feature D. The dotted circle around the critical point indicates the asymptotic critical regime, significantly contracted by the presence of feature D. Boundaries between features with oppositeRsigns not on a coexistence curve do not have sharp thermodynamic discontinuities.
dependence ofconν, resulting in variable sound speed along the wave train. The result is a tendency to form shock waves, a tendency measured by the fundamental derivative of gas dynamics,35
Γ=1−ν c
∂c
∂ν !
s
. (11)
ForΓ<0, there is the possibility of “nonclassical” rarefield shock waves in regions referred to as Bethe, Zel’dovich, and Thompson (BZT) regions originally identified in the van der Waals (vdW) model in dense saturated vapors.
Colonna and Guardone35correlated the BZT region in the
vdW model with increasing molecular complexity and with increasing constant volume molar specific heat capacitycν. Their measure of molecular complexity was the number of classical degrees of freedom (translational, vibrational, and rotational),
Navail=6Q−5−, (12)
whereQis the number of atoms per molecule and=−2, 0, 1 for monatomic, linear polyatomic, and nonlinear polyatomic molecules, respectively.Navailonly sets an upper limit for the number of degrees of freedom, which might not be all active at low temperatures. In our study, it turns out thatQis our best measure of complexity, so we essentially agree with the choice of complexity measure in Ref.35, since theQterm dominates inNavail.
The BZT study was later extended to real gasses having parametrized fit equations of state36and to a database of 1800
pure fluids represented by simple models.37 The later study
found 185 organic molecules having BZT regions, with most of the BZT molecules having 10 or more carbon atoms, more than most of the molecules considered here.
In terms of rough location and dependence on molecular complexity, the BZT region correlates at least qualitatively with feature D. An additional similarity is that bothΓandR
Perhaps, feature D and the BZT region have some common mesoscopic mechanism.
E. Measures of molecular complexity
The character of feature D correlates with molecular com-plexity, for which we considered three measures. The first is the molecular weight,MW. For organic molecules, theMW cor-relates roughly with molecular complexity, since, typically, a larger MW means more atoms per molecule. But theMW
could be misleading because a simple molecule composed of heavy atoms might have a largeMW, e.g., monatomic krypton hasMW= 83.80 g/mol, and polyatomic cyclohexane hasMW
= 84.16 g/mol.
Our second complexity measure is the weight-independent number of atoms Q per molecule, determined by consulting PubChem.38 With Q reasonably large, Q is
essentially a measure equivalent toNavailin Eq.(12). Our third complexity measure is the Wiener index Wi, which in chemical graph theory is a topological index of a molecule.39,40 Wiis defined as the sum of the lengths of the shortest paths between all pairs of connected vertices in the chemical graph of the molecule. A pair of adjacent atoms in a molecule contribute 1 to the path length if they are connected by a chemical bond, and 0 otherwise. Sometimes the hydrogen atoms are left out of this measure, but since they are included in bothMW andQ, we will include them as well in our Wi
calculations.
Another microscopic measure of a molecule is its shape, which we classified according to its spatial molecular dimen-siond: 0, 1, 2, or 3. All our molecules were visually inspected in PubChem38 and assigned a value of d. In some cases, d
was clear, for example, argon (d= 0), decane (d= 1), ben-zene (d= 2), and isobutane (d= 3). The spatial dimension was visually estimated for molecules with complex structural arrangements.
An attempt at a thermodynamic measure of d is the acentric factorωdefined as
ω=−log10
psat
pc
!
−1, (13)
wherepsat is the saturated vapor pressure evaluated at T/T
c
= 0.7,41p
cis the critical pressure, andTcis the critical
tem-perature.ωis intended as a measure of the non-sphericity of molecules, and it is defined so that monotonic atoms (d = 0) haveωnear zero.
F. Corresponding statesPmaxof maximumR
Identifying and characterizing the fluids with feature D is the major theme of our paper. But we may also make sys-tematic comparisons between Dfluids (fluids with feature D), provided we identify corresponding reference states between the Dfluids. For each Dfluid, we picked the pointPmax
hav-ing the maximum valueRmaxofRin feature D.Pmax always
seemed to lie on the saturated vapor curve itself, and all of our reportedRmaxvalues were located there.
We might naively expect some form of common behav-ior between Dfluids at Pmax, even though it might be hard
to specify what such a behavior is without specific knowl-edge of the mesoscopic mechanism behind feature D. For
selecting a reference state, an advantage of R over other thermodynamic functions is not just its direct connection to mesoscopic fluctuations, but the existence of a local maximum forR.
G. The alkanes, perfluoroalkanes, and repulsive clusters
Although Rmax allows for overall comparisons between
all of the 97 Dfluids, emerging relationships could be some-what difficult to interpret physically because of substantial differences among the Dfluid molecules. Families of related molecules allow more focused comparisons. Our primary example consists of the linear alkanes.
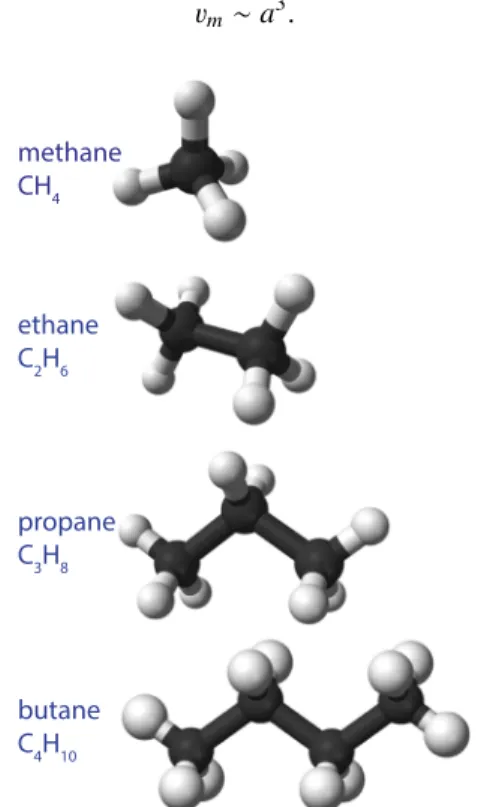
The linear alkanes start with methane CH4 and can
be thought of as extended progressively by adding a car-bon atom and two hydrogen atoms at a time; see Fig. 5. A similar sequence consists of perfluoroalkanes, with fluo-rine atoms in place of the hydrogen atoms in alkanes. The alkane Dfluids that we looked at were ethane,42 propane,43 butane,44pentane,45hexane,45heptane,45octane,45nonane,46 decane,46 undecane,47 and dodecane.48 The perfluoroalkane Dfluids that we looked at were hexafluoroethane (R116),46 octafluoropropane (R218),46perfluorobutane,49and perfluoro-pentane.49
For alkanes, we offer two possible mesoscopic pictures of what might constitute the “repulsive clusters” producing feature D. Picture A has an alkane molecule in isolation, in a situation with relatively large molecular volumev; see Fig.6(a). Letc= 0.15 nm be the approximate carbon-carbon bond length, and letabe the approximate length of an alkane chain. By virtue of its thermal rotation, the isolated alkane molecule sweeps out a spherical volume,
vm∼a3. (14)
FIG. 5. The first four members of the linear alkane series of molecules, with chemical formulas CnH2n+2(n=1, 2, 3,. . .). Except for methane, all the linear
FIG. 6. Two possible physical pictures of repulsive clusters: (a) indepen-dently thermally rotating pentane molecules, each of lengtha, and occupying a roughly spherical volumevm∼a3; (b) a line of linear molecules, spaced
closely enough to coordinate their thermal rotations to avoid mutual repul-sion. The length of such a chain should be approximatelyR1/3. Our results point to picture B as the better explanation for feature D.
If there are n c–c bonds in the alkane chain, then we have
a∼n×c, and sinceascales up linearly withQ, we have
vm∝Q3, (15)
forQnot too small.
Picture A thus has the repulsive clusters consisting of indi-vidual, widely spaced molecules, with their constituent atoms repelling each other by the rules of quantum mechanics. How-ever, if picture A is to be the correct physical interpretation for feature D, then we must haveRmax∼vm, as shown in Fig.3(d).
But below we foundRmaxvmfor all of the alkanes, contrary
to picture A, so picture A is not consistent with our data. Picture B has the molecules more closely spaced, so that they have to rotate in tandem to avoid mutual repulsion, as shown in Fig.6(b). To organize such a gearing action requires molecular volume v∼vm, since if vmv, the molecules are
too close and tangled to rotate effectively, and ifvmv, the
molecules are too far apart to interact significantly. We would expectR1/3to give the length of a coordinated geared chain,
and we might expect R1/3to become quite large. Below, we
found that for the alkane molecules, the conditions obtain for picture B:v∼vm andRmaxvm. Picture B might thus have
physical validity.
Zwanzig has analyzed a network system of gears on a two-dimensional lattice.50 Spectroscopic evidence for molecular gearing in the form of the counter-rotation of the six methyl groups attached to a benzene ring in hexamethylbenzene was recently reported by Burnellet al.51 This process is similar in spirit to what is being proposed here. However, gearing takes place within single molecules, with no collective effect involving molecules in numbers.
III. RESULTS
In this section, we present our results based on the study of the NIST/REFPROP database.1,2NIST/REFPROP interpo-lates real fluid thermodynamic data with the most accurate
equations of state, representing a combination of multiparam-eter fitting functions and simplified fluid models. Each fluid in the database is represented by its molar Helmholtz free energy as a function of (T,ρ), yielding all of the thermodynamic quan-tities, includingR. The current edition (9.1) includes 121 pure fluids.
A. Search protocol and tabulation
For each of the 121 pure fluids in NIST/REFPROP, we searched for Dfluids by tabulatingRversusT along the sat-urated vapor phase curve. Wherever possible, our search for positiveRextended from the triple point to the very near criti-cal point, yielding 97 Dfluids. For a number of the Dfluids, we examinedRon numerical grids abutting the saturated vapor phase. As best as we could tell, the maximum valueRmax in
feature D was always located on the saturated vapor curve. We also found a few fluids with positiveRin the saturated vapor phase near the triple point (e.g., neon). But near the triple point, the pressure and the vapor density are both typically very low, and obtaining high quality thermodynamic data can be diffi-cult. Hence, we include no discussion of positiveRnear triple points.
The full tabulation of Dfluids is given in thesupplementary material. Also tabulated, there are 24 fluids lacking feature D. Since the presence of feature D was found to correlate with increasing molecular complexity, fluids lacking feature D were mostly simple molecules.
B. Interpretation of collective results
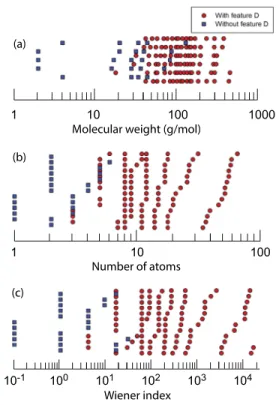
Figure7 indicates the presence/absence of feature D as functions of our three measures of molecular complexity. Each
measure shows a region of overlap between fluids with/without feature D. Since we have no firm theoretical basis for picking any particular complexity measure over another, we simply preferred measures which minimize the region of overlap in Fig.7. TheMW has 75/121 fluids in the region of overlap (a number inflated by the heavy outlier xenon); bothQandWi
have 23/121 overlaps. Clearly the weight independent mea-suresQandWiproduce the clearest separation between fluids with/without feature D. Figure 13 in theAppendix has the receiver operating characteristic (ROC) curves amplifying this point.
Figure8showsWias a function ofQfor all of our flu-ids. The correlation between Wi and Q is good, roughly a power law with slope 2.7340. As these two complexity mea-sures are equally valid, we feature a conceptually simpler
Q. Table I in the Appendix has Spearman (ρ) and Pear-son (r) correlation coefficients calculated for all of our data sets.
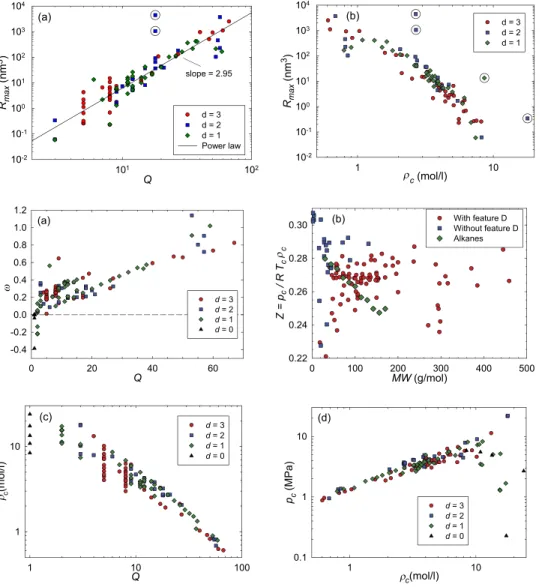
Figure 9(a)shows Rmax versusQ for the Dfluids.Rmax
trends upwards with increasing Q, in rough accord with a power law: Rmax=0.006 999 nm3 Q2.947. We indicate with
symbol types the molecular dimension d. Visual inspection shows little correlation betweenRmaxandd, in line with
expec-tations thatRmeasures mesoscopic properties, and not micro-scopic ones. This point is amplified with statistical analysis
FIG. 8. WiversusQfor all of our fluids. The correlation between these two complexity measures is seen to be good, roughly a power law with slope 2.7340. Fewer than 121 data points are visible because several of the points overlap. The five monatomic fluids (each withWi= 0) are not displayed.
in the Appendix. The two circled outlier points at Q= 18, and well above the best-fit line, areo-xylene andp-xylene. Figure9(b)shows Rmax as a function of ρcfor the Dfluids. Rmax decreases with increasing ρc, with little visual
depen-dence ond. The four circled outlier points above the best fit areo-xylene,p-xylene, methanol, and water.
Before we discuss feature D further, we display some additional relationships in Fig. 10. Figure 10(a) shows the acentric factorω for all the 121 fluids. Other than helium’s
FIG. 9. The maximum thermodynamic curvature Rmax in feature D of each Dfluid: (a) Rmax trends upwards with increasingQroughly as a power law with slope 2.95; and (b) Rmax trends downwards with increasing ρc. Little
visual correlation betweenRmaxand the molecular dimension d is evident in either figure. The circled points indicate clear outliers, identified in the text.
FIG. 11. Contour diagrams for R for (a) ethane, with feature D con-fined to near the dense vapor phase (Rmax= 0.236 nm3), and for (b) propane,
with a more open feature D extend-ing into the supercritical regime (Rmax
= 3.78 nm3). TheRvalues for propane, with its largerQ, are larger than those for ethane. The open feature D is char-acteristic of fluids with larger values of
Q.
ω=−0.385, the other four noble gasses in NIST/REFPROP haveω very small. Overall, ω clearly trends upwards with
Q, so it does measure molecular complexity. However, other than the fact that larger Q’s more readily allow more com-plicated molecular shapes, there is no particularly strong visual correlation in Fig. 10(a) between ω and d, perhaps surprising.
We graph as well the dimensionless
Z = pc
R Tcρc
(16)
versus the molecular weight MW (where R here is the uni-versal gas constant). According to the vdW law of corre-sponding states, we expect a universal valueZ= 3/8 = 0.375.10 Figure10(b)shows that for all of our fluids theZvalues fall between 0.22 and 0.31, a bit lower than the vdW value. But despite the wide variation in the critical point parameters, the combination of parameters inZhas values grouping together, emphasizing the power of a simple equation of state to model a wide range of fluids.
Figures10(c)and10(d)show correlations amongρc,pc,
and Q. For example, the molar density ρc decreases with
increasingQbecause larger molecules occupy more space at the critical point.
C. Alkane and perfluoroalkane results
In this subsection, we present results for the alkanes and the perfluoroalkanes, two families of linear molecular chains. Figure11(a)shows anR-diagram for ethane, with a localized feature D of a type shown in Fig.4, and also found in water.6 Figure11(b) shows an R-diagram for propane, with a more
open feature D, encompassing portions of the supercritical region. All of the alkanes beyond propane have features D’s of this open type.
Figures 11(a) and 11(b) show as well the point Pmax,
where the maximum value Rmax was found. We did a grid
search for a number of the Dfluids, and it appears thatPmax
is always on the coexistence curve itself. Thesupplementary material adds information about the alkanes and the perflu-oroalkanes at Pmax: temperature Tmax, pressure pmax, and
densityρmax.
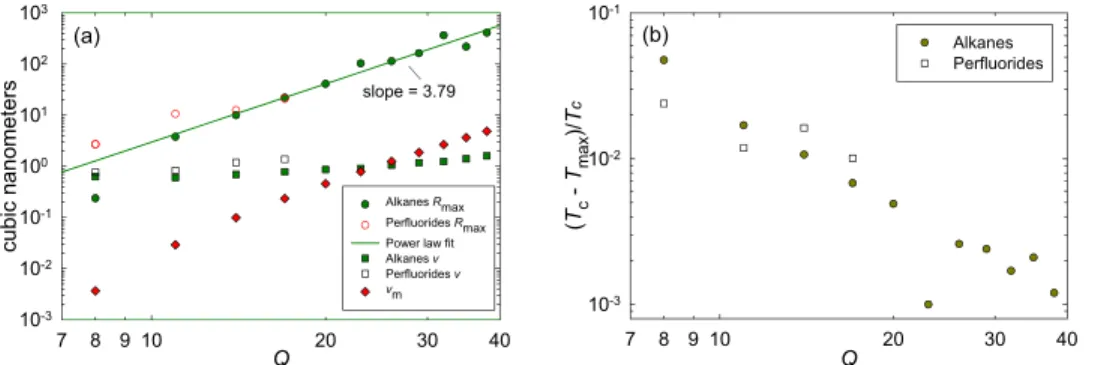
Figure12(a)showsRmaxversusQfor the alkanes, as well
as the molecular volumevmax=ρ−max1 atPmax, and the volume
of the moleculevm given in Eq.(14). Other than for ethane
(Q= 8), we clearly haveRmax much greater than both v and
vm, speaking to organized mesoscopic structures in the dense
vapor encompassing a number of molecules. We see in addition that beyond the lighter alkanes,v∼vm, possibly enabling the collective mechanism of organized rotation we proposed in Fig.6(b). Notice also thatRmax scales up roughly the same
way asvm, speaking to some type of linear structure at the root
of the repulsive clusters.
D. Constrained critical region
Feature D is not an asymptotic critical point property, and its presence constrains the size of the asymptotic criti-cal region. Previously, one of us4 proved the commensurate
R theorem, stating that for a given fluid in the asymptotic critical point region, the values of R in the coexisting liq-uid and vapor phases are strictly equal to each other. Speci-fically,
FIG. 12. Properties atPmax: (a)Rmax
for alkanes and perfluoroalkanes, with the molecular volumevmax, and the
vol-ume of the moleculevm; (b) the reduced
Rl,v =A|t|α−2, (17)
with reduced temperature
t= T−Tc Tc
, (18)
heat capacity critical exponentα, and constant critical point amplitude A. The subscripts “l, v” refer to the values of R
along the liquid and vapor parts of the coexistence curve, respectively.
The evaluation of R in a number of systems (includ-ing the ones here) indicates thatRis always negative in the asymptotic critical point region. Hence, A is negative, and Eq. (17) is inconsistent with feature D, with its positiveR. Clearly, feature D cannot be in the asymptotic critical point region.
These findings might resolve a long-standing question in critical phenomena: why do fluids typically have such com-paratively small asymptotic critical point regions? To quote Stanley:52“But even the hand waving arguments do not explain
why in some systems scaling holds for only 1%–2% away from the critical point and in other systems it holds for 30%–40% away.” If our picture is correct, the truncated fluid asymp-totic critical regions could be attributed to feature D and the formation of its repulsive clusters. This constraining of the critical point region by feature D is shown explicitly in Fig.12(b).
For the ferromagnetic 1D Ising model, R is uniformly negative.53,54 If the ferromagnetic 3D Ising model, with a critical point in the same universality class as that of the pure fluid, can be proved likewise to have uniformly neg-ative R, then it would lack any feature D, releasing the constraint on the asymptotic critical region. We add that of the seven fluids in the asymptotic correlation length report we cited17 following Eq. (8), it turns out that only SF
6 is
a Dfluid. The fluids picked in this correlation length study are presumably the ones with fairly large asymptotic critical regions.
IV. CONCLUSION
In our paper, we built on the theme of extending the pure fluid phase diagram beyond the well-known features of the sublimation curve, the melting curve, the boiling curve, and the associated triple and critical points. Previous proposals to
extend the phase diagram included the Widom line, the Fisher-Widom line, and the Frenkel line. Our present study was made in the context of the thermodynamic curvatureR, where it was proposed previously that curves with R= 0 separate regions dominated by attractive/repulsive intermolecular interactions,
R<0/R>0, respectively.
Our particular focus here was on regions with positive
R in the dense vapor phase, “feature D.” Feature D was found to be present in all fluids except those consisting of the simplest molecules. 97/121 of the fluids in the NIST/REFPROP database are Dfluids. The sizeRmaxof the maximumRin
fea-ture D was found to increase as a power law with the number of atoms Q per molecule. Our identification of the Dfluids and our connection ofRmax to molecular complexity are the
main results of our paper. In addition, we proposed a meso-scopic model attributing the repulsive interactions producing feature D to correlations among rotating molecules. Such a mechanism might be searched for in computer simulations. We also compared several measures of molecular complexity and classified molecules according to their spatial dimension
d. We found that the acentric factorωcorrelates with molecular complexity, but not otherwise withd. In addition, we displayed the strong constriction of the asymptotic fluid critical regime by feature D.
SUPPLEMENTARY MATERIAL
Seesupplementary materialfor data tables for all of our fluids.
ACKNOWLEDGMENTS
Many thanks to Peter Mausbach for bringing to our attention the theme of nonclassical sound propagation in Refs.35–37and for Refs.50and51on geared systems.
APPENDIX: STATISTICAL METHODS
In this appendix, we present supplementary statistical analysis for our graphs.
The data shown in Fig.7relate the presence/absence of feature D to three possible measures of complexity. Since we have no firm theoretical basis for preferring any one complexity measure to another, we assessed empirically the respective classification strengths of MW, Q, and Wi.
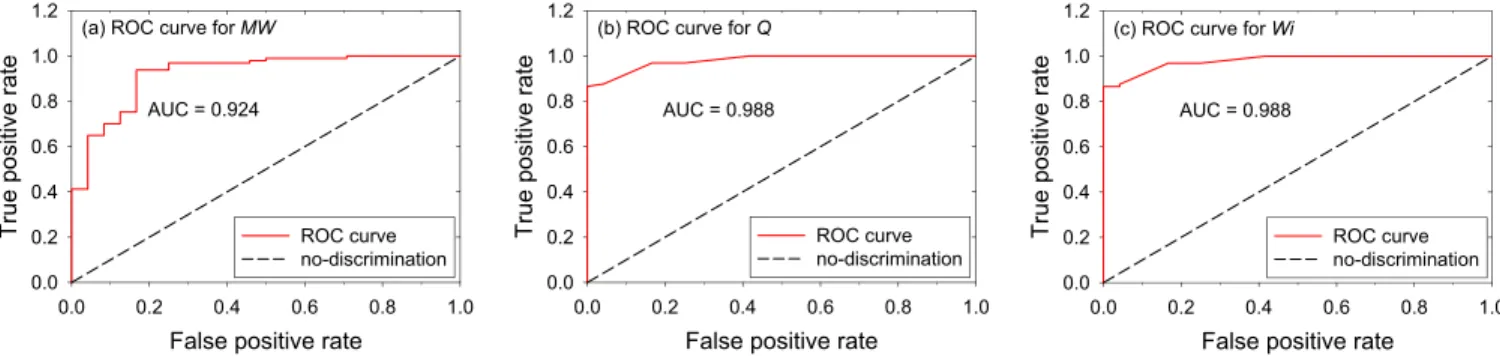
We calculated the receiver operating characteristic (ROC) curves of the data in Fig. 7, with the results shown in Fig.13.
Generally, ROC curves plot the true positive rate against the false positive rate at various threshold settings in the clas-sification model. ROC curves indicate the performances of binary classifiers. Very accurate predictive curves follow the left-hand graph border to the point (0, 1), and then follow the top border of the ROC graph to the point (1, 1), and have area under the curve (AUC) near unity.55An ROC curve closely following the 45° diagonal line of no-discrimination repre-sents a completely random binary classifier, with no predictive power.
Binomial logistic classification models for each measure were generated in theRstatistical programming language,56 with parameters fit by iteratively reweighted least squares regression. The ROC curves, as well as their AUCs, were com-puted using the ROCR package.57As demonstrated in Fig.13,
all three complexity measures demonstrate excellent classifi-cation power for feature D, with the best beingQandWi, as we also concluded from Fig.7.
Spearman (ρ) and Pearson (r) correlation coefficients, both of which fall in the range [1, 1], were calculated to quantify the correlations depicted in Figs.8–10and12, with values given in TableI. These correlations were computed in theRstatistical programming language.56
The data shown in Figs.9 and10qualitatively demon-strate that the molecular dimension d of a Dfluid does not
TABLE I. The Spearman (ρ) coefficient and the Pearson (r) coefficient for the data point sets in our figures.
F8 F9a F9b F10a F10b F10c F10d
ρ 0.999 0.915 0.940 0.748 0.258 0.946 0.672
r 0.911 0.479 0.308 0.834 0.186 0.621 0.486
F12aAR F12aPR F12aAV F12aPV F12aVm F12bA F12bP
ρ 0.991 1.000 0.991 1.000 1.000 0.855 0.800
r 0.900 0.977 0.980 0.970 0.927 0.723 0.778
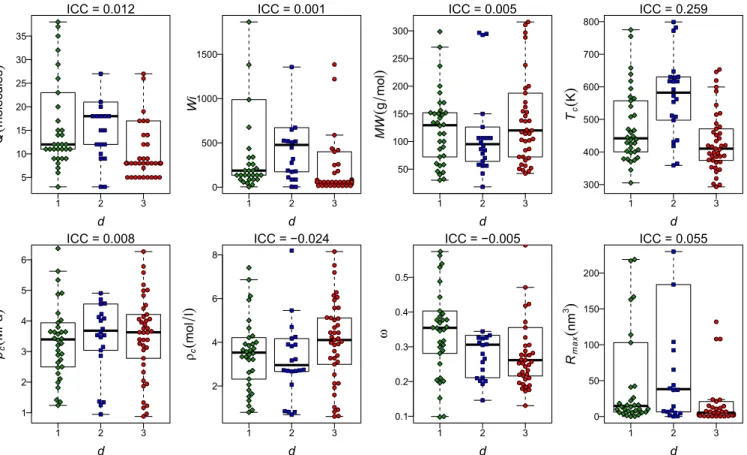
strongly associate with other Dfluid features. To quantify the strength of these relationships, the intraclass correlation (ICC) for each Dfluid attribute in our paper was calculated using theRpackage “ICC.”58The ICC is an inferential
statis-tic that conveys the relatedness of measurements classifying naturally into groups. An ICC value of 1 indicates that the measurements for each grouping are perfectly similar within a group.59 An ICC value of 0 (or negative) indicates com-plete noise. In our analysis, the groups were classified accord-ing to theird value, and the measurements were the Dfluid attributes.
As expected, the ICC values shown in Fig. 14indicate that d very weakly (or even negatively) associates with the other characteristic Dfluid data. Even the measurementTcthat
demonstrates the greatest ICC (=0.259) withdis unconvinc-ing. Box plots of each Dfluid attribute grouped according tod, and the corresponding ICC’s, are given in Fig.14.
1NIST Chemistry WebBook, http://webbook.nist.gov/chemistry/. This
database is also available for installation on PC’s, as program REFPROP, with module RIEM for calculating R. We used version REFPROP 9.1.
2E. W. Lemmon, M. L. Huber, and M. O. McLinden,REFPROP: Reference 1678 Fluid Thermodynamic and Transport Properties, Version 9.1 (National Institute of Standards and Technology, Gaithersburg, MD, 2014).
3G. Ruppeiner, A. Sahay, T. Sarkar, and G. Sengupta,Phys. Rev. E86,052103
(2012).
4G. Ruppeiner,Phys. Rev. E86, 021130 (2012).
5H.-O. May and P. Mausbach,Phys. Rev. E85, 031201 (2012).
6G. Ruppeiner, P. Mausbach, and H.-O. May,Phys. Lett. A379, 646 (2015). 7H.-O. May, P. Mausbach, and G. Ruppeiner,Phys. Rev. E88, 032123
(2013).
8H.-O. May, P. Mausbach, and G. Ruppeiner,Phys. Rev. E91, 032141 (2015). 9L. D. Landau and E. M. Lifshitz,Statistical Physics(Elsevier, New York,
1980).
10R. K. Pathria and P. D. Beale, Statistical Mechanics
(Butterworth-Heinemann, Oxford, 2011).
11G. Ruppeiner,Rev. Mod. Phys.67, 605 (1995); Erratum,68,313(1996). 12G. Ruppeiner,Phys. Rev. A20, 1608 (1979).
13D. A. Johnston, W. Janke, and R. Kenna, Acta Phys. Pol. B34, 4923
(2003).
14P. Mausbach, A. K¨oster, G. Rutkai, M. Thol, and J. Vrabec,J. Chem. Phys. 144, 244505 (2016).
15H. B. Callen,Thermodynamics and an Introduction to Thermostatistics
(Wiley, New York, 1985).
16G. Ruppeiner,Am. J. Phys.78, 1170 (2010).
17Y. Garrabos, F. Palencia, C. Lecoutre, and C. Erkey,Phys. Rev. E73, 026125
(2006).
18F. Weinhold,J. Chem. Phys.63, 2479 (1975). 19B. Andresen,Entropy17, 6304 (2015).
20M. R. Ubriaco,J. Phys.: Conf. Ser.766, 012007 (2016). 21M. E. Fisher and B. Widom,J. Chem. Phys.50, 3756 (1969).
22R. Evans, J. Henderson, D. Hoyle, A. Parry, and Z. Sabeur,Mol. Phys.80,
755 (1993).
23G. Ruppeiner and J. Chance,J. Chem. Phys.92, 3700 (1990). 24P. F. McMillan and H. E. Stanley,Nat. Phys.6, 479 (2010).
25G. Simeoni, T. Bryk, F. Gorelli, M. Krisch, G. Ruocco, M. Santoro, and
T. Scopigno,Nat. Phys.6, 503 (2010).
26V. V. Brazhkin, Y. D. Fomin, A. G. Lyapin, V. N. Ryzhov, and E. N. Tsiok, J. Phys. Chem. B115, 14112 (2011).
27V. V. Brazhkin, Y. D. Fomin, V. N. Ryzhov, E. E. Tareyeva, and E. N. Tsiok, Phys. Rev. E89, 042136 (2014).
28D. Corradini, M. Rovere, and P. Gallo,J. Chem. Phys.143, 114502 (2015). 29D. Bolmatov, V. Brazhkin, and K. Trachenko,Nat. Commun.4, 2331 (2013).
30D. Bolmatov, M. Zhernenkov, D. Zav’yalov, S. Tkachev, A. Cunsolo, and
Y. Cai,Sci. Rep.5, 15850 (2015).
31T. B. Schrøder and J. C. Dyre,J. Chem. Phys.141, 204502 (2014). 32M. Thol, G. Rutkai, A. K¨oster, R. Lustig, R. Span, and J. Vrabec,J. Phys.
Chem. Ref. Data45, 023101 (2016).
33E. Johansson, K. Bolton, and P. Ahlstr¨om,J. Chem. Phys.123, 024504
(2005).
34L. D. Landau and E. M. Lifshitz,Fluid Mechanics(Pergamon, New York,
1975).
35P. Colonna and A. Guardone,Phys. Fluids18, 056101 (2006).
36P. Colonna, N. Nannan, A. Guardone, and T. van der Stelt,Fluid Phase Equilib.286, 43 (2009).
37M. Castier and V. Cabral,Fluid Phase Equilib.334, 128 (2012).
38S. Kim, P. A. Thiessen, E. E. Bolton, J. Chen, G. Fu, A. Gindulyte,
L. Han, J. He, S. He, B. A. Shoemaker, J. Wang, B. Yu, J. Zhang, and S. H. Bryant,Nucl. Acids Res. 44(D1), D1202 (2015), PubChem,
http://pubchem.ncbi.nlm.nih.gov..
39H. Wiener,J. Am. Chem. Soc.69, 17 (1947).
40B. Mohar and T. Pisanski,J. Math. Chem.2, 267 (1988).
41J. O. Valderrama and P. A. Robles,Ind. Eng. Chem. Res.46, 1338 (2007). 42D. Buecker and W. Wagner,J. Phys. Chem. Ref. Data35, 205 (2006). 43E. W. Lemmon, M. O. McLinden, and W. Wagner,J. Chem. Eng. Data54,
3141 (2009).
44D. Buecker and W. Wagner,J. Phys. Chem. Ref. Data35, 929 (2006). 45R. Span and W. Wagner,Int. J. Thermophys.24, 41 (2003). 46E. W. Lemmon and R. Span,J. Chem. Eng. Data51, 785 (2006). 47I. S. Aleksandrov, I. S. Gerasimov, and B. A. Grigor’ev,Therm. Eng.58,
691 (2011).
48E. W. Lemmon and M. L. Huber,Energy Fuels18, 960 (2004). 49M. L. Huber and J. F. Ely,Int. J. Refrig.17, 18 (1994). 50R. Zwanzig,J. Chem. Phys.87, 4870 (1987).
51E. E. Burnell, C. A. de Lange, and W. L. Meerts,J. Chem. Phys.145, 091101
(2016).
52H. E. Stanley,Rev. Mod. Phys.71, S358 (1999). 53G. Ruppeiner,Phys. Rev. A24, 488 (1981).
54H. Janyszek and R. Mrugała,Phys. Rev. A39, 6515 (1989). 55D. Bamber,J. Math. Psychol.12, 387 (1975).
56R Core Team, R: A language and environment for statistical comput-ing (R Foundation for Statistical Computing, Vienna, Austria, 2017),
http://www.R-project.org/.
57T. Sing, O. Sander, N. Beerenwinkel, and T. Lengauer,Bioinformatics21,
3940 (2005).
58M. E. Wolak, D. J. Fairbairn, and Y. R. Paulsen,Methods Ecol. Evol.3, 129
(2012).