The
OHIO
Journal of
Teacher Education
The
OHIO
Journal of
Teacher Education
FALL 2016 .VOLUME 30 . NUMBER 2
PUBLISHED BY THE OHIO ASSOCIATION OF TEACHER EDUCATORS
Dr. D. Mark Meyers, Xavier University
Dr. Jean F. Eagle, Miami University
Message from the Editors 1
Editorial Board 3
A Call for Editorial Board Membership 4
ARTICLES
Transitioning to edTPA: A Middle Grades Teacher Education Program Looks Back and Ahead 5
Stacie Pettit, Ph.D., Augusta University Terri L. Duncko, Ph.D., Augusta University
Assessing and Overcoming the Barriers Impeding Inquiry Based Education 21 Kaitlin S. Shurts, B.S., Miami University
Improving Teaching Practices of STEM Teachers: 40
The Teacher Synergistic Institute in Warren County Jennifer Blue, Ph.D, Miami University
Lana Rucks, Ph.D., The Rucks Group
Charles Setterfield, M.Arch., Sinclair Community College
Understanding the Decision Making of First Year Teachers in Ohio
Regarding Literacy Instruction and Policy 60
Amy Mullins Ph.D.,, Bluffton University
Kathryn Ohle,, Ph.D., University of Alaska, Anchorage Andrew Huddleston, Ph.D., Abilene Christian University
New Trends in Marine Science Teaching: Leveraging Ocean Literacy Principles
As a Framework for Delivering Concept Learning in a Cyber-Driven Classroom 71 Gwynne S. Rife, Ph.D., University of Findlay
Jon Brasfield, Ph.D., University of Findlay
Publication and Manuscript Guidelines 92
Important Dates of Note 93
A MESSAGE FROM THE EDITORS
Welcome from the The OHIO Journal of Teacher Education Editorial Team. We are honored and privileged to shepherd this journal for the educational community of Ohio
The OHIO Journal of Teacher Education (OJTE) is an online journal We invite all forms of article formats, as seen in the publication and manuscript guidelines included inside the journal. However, we do invite authors to utilize the online format. The use of links and other interactive devices will allow the online journal to be more than simply a pdf of articles that you can print at your own
workstation. In the future, the hope of the editorial team is to develop a truly functional online journal experience which can open the world of practice to our readership.
We will strive to build upon the solid foundation left by the previous editorial teams and move the OHIO Journal of Teacher Education forward as a resource for pre-service teachers, in-service teachers, and all with an interest in teacher education.
EDITORIAL BOARD
Michele Beery, Ph.D.
Wilmington College
Cynthia Bertelsen, Ph.D.
Bowling Green State University
Sue Corbin, Ph.D.
Notre Dame
College of Ohio
Joy Cowdery, Ph.D.
Muskingum University
Todd Hawley, Ph. D.
Kent State University
Stacey Pistorova, Ph.D.
Heidelberg University
Carol Ramsay, Ed. D.
Lake Erie College
Linda Ingling Rogness, Ph.D.
Muskingum University
Marlissa Stauffer, Ph.D.
Ohio Dominican University
Nicole Williams, Ph. D.
University of
A CALL FOR EDITORIAL BOARD
MEMBERSHIP
The Ohio Journal of Teacher Education (OJTE) is looking for interested individuals to join the Editorial Board of the journal. We are looking to establish a board that represents the Colleges and Universities of Ohio as well as offers a broad spectrum of
content expertise.
If interested, please submit a one page letter of intent that includes your College or University, your educational background, and your content area of interest
to the co-editors.
Dr. Mark Meyers and Dr. Jean Eagle at
OJTE – FALL 2016
TOPIC HERE
Transitioning to edTPA: A Middle Grades Teacher Education Program
Looks Back and Ahead
Stacie Pettit, Ph.D., and Laura Rychly, Ed.D. .
.
* Correspondence:
Dr. Stacie Pettit. Augusta University Department of Teacher Education
523 Mauldin Dr Evans, GA 30809 [email protected] 706-294-9136 Full list of author
information is available at the end of the article
Abstract:
States around the nation are in the process of adopting or implementing a new teacher performance assessment, edTPA, into their requirements for new teacher certification. Part of the transition from in-house to off-site assessment should entail faculty in these teacher preparation programs learning how to translate between evidence in the assessment portfolios and the language on the local evaluation rubrics. This study uses qualitative and quantitative evidence to inform best practice for teacher preparation by sharing and discussing data on whether or not local evaluations in one Department of Teacher Education differed from those assigned by SCALE.
INTRODUCTION
States around the nation are in the process of adopting a new
Teacher Performance Assessment, known as edTPA, into their requirements for new teacher certification. edTPA is a nationally available performance assessment used to measure novice teachers’ readiness to teach. It is designed with a focus on student learning and principles from research and theory (SCALE, 2015). Teacher preparation programs have, for a long time, been required to demonstrate that their beginning teachers meet standards established by professional groups such as the Center for the Accreditation of Educator Preparation (CAEP, formerly National Council for
Accreditation of Teacher Education, NCATE). Many institutions
accomplished this by having student teachers compile an exit portfolio, the requirements for which aligned with program outcomes that had been defined by the individual teacher preparation programs and defended to the accrediting body. These portfolios were graded in-house, by each student teacher’s university supervisor. The new edTPA is graded off-site by scorers trained by the Stanford Center for Assessment, Learning and Equity
OJTE – FALL 2016
Not surprisingly, the literature reflects a mixed response to edTPA. Some welcome a
standardized, high-stakes, externally-scored assessment for new teachers because there is a sense
that this will finally help the field extract neutral elements of “good teaching” that work anywhere,
with any K-12 learners (Peck, Singer-Barella & Sloan, 2014, Darling-Hammond, 2012). Once these
elements have been proven to be the ones that lead to universal achievement, then it will be an easy
next step to ensure all new teachers experience training programs that understand and inculcate these
well. Others resist an assessment system that looks all-too familiar in the ways that it resembles the
high-stakes tests that have been a part of every public school child’s life since No Child Left Behind
mandated that all students would be on grade level by 2014 (Sandholtz & Shea, 2012). Such an
emphasis “artificially decontextualizes teaching practice and encourages candidates to ‘teach to the
test’” (Dover, Schultz, Smith & Duggan, 2015). This resistance claims that it is unreasonable to
impose a one-size-fits-all assessment instrument on teacher candidates who teach diverse student
populations in diverse places (Sato, 2014; Au, 2013; Madeloni & Gorlewski, 2013). Another vivid
concern about edTPA is its relationship to the Pearson corporation, as it is difficult to trust a
corporation to keep local, public contexts at the heart of its private decisions and actions (Au, 2013).
We believe that part of the transition to a standardized, externally-scored assessment should
entail faculty in these teacher preparation programs learning how to make connections between the
language of the rubrics and evidence in the assessment portfolios. Historically, as can be seen from a
response to the standardized testing movement that resulted from No Child Left Behind, assessments
of this type cause educators to feel simultaneously frustrated and obligated to "teach to the test,"
because, while we want to retain autonomy over our content and methods, we ultimately want our
OJTE – FALL 2016
in this space of simultaneous frustration and obligation there is much room for growth, as those who
work to prepare new teachers adopt the new, standardized edTPA.
Our state adopted edTPA and made it consequential for new teacher certification as of fall,
2015. For two years leading up to this new circumstance, faculty at our institution began receiving
training on the assessment, its accompanying rubrics, and edTPA-specific jargon (such as the phrase
“language function” as a name for the verb from a lesson’s learning objective). We were not
permitted to use the 5-point rubrics that official edTPA scorers use, but Pearson made available
condensed 3-point versions that we could use to practice scoring portfolios completed by our student
teachers. This scoring practice is referred to as “local evaluation.” As a result of the opportunity we
had been given to locally evaluate portfolios several semesters before the state would hold
candidates responsible for their scores, we designed a study to compare the local evaluation results
to the official scores assigned by SCALE. The purpose of this study was to gather data on whether or
not the local evaluations differed from those assigned by SCALE and, in cases where there were
differences, identify possible reasons why these discrepancies exist. Faculty in the Department of
Teacher Education were asked to share their findings after they compared the scores they assigned to
teacher education candidates’ edTPA portfolios to the scores assigned by the official scoring agency
SCALE. Our results could be used to inform revisions to our middle grades teacher education
program and/or curriculum, if needed.
This study uses qualitative (and some quantitative) evidence to inform best practices for
teacher preparation. The act of requiring faculty to evaluate students on a high-stakes assessment for
which faculty will be preparing students is an exemplary practice. All institutions using edTPA
OJTE – FALL 2016 Looking Back: Best Practices Prior to edTPA
How were high standards for new teachers’ knowledge and skills being met before the
transition to edTPA? As it turns out, at the particular university in this study, educating pre-service
teachers was going well. NCATE accreditation was received with “no improvements needed” just a
year before edTPA implementation. Teacher candidates were already required to complete a
performance assessment evaluating their teaching effectiveness called the Impacting Student
Learning (ISL) portfolio. The ISL portfolio provided evidence that candidates had developed into
new teachers shaped by our conceptual framework: Prepared, Able, and Responsive. Interestingly,
this assessment did address many of the same elements as edTPA now has in its rubrics. The ISL
contained five sections: Context, Classroom Management, Pre-assessment, Lesson Plans, and
Analysis of Student Learning. edTPA requires three tasks: Task 1 Planning, Task 2 Instructing, and
Task 3 Assessing. Table 1 shows which sections of the ISL accomplished which task of edTPA and
how both fit under our conceptual framework.
Table 1
Conceptual Framework
Prepared Able Responsive
Impacting Student
Learning portfolio
Sections 1-4:
Context, Classroom
Management,
Pre-assessment, Lesson
Plans
Section 5: Analysis
of Learning
Section 5: Analysis
of Learning
OJTE – FALL 2016
Comparing the work required of student teachers by both projects helped us to understand the
differences between what we were already asking them to do and what they are now being asked to
do. Four of the five sections of the ISL focused on context and planning, including a large emphasis
on quantitative pre-assessment data on middle grades students’ existing knowledge and/or skills
related to the planned unit objectives and an entire section on a classroom management plan. edTPA
expects student teachers to plan responsive “learning segments,” and asks for a description of middle
grades students’ existing knowledge and skills, but student teachers are not asked to provide an
administered pre-assessment. Only one-third of the edTPA is devoted to what made up four-fifths of
the ISL. The remaining two-thirds of the edTPA were previously addressed in the final fifth of the
ISL. This shift means that our prior emphasis was on the process of collecting and documenting
evidence of learners’ needs and then planning lessons that accounted for these needs, while edTPA
places more equal emphasis on pre-instructional planning, instruction itself, and post-instructional
feedback and reflection.
Perhaps the biggest difference between the two projects is that the edTPA requires student
teachers to submit video evidence of their instruction and interactions with students, and students’
experiences with the content. Student teachers write responses to prompts that ask for specific
evidence, from the video, of required knowledge and skills for new teachers (as defined by the
assessment). We feel this is an improvement to traditional teacher education practices that perhaps
needed a little push toward this sort of innovation in order to shorten the distance between our
university classrooms and the public school classrooms. Also, while we recognize this point of
contention in our field, the fact that the portfolio is externally scored by strangers, and that
OJTE – FALL 2016
file names), could potentially add a level of professionalism and accountability that will benefit the
profession.
The Transition: Training and Data Collection
We first began to understand the impact the edTPA would have on our graduates in the fall
of 2013. Faculty began to attend training sessions in December of this semester. In spring of 2014,
faculty attempted to address edTPA requirements in courses by adding new assignments or revising
existing ones to include some of the language as described above and the skills needed for
videotaping lessons. A number of student teachers completed edTPA as part of their requirements
for graduation by substituting this portfolio for the regularly-required ISL. Twelve portfolios were
sent to Pearson for scoring. Two or three faculty members (working independently) used the local
evaluation (3-point) rubrics to assess each submission. Early in the fall 2014 semester, after official
scores from SCALE were received, faculty teams reviewed both sets of scores on the portfolios,
discussed discrepancies, and compared the scores they gave to the the ones SCALE gave.
In fall of 2014, some modifications to edTPA related coursework were made, and all student
teachers completed edTPA (none completed the ISL). Of these, 15 portfolios were sent to Pearson
for scoring. Each semester, 19 faculty members scored portfolios using the 3-point local evaluation
rubric provided by SCALE. Faculty meetings were held to compare local evaluations to official
SCALE scores. In the fall of 2015, edTPA became consequential, which means all teacher
candidates must pass in order to earn teacher certification from our state.
Lessons Learned: Intentions Versus Reality of Our Study
The fact that we had four semesters of preparation time before our candidates would have to
pass edTPA to earn teacher certification meant that we had a big opportunity to gather data on
OJTE – FALL 2016
results that we assigned. We composed a short survey to give faculty after they had been able to
compare these two scores. The survey consisted of two open ended questions and two closed
questions that asked if a discrepancy existed, how surprised the local scorer was in the difference or
lack of difference in scores, and what he or she believed was the cause of the discrepancy. Survey
results were read, and themes and unique ideas were highlighted. We also looked at scores submitted
both by teacher education faculty and SCALE and provided some descriptive statistics concerning
how closely the local evaluation matched with the SCALE scores.
In some areas, the local evaluators scored students higher (58%), and in some areas the local
evaluators scored lower than the official scorers. When asked about discrepancies, 11 participants
reported that discrepancies existed, and six reported that there were no discrepancies. As for how
surprised local scorers were in the official scores, the answers ranged as follows: Three were “very
surprised,” two were “somewhat surprised,” and six were “not surprised” by discrepancies.
Based on the qualitative survey data, two main themes emerged: (1) Faculty are not sure they
are interpreting the language of the rubrics in the same way as SCALE and (2) Faculty feel their
expectations and those of the official scorers are different. The general impression of the local
scoring was that the whole process is very subjective because the two scorers are grading on
different scales. Participants said that the people at Pearson have been professionally trained to
score, and they have not. The participants write that they would never agree with the official SCALE
scorers, so that leads to differences between the fundamental philosophical directions from which we
are coming. Interesting quotes from local scorer participants are included in the list below. These
statements represent the themes concerning differing expectations and training levels.
● The process was a piece of cake. I don’t understand why some people made a big
OJTE – FALL 2016 ● It would be helpful if we were trained from Stanford.
● We were more demanding than those from CA.
● My expectations were too high compared to SCALE.
● I did not understand the tasks and did not understand the student’s explanations as
well as I thought I did.
● Grading constructed responses is subjective.
● We aren’t professionally trained.
● We have different perspectives; we will never agree.
● I don’t like that we have to send them away; it implies that we aren’t qualified.
Limitations
Over the course of our study we encountered a few challenges that in some ways
limited the conclusions we are able to draw. First, we only had a 50% response rate on our survey.
We feel this makes sense given the sentiments shared in statements such as those included above. It
is unknown, however, whether the 50% who didn’t reply would have contributed a more positive
outlook on the shift to edTPA, or did or did not encounter larger or smaller scoring discrepancies. A
second challenge occurred in the fact that the two sets of rubrics being compared used different
scales (SCALE uses a 5-point rubric, and we were provided with a modified 3-point version). In an
attempt to make comparisons, we converted SCALE scores to the 3-point scale used for local
evaluation in this way: 1’s and 2’s = 1, 3 = 2, 4’s and 5’s = 3. A third unforeseen challenge, related
to the above scale differences, is that an occasional official score came back as a “.5.” This further
OJTE – FALL 2016
Where We are Now: How Data was Used to Inform Program Changes
Our first response, as we anticipated the point at which our student teachers’ edTPA
scores would be consequential for certification, was to embed whole edTPA-like tasks into the
courses we believed would provide the best practice with those concepts. For example, we added
two projects to our general curriculum planning course, one that resembled the edTPA planning task
(Task 1) and one that resembled the instructing task (Task 2). An assignment that addressed
knowledge and skills required for the assessing task (Task 3) was created for our assessment and
differentiation course. One way these assignments took shape was by modifying some of the
language from edTPA rubrics that dealt with content in a particular course, modifying it, and scoring
students on a three-point scale on how well they addressed the criteria. For instance, we might write
“Teacher candidate justifies lesson plan changes using principles of research and/or theory” (rubric
10) on a class assignment scoring guide for a written reflection on a lesson plan taught in a field
experience classroom.
Embedding whole tasks this way proved to be quite cumbersome. For one thing, each
course already had appropriate assignments that instructors had to decide to keep, modify, or replace
with the new assignment. Secondly, there was a general sense of displeasure about what felt like
“teaching to the test.” Additionally, putting two tasks in one course was very overwhelming for both
faculty and students, especially because one of these two involved the video recording project, and
this involved a lot of new learning for all involved. As we began to receive official scores, we have
been able to more strategically embed work that gives candidates practice with knowledge and skills
OJTE – FALL 2016 Looking Ahead: Data Driven Program Improvement
Our practice with edTPA so far has provided, as several promised it would, evidence of
opportunities to refine, and in some cases create, experiences for our candidates that will better
explicitly prepare them to write strong commentaries, design and teach effective lessons, and plan
for learners to apply formative feedback. We describe here three ways we have modified coursework
to best maximize its potential to expose our candidates to edTPA concepts and provide them with
meaningful practice. These are 1) providing formative feedback and 2) using the language of edTPA
in peer and faculty observations of lab teaching.
“Glows and Grows”
Across our programs, we are working on candidates’ abilities to provide objective-based
feedback on formative assessments. For example, in instances where the following activity has been
a good fit, primarily in content methods courses, Laura has implemented an assignment that asks
teacher candidates to observe one another teaching and give objective-based feedback. The objective
against which the candidates are looking for strengths and weaknesses comes from standards set by
professional organizations such as the National Council for the Social Studies (NCSS). NCSS has a
document, as do all of the national content organizations (National Council for Teachers of
Mathematics, National Council for Teachers of English, and National Science Teachers
Association), that provides standards for what quality teaching of the particular discipline would
“look like” or entail. The NCSS document “National Standards for Social Studies Teachers,” in the
section on “time, continuity, and change,” stipulates that teachers should “guide learners in exploring
characteristics, distribution, and migration of human populations on Earth’s surface” (NCSS, 2002,
OJTE – FALL 2016
behavioral objective that teacher candidates, as they learn to achieve this standard, can clearly meet.
This objective might read something like: “Teacher candidates will be able to make connections
between the causes of human migration and the places to and from which this migration takes
place.” Translating the standard into an objective in this way is useful practice for being able to do
this in candidates’ own lesson planning. Additionally, and more importantly in the context of
edTPA, when candidates take their standard-based objective with them into their peer’s classroom
and note strengths and weaknesses that pertain directly to this objective, they are practicing the kind
of specific, objective-based feedback that they are expected to provide to their own learners in Task
3 (and Task 4 for elementary teacher candidates). Our intention is for this to phase out the kinds of
feedback we are used to seeing, i.e. “Good job!,” “Nicely done!,” “Uh oh, better try harder next
time!” and instead germinate reflexive skills for creating feedback that will help K-12 learners
recognize what they can do well related to specific learning objectives and approach their struggles
from these strengths. Generic teacher-responses such as the ones identified above do not help
learners build on what they can do well, and do not meet expectations as set forth by edTPA.
Observations of Teaching
Candidates in our program have at least two, and usually three, opportunities to teach and
receive feedback prior to student teaching. This is because they are given a lab placement each
semester upon admission to the program, and all courses have lab requirements. Each candidate is
assigned to a university supervisor who conducts at least one formal observation of teaching during
lab weeks. Also, coincidentally, we are in the process of transitioning our program into a
Professional Development School model. One significant difference this creates for our candidates is
OJTE – FALL 2016
candidates stay together at one school for lab weeks. Given this, we have begun requiring candidates
to observe a peer at least once per semester.
We recently began revising our observation feedback form to better reflect the
language candidates will have to be able to think in when they write their edTPA commentaries. For
example, most elements associated with classroom management can be written about under an
edTPA prompt that asks how a positive learning environment, respect, and rapport were established.
Where our previous feedback form listed “Classroom Management” as a category for feedback, our
new form says “Candidate demonstrates rapport with and respect for his/her students.” It is our
belief that after receiving feedback in this way a minimum of two times per semester prior to student
teaching, candidates will be more fluent than they otherwise would have been without reading
feedback organized in this way. This is doubly true given that, not only does each candidate receive
this feedback to read and internalize for him/herself, but because faculty and candidates are using the
same form to give feedback, candidates will have to think in these terms in order to write feedback
for their peers, too.
New Identified Opportunities
As faculty continue to become more familiar with the new edTPA requirements, new
questions and ideas are discovered. For example, in task 3, candidates have to articulate a plan for
how their learners will implement the formative feedback they receive. As of yet we have not
identified an assignment, or an ideal course to embed one in, that gives candidates meaningful
practice with this skill. Moreover, this is the type of requirement that, as with feedback
opportunities, seems well suited for faculty to model for candidates. Over the course of a semester
candidates could experience a well-designed example of receiving, and then understanding a plan for
OJTE – FALL 2016
candidates could reflect on what difference it made for their learning and how they could see
themselves doing the same thing with middle grades learners. A project such as this could have
powerful implications for new teachers’ ability to coach their learners by using formative feedback
effectively and purposefully, and it is our aim to embed such a project in one of our courses.
Another opportunity that has emerged is due to alignment between the knowledge and
skills sought by the edTPA and those new teachers are held accountable for on our state’s teacher
evaluation form, or Teacher Keys Effectiveness System (TKES). The TKES evaluation has ten
standards, most of which are locatable somewhere in the fifteen rubrics for edTPA. For example,
two of the TKES standards are “positive learning environment” and “academically challenging
learning environment.” These concepts are sought by the sixth edTPA rubric, which looks for a “safe
and respectful learning environment that supports young adolescents’ engagement in learning.”
Given our emergence into a PDS as described above, opportunities might exist for candidates and
their cooperating teachers to look together at their respective evaluation instruments to look for
similarities that might share different labels, or themes that both supervisory organizations have used
to define good teaching. This sort of “heads together” collaboration for the purposes of mutual
growth are exactly what accreditation bodies (such as CAEP) are looking for in teacher preparation.
Conclusion
edTPA is a new, standardized assessment that all teacher candidates in our state must
successfully complete in order to begin their teaching careers. Because it is a new assessment, many
questions exist about how well current practices will align with new expectations. Our faculty and
candidates were fortunate to have opportunities to send practice portfolios away for official scoring.
OJTE – FALL 2016
and weaknesses. Exploring the perceptions our faculty had about the causes of discrepancies
between the scores they assigned to edTPA portfolios and official scores received from SCALE
helped us target changes to our program to best prepare our candidates for this new assessment.
Seeking the insight of faculty who teach the courses that prepare teacher candidates to
successfully complete this assessment helped us uncover important data about how well the
assessment aligns with what teacher education faculty believe new teachers should know and be able
to do. We recognize that the absolute value of edTPA as being a positive or a negative addition to
teacher preparation is indeterminable, at least at this time. In our state, however, the assessment is a
reality, and we certainly want our students to do well. Over future semesters, we will continue to use
candidates’ scores to identify what we are doing well and what we should strengthen, in the context
OJTE – FALL 2016
REFERENCES
Au, W. (2013). What’s a nice test like you doing in a place like this?: The edTPA and corporate education “reform.” Rethinking Schools, 27(4).
Darling-Hammond, L. (2012). The right start: Creating a strong foundation for the teaching career. Phi Delta Kappan, 93(3), 8-13.
Dover, A. G., Schultz, B., Smith, K. & Duggan, T. J. (2015). Who’s preparing our candidates? edTPA, localized knowledge and the outsourcing of teacher education. Teachers College Record. Retrieved from http://www.tcrecord.org ID Number: 17914
Madeloni, B. & Gorlewski, J. (2013). Wrong answer to the wrong question: Why we need critical teacher education, not standardization. Rethinking Schools, 27(4).
Peck, C. A., Singer-Gabella, M., Sloan, T., Lin, S. (2014). Driving blind: Why we need standardized performance assessment in teacher education. Journal of Curriculum Instruction, 8(1), 8-30.
Sandholtz, J. H. & Shea, L. M. (2012). Predicting performance: A comparison of university supervisors’ predictions and teacher candidates’ scores on a teaching performance assessment. Journal of Teacher Education, 63(1), 39-50.
Sato, M. (2014). What is the underlying conception of teaching in the edTPA? Journal of Teacher Education, 65(5), 421-434.
OJTE – FALL 2016 About the Authors:
Contact Author:
Stacie Pettit, Ph.D. Augusta University
Department of Teacher Education email: [email protected]
Business phone: 706-667-4500 Cell phone: 706-294-9136
Mailing address: 523 Mauldin Dr., Evans, GA 30809 Laura Rychly, Ed.D.
Augusta University
Department of Teacher Education
Stacie K. Pettit is an Assistant Professor of Teacher Education at Augusta University. She has 15 years experience as a middle school (ESOL, mathematics, English Language Arts, and gifted) teacher and college professor. She received her Ph.D. in Middle Grades Education from The University of Georgia. Her research interests include teaching English Language Learners in mainstream middle school classrooms and using social media in education. [email protected]
@PettitStacie
OJTE – FALL 2016
TOPIC HERE
Assessing and Overcoming the Barriers
Impeding Inquiry Based Education
Kaitlin S. Shurts
.
* Correspondence:
Kaitlin S. Shurts. Miami University 4015 Benjamin St. Cincinnati, Ohio 45245
[email protected] 513-947-7400 Full list of author
information is available at the end of the article
Abstract:
This case study aims to 1) assess the relationship between teachers’ conceptions of inquiry and the number of perceived inquiry barriers and 2) provide solutions to overcome the inquiry barriers perceived by teachers in the case study. Though no relationship was discovered there were important trends in the concepts and barriers analyzed. Perceived inquiry barriers can prevent teachers from implementing inquiry using the barriers as evidence for why the methodology is not effective. It is essential that teachers are provided professional development
opportunities to overcome the barriers of inquiry in order to provide students with authentic learning experiences.
INTRODUCTION
The drive for an educational revolution stems from Paulo Freire’s call for students to have a voice in their education, rather than the typical teacher-directed education which deposits recall knowledge into the “bank” known as students’ brains (Freire, 1970). Morrison (2014) states that throughout the United States, high school teachers are expected to move away from just depositing information and instead implement inquiry into the science curriculum as required by the National Science Education Standards and the Ohio Department of Education.
OJTE – FALL 2016 Morrison (2014) states it is essential for inquiry to be authentic to students. This means students’ questions and investigations should be derived from their own personal experiences while their teachers are merely acting as a facilitator (Myers, Myers, & Hudson, 2009). The scientific
processing skills (Ergul et al., 2011) and problem solving skills students develop when immersed in authentic inquiry are beneficial to their lives (Burton & Frazier, 2012). These skills aid in the development of becoming participatory citizens by making personal and politically-based decisions (Hart, 1997); further preparing students for life outside of high school and life in the real word.
Levels of Inquiry
There are four different levels of inquiry which can be embedded into science investigations ranging from closed to open inquiry such as: confirmation, structured, guided, and open-ended (Mumba et al., 2010). Confirmation inquiry is the lowest level of inquiry as it is a teacher centered approach in which students follow cookbook procedures to complete a science investigation (Gengarelly & Abrams, 2008). Open-ended inquiry is the highest level of inquiry as it is a student centered approach in which students develop the investigation, methods and form conclusions based on data analysis with the teacher as a facilitator (Gengarelly & Abrams, 2008).Hart (1997)
illustrates that the highest level of student participation is achieved when students initiate their own research and share the responsibility of decisions in learning with the teacher in the classroom consistent with open-ended inquiry.
Issues with Inquiry Education
OJTE – FALL 2016
classroom. Barriers such as: standardized testing, availability of resources, lack of time, student incapability, loss of classroom management, and lack of professional or personal inquiry
experiences.
These inquiry barriers can alter a teacher’s conception of inquiry resulting in the
abandonment of inquiry based teaching in high school classrooms. Ozel & Luft (2013) suggest that a direct correlation exists between teachers’ conceptualization of inquiry and its implementation in the classroom. Evidence from Ozel and Luft (2013) year long study showed that science teachers with closed inquiry conceptions also practice closed inquiry instruction in the classroom with little growth during the school year. This paper aims to review the barriers of inquiry that impede its
implementation by describing a case study I conducted in 2015 assessing conceptions of inquiry based teaching.
Methods
In order to investigate the impact of teachers’ inquiry conceptions and inquiry
implementation in secondary science education, quantitative data was collected in the form of questionnaires. This case study aims to determine whether a relationship exists between teachers’ conceptions of inquiry and the number of inquiry barriers perceived in the classroom. It is expected that the more negative the conceptions of inquiry the more inquiry barriers will be perceived and the more positive the conceptions of inquiry the fewer inquiry barriers will be perceived.
Population and Sampling
The investigation was conducted in a school district located in southeast Cincinnati, Ohio in collaboration with two suburban public high schools, with a population consisting of secondary educators. A total of 120 teachers provide services to students while 17 teach science as a core subject. The grade levels and subject taught by each science teacher are dependent on certification and course content availability.
Participants
OJTE – FALL 2016 teachers participated in the quantitative portion of the investigation through completion of an online survey while zero teachers volunteered to participate in the qualitative portion of the investigation, classroom observations; therefore the classroom observation methods was omitted from the paper and no qualitative data was gathered.
Data Collection
The first objective of the investigation was to measure teachers’ conceptions of inquiry by dispersing a survey based questionnaire to collect quantitative data. The science teachers were given the survey electronically through Google forms. The survey consists of 29 items, in which 20 used a 5-point Likert scale with the following options: 1) Strongly Agree, 2) Agree, 3) Neutral, 4) Disagree, and 5) Strongly Disagree. The key features of inquiry were reworded to form the 20 likert questions in the survey distributed to the science teachers. These questions were created from and used to measure participants’ conceptions of inquiry using the “essential features of classroom inquiry and their variations” rubric adapted from the National Research Council (NRC) (2000) (Appendix A). One question allows survey participants to quantify the barriers that impede inquiry-based education, which was used to assess possible explanations for negative inquiry conceptions (Koballa, Dias, & Atkinson, 2009). Of the remaining questions, one question identifies consent for participation, six questions gather demographic information, and one is open ended for comments regarding inquiry.
Analysis
The “essential features of classroom inquiry and their variations” rubric (NRC, 2000, p. 29) was utilized to assess survey responses to identify each teacher’s conceptions of inquiry. Each block from the “essential features of classroom inquiry and their variations” rubric (NRC, 2000)
OJTE – FALL 2016
Science teachers with a positive conception of inquiry would agree with the statements under variation A and variation B of the “essential features of classroom inquiry and their variations” rubric (NRC, 2000) while disagreeing with more statements under variation C and variation D. Science teachers with a negative conception of inquiry would agree with the statements under variation C and variation D of the “essential features of classroom inquiry and their variations” rubric (NRC, 2000) while disagreeing with more statements under variation A and variation B.
Results
Conceptions of Inquiry. Seven teachers responded to the survey administered to the 17 teachers in the science department. Four of the seven were females while the remaining three were males. Due to the zero participants for classroom observations, only the survey was used to evaluate the conceptions of inquiry.
During the analysis of each Likert question, some of the teachers agreed with multiple statements for each key feature of inquiry indicating support of multiple variations of inquiry. In this case, any statement in which a teacher strongly agreed negated all other agreed upon statements. A teacher’s conception of inquiry was determined based upon how many strongly agreed or agreed upon statements there were per each variation of the “essential features of classroom inquiry and their variations” rubric (NRC, 2000). According to this analysis method, there were: five teachers with conceptions aligning with variation A, open inquiry; one teacher with conceptions aligning with variation C, structured inquiry; and one teacher in which the results were inconclusive because all responses were in agreement with each statement of the “essential features of classroom inquiry and their variations” rubric (NRC, 2000).
Table 1: The Variations of Inquiry and Teachers’ Conceptions
Variations of
Inquiry Teacher 1 Teacher 2 Teacher 3 Teacher 4 Teacher 5 Teacher 6 Teacher 7
A (Open) x x x x x
B (Guided)
C (Structured) x
OJTE – FALL 2016 Three teachers offered comments when asked if there are other thoughts or feelings regarding inquiry that was not targeted in the survey. Teacher 1 stated, “[inquiry is] a time consuming
technique and we need to spend lots of time to teach the students this strategy from the grade school all the way to high school.” Teacher 3 discussed the implementation of inquiry as independent subject dependent stating, “In chemistry, it is much more difficult to allow the students’ to pose his/her own questions to test and give them the freedom to work with chemicals. Through guided experiments, they still have freedom to collect and process data. [Students] still need to be able to analyze the data and draw conclusions based on scientific evidence.”
Teacher 4 identified the same concern as Teacher 1 in which students lack the practice needed to understand and complete inquiry activities. Teacher 4 states,
“I find that students do not have enough "practice" learning through inquiry to fully implement this style of teaching in my classroom. While I frequently use POGIL (Process Oriented Guided Inquiry Learning) assignments to begin units, as far as laboratory activities go, inquiry-based learning can be a challenge. Students do not know where to begin or how to continue when presented with a true inquiry lab. It is my experience that most students even have great difficulty following a "cookie-cutter" laboratory activity where procedures are fully communicated in the lab procedure. My honors students, though, seem to do better when asked to manipulate a lab variable or create their own experiment. Consequently, I think the biggest barrier to inquiry implementation is low-performing students (and lack of experience).”
The reflections from Teachers 1, 3, and 4 indicate that despite the analysis of each survey using the “essential features of classroom inquiry and their variations” rubric (NRC, 2000) negative
conceptions of inquiry are still present in two of the five teachers considered to have conceptions that align with variation A, the most student centered variation. Teacher 7, one of the three remaining teachers in variation A, holds a more positive conception of inquiry stating, “Inquiry-based teaching is a wonderful approach to student-centered learning.” However, teacher 7 recognizes that there are barriers in place that can prevent a teacher from always using inquiry stating, “a
teacher must cover a specific amount in content in a given amount of time, it becomes difficult to devote the time to the process.”
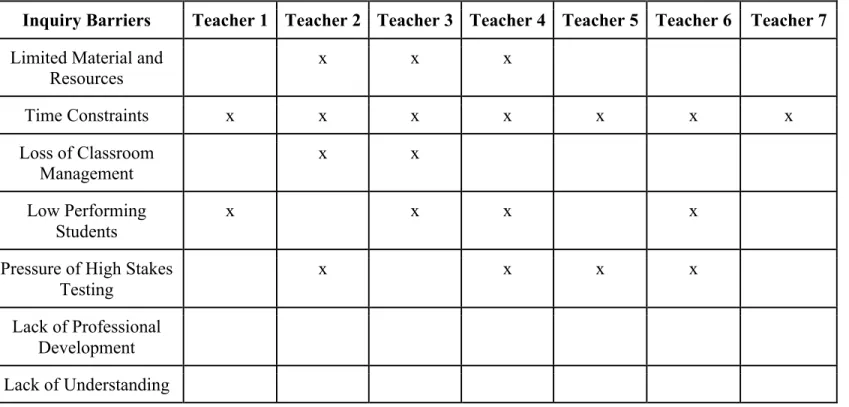
Barriers of Inquiry
OJTE – FALL 2016
results in a correlation between the number of inquiry barriers and conceptions of inquiry. Table 2 illustrates each teacher’s perceived barriers to inquiry. It is evident from the data table that all seven teachers perceive time constraints as a barrier to the implementation of inquiry and all seven teachers do not perceive that the reason inquiry is not implemented in science classroom is due to the teachers inability to understand how to implement inquiry or the lack of professional development regarding inquiry based teaching. It is also important to note that Teacher 7, who provided the most positive and open conception of inquiry due to the comments on the open ended portion of the survey, only noted one barrier, time.
Table 2: Perceived Barriers Implementing Inquiry in the Science Curriculum
Inquiry Barriers Teacher 1 Teacher 2 Teacher 3 Teacher 4 Teacher 5 Teacher 6 Teacher 7
Limited Material and Resources
x x x
Time Constraints x x x x x x x
Loss of Classroom Management
x x
Low Performing Students
x x x x
Pressure of High Stakes Testing
x x x x
Lack of Professional Development
Lack of Understanding
Discussion
Barriers of Inquiry Based Education
OJTE – FALL 2016 summer. Workshops were provided throughout the school year and teachers were observed twice during the academic year yet the teachers considered to have more negative conceptions of inquiry, stated that lack of time and materials prevented them from using inquiry in their classrooms
throughout the year (Lotter et al., 2013). This claim is supported by Morrison (2014) who conducted a similar study in which participants frequently mentioned time as a constraint as well as limited materials for students to use to continue exploring concepts following lessons.
Classroom management
Two of the seven teachers found classroom management to be a barrier for inquiry implementation. Many teachers fear that using inquiry means losing control over classroom management (Gengarelly & Abrams, 2008). This was expressed by a teacher in Morrison’s study (2013), who stated that she loses complete control over the class when allowing students the freedom to explore content further through inquiry. However, Morrison (2013) notes that the teachers in her study most afraid of classroom management issues were the teachers that implemented the least inquiry in the classroom.
Low academically performing students
Four teachers of seven found low academically performing students as a barrier for
OJTE – FALL 2016
Pressure of high stakes standardized testing
At a National Science Teacher Association Convention in Georgia, session leaders recognized that increased high stakes testing is a common barrier preventing teachers from implementing inquiry (Koballa, Dias, & Atkinson, 2009). Four of the seven teachers in this case study agreed that high stakes testing was a barrier of implementing inquiry. High stakes testing creates pressure on teachers and administrators as state funding is allocated and statutory accreditation is based upon student’s tests scores (Geier et al., 2007) resulting in teacher directed instruction, termed “teach to test” to raise test scores rather than achieve content understanding (Blanchard et al., 2010). A teacher in Morrison’s study (2013) stated that inquiry uses more time and limits the amount of content covered per lesson, placing them behind the district curriculum pacing guide for end of the course exams. Even teachers considered emerging enactment teachers, a higher conception of inquiry, in Lotter, Rushton, and Singer’s (2013) study, feared meeting the standards required for high stakes tests, suggesting that high stakes testing worries teachers who are successfully implementing inquiry and thwarts other teachers from trying to implement it.
Lack of professional development and scientific inquiry understanding
A review of the 10 most highly recognized government-based reports on inquiry as education reform by Burton and Frazier (2012) revealed that teachers need year round support in the
implementation of inquiry based teaching methods. Similar results were founded from the review of the NSTA session leaders; 50% of the session leaders noted that teachers are inexperienced with inquiry and therefore are uncomfortable teaching inquiry, ultimately ignoring inquiry based teaching methods in the classroom (Koballa, Dias, & Atkinson, 2009). To implement inquiry, teachers must overcome a series of obstacles such as: the addition of a new teaching role, content knowledge, and skills (Jones & Eick, 2007). Without professional development and ongoing support throughout the academic year inquiry teaching methods are often ignored due to the teacher’s lack of comfort. Comfort levels continue to decline when teachers experience a lack of support and understanding from the administration level, jeopardizing teacher’s confidence in trying a new teaching method such as inquiry (Morrison, 2013).
OJTE – FALL 2016 in this case study thought they lacked the professional development or understanding as a barrier impeding the implementation of inquiry based instruction. A study by Kazempour (2009) found that teachers needed effective inquiry-based professional development opportunities to affect the
conceptions of inquiry-based teaching and increase its implementation in the classroom. None of the seven teachers in this case study thought they lacked the experience or
professional development needed to implement inquiry. Is it possible that teachers think they have the experience needed to implement inquiry or do teachers not want to admit that they lack the experience needed to implement inquiry? Or did previous professional development sessions address the barriers of inquiry and provide solutions for how to overcome those barriers to effectively
implement them?
Overcoming Barriers of Inquiry Low academically performing students
It is possible that the first time a teacher tries inquiry in their classroom that it is the first time the students have been exposed to this teaching method. Hart (1997) urges teachers that it takes time to shape and develop students to successfully implement inquiry as noted by his hierarchical ladder of organizational principles defining the levels of student participation. Heppner, Kouttab, and Croasdale (2006) also suggest teachers considered developmental levels of students for at earlier levels, students cannot recognize that knowledge is experimental and the teacher is a facilitator rather than just the expert (Freire, 1970). This results in teachers avoiding inquiry, accrediting its failure to their students inability to “do” inquiry. Even though this barrier exists, Griset (2010) urges teachers to use inquiry in the classroom stating that students may not respond to it at first but after time inquiry becomes routine. Routine in any classroom creates a safe and successful environment for students to learn and grow accustomed to inquiry based teaching.
Resources and high stakes testing
Teachers can gain professional support through curriculum based programs to assist with providing inquiry learning experiences to students which are aligned with state and national standards ensuring standards are met for high stakes testing. The Center for Learning Technologies in Urban Schools (LeTUS) developed learning technologies along with supplementing curriculum design,
OJTE – FALL 2016
2007). LeTUS provided Detroit Public Schools (DPS) a series of 8- to 10-week units on air quality, water quality, and Newton’s Laws (Geier et al., 2007).
Curriculum based inquiry units along with professional development for proper
implementation provide teachers with a supportive structure and the resources needed to implement inquiry (Jones & Eick, 2007). Geier et al. (2007) conducted a three year study working with LeTUS and DPS which impacted 37 teachers and approximately 5,000 students enrolled in 18 different middle schools. Concluding each academic, year all students in DPS participated in the Michigan Education Assessment Program (MEAP), which are considered high stakes tests in the state of Michigan affecting the accreditation and funding of all Michigan Schools (Geier et al., 2007). Results compare students involved in LeTUS units to other DPS students not taking LeTUS units. Cohort 1 took the MEAP 2000 test and had a 19% increase in passing rate while Cohort 2 took the MEAP 2001 test and had a 14% increase in passing rate compared to other DPS non- LeTUS students (Geier et al., 2007).These results suggests that inquiry does not hinder high stakes testing score but increases the likelihood to pass compared to other students who lacked inquiry teaching methods. Also discredited by these results is the fact that students have to be of high performance to successfully “do” inquiry. Many of the students in the DPS district have a substantially high amount of student dropout rates and low performing at risk students.
Professional Development.
Bottom-Up Approach.The purpose of professional development is to implement ideal teaching methods to actual classroom experiences (Jones & Eick, 2007). However, many
OJTE – FALL 2016 Collaboration.An overwhelming amount of evidence suggests that professional development of inquiry methods are most successful when teachers partner with scientists, professors, curriculum programs, and other teachers. In a study conducted by Morrison (2013), high school teachers job shadowed scientists and interviewed scientists about their views pertaining to: the nature of science, science education, and the importance of students learning science. When teachers were not
observing scientists, teachers and scientists both participated in group discussions, authentic inquiry activities, and designing inquiry based lessons. Concluding the professional development summer program teachers attended follow-up workshops in which scientists would assist in small group discussion and continued a bottom-up approach of authentic inquiry activities (Morrison 2013). The comparison of Views of Scientific Inquiry (VOSI) survey supports partnering professional
development with scientists as 43% of teachers had a good, great, or outstanding view of scientific inquiry on the pre VOSI Survey moved to 100% on the post VOSI survey (Morrison, 2013).
Similar results were found in Jones and Eick (2007) where professional development programs provided opportunities co-teaching in the classroom with collaboration of a pre-service teacher, in-service teacher, and a university professor enhancing learning through inquiry activities. Results from this collaboration illustrate efficient management of the following: materials, class time, students, and complex procedures or apparatuses (Jones & Eick, 2007). The relationship between the preservice and inservice teacher enriched the scientific content of each lesson as preservice teachers had different backgrounds in education than their inservice teachers thus deepening student learning (Jones & Eick, 2007). In the current education of preservice teachers, they are encouraged to make connections to learning inquiry as a student and teaching inquiry as a teacher (Kang, Bianchini, & Kelly, 2013), which many inservice teachers lack due to changing professional development practices to meet inquiry based reform in universities. Co-teaching alleviates the perceived challenges derived from implementing inquiry and enables learning to go beyond instruction which engages students and deepens their learning (Jones & Eick, 2007).
Conclusion
OJTE – FALL 2016
methods. There are pragmatic issues that teachers face when implementing inquiry that often form barriers ceasing inquiry practices. The barriers that impede inquiry implementation can be overcome through appropriate professional development sessions in which teachers experience authentic inquiry themselves. Partnership with scientists and collaboration with co-teachers alter teachers views on inquiry and ensures the effectiveness and sustainability of inquiry teaching. When
professional development includes curriculum based resources it not only provides specific and well developed support for teachers implementing inquiry. These resources also raise high stakes test scores improving school districts’ ratings. Professional development has the opportunity to empower teachers, supporting their efforts to successfully implement inquiry without barriers to sustain
OJTE – FALL 2016
REFERENCES
Baker, C. A. (2012). Social identity theory and biblical interpretation. Biblical Theology Bulletin, 42, 129–138. doi:10.1177/0146107912452244
Beart, S. (2005). ‘I won’t think of meself as a learning disability. But I have’: Social identity and self-advocacy. British Journal of Learning Disabilities,33, 128–131.
Berkay, P. J., Gardner, J. E., & Smith, P. L. (1995). A scale for assessing hearing adults’ beliefs about the capabilities of deaf adults. Journal of the American Deafness and Rehabilitation Association, 29, 33–44.
Besley, T., & Peters, M. (2007). Subjectivity and truth: Foucault, education and the culture of the self. New York, NY: Peter Lang Publishing.
Blumer, H. (1969). Symbolic interactionism: Perspective and method. Englewood Cliffs, NJ: Prentice-Hall.
Brekhus, W. H. (2008). Trends in the Qualitative Study of Social Identities. Sociology Compass, 2, 1059–1078.
Bronfenbrenner, U. (1979). The ecology of human development. Cambridge, MA: Harvard University Press.
Bruce-Rosser, K. (2009, January 12). Circle supports deaf girls. Stonnington Leader, p. 13. Retrieved from http://www.deafchildrenaustralia.org.au/sites/
deafchildrenaustralia.org.au/files/Circle%20Supports%20deaf%20teengirls.pdf
Brueggemann, B. J. (2009). Deaf subjects: Between identities and places. New York, NY: New York University Press.
Burgess, E. W. (1925). The growth of the city: An introduction to a research project. In R. Park, E. Burgess, & R. McKenzie (Eds.), The city (pp. 47–62). Chicago, IL: University of Chicago Press.
Burke, P. J. (2004). Identities and social structure: The 2003 Cooley-Mead award address. Social Psychology Quarterly, 67, 5–15.
Cole, S. H., & Edelmann, R. J. (1991). Identity patterns and self- and teacher-perceptions of
problems for deaf adolescents: A research note. Journal of Child Psychology & Psychiatry & Allied Disciplines, 32, 1159–1165.
Cooley, C. H. (1902). Human Nature and the Social Order. New York, NY: Scribner.
OJTE – FALL 2016 Cornell, S. L., & Lyness, K. P. (2004). Therapeutic implications for adolescent deaf identity and
self-concept. Journal of Feminist Family Therapy: An International Forum, 16(3), 31–49.
Creswell, J. W. (2007). Qualitative inquiry and research design: Choosing among five approaches (2nd Ed.). Thousand Oaks, CA: Sage.
Dalton, C. J. (2011). Social-emotional challenges experienced by students who function with mild and moderate hearing loss in educational settings. Exceptionality Education International, 21(1), 28–45.
Fernandes, J., & Myers, S. (2010). Inclusive deaf studies: Barriers and pathways. Journal of Deaf Studies & Deaf Education, 15, 3–16. doi:10.1093/deafed/enp018
Gallaudet Research Institute. (2001, January). Regional and national summary report of data from the 1999–2000 Annual Survey of Deaf and Hard of Hearing Children & Youth. Washington, DC: Author, Gallaudet University.
Gallaudet Research Institute. (2003, December). Regional and national summary report of data from the 2002–2003 annual survey of deaf and hard of hearing children and youth. Washington, DC: Gallaudet University.
Gallaudet Research Institute. (2011, April). Regional and national summary report of data from the 2009–2010 annual survey of deaf and hard of hearing children and youth. Washington, DC: Gallaudet University.
Gergen, K. J. (1991). The saturated self: Dilemmas of identity in contemporary life. New York, NY: Basic Books.
Gesser, A. (2007). Learning about hearing people in the land of the deaf: An ethnographic account. Sign Language Studies, 7, 269–283.
Glickman, N. S. (1986). Cultural identity, deafness, and mental health. Journal of Rehabilitation of the Deaf, 20, 1–10.
Glickman, N. S., & Carey, J. C. (1993). Measuring deaf cultural identities: A preliminary investigation. Rehabilitation Psychology, 38, 275–283.
Grushkin, D. A. (2003). The dilemma of the hard of hearing within the U.S. deaf community. In L. Monaghan, C. Schmaling, K. Nakamura, & G. H. Turner (Eds.), Many ways to be deaf: International variation in deaf communities (pp. 114–140). Washington, DC: Gallaudet University Press.
OJTE – FALL 2016
Hays, W. C. (1977). Theories and theoretical frameworks identified by family sociologists. Journal of Marriage and the Family, 39, 59–65.
Horejes, T. P. (2010). Constructions of deafness and deaf education: Exploring normalcy and deviance. US, ProQuest Information & Learning, 71.
Humphries, T., & Humphries, J. (2011). Deaf in the time of the cochlea. Journal of Deaf Studies and Deaf Education, 16(2), 153–163.
Jackson, C. W., Traub, R. J., & Turnbull, A. P. (2008). Parents’ experiences with childhood deafness: Implications for family-centered services. Communication Disorders Quarterly, 29, 82–98.
Ladd, P. (2005). Understanding deaf culture: In search of deafhood. Cleveland, OH: Multilingual Matters.
Lane, H., Hoffmeister, R., & Bahan, B. (1996). A journey into the Deaf-World. San Diego, CA: DawnSignPress.
Leigh, I. W. (2009). A lens on deaf identities: Perspectives on deafness. New York, NY: Oxford University Press.
Lichtman, M. (2006). Qualitative research in education: A user’s guide. Thousand Oaks, CA: Sage.
McIlroy, G. (2010). Discovering deaf identities: A narrative exploration of educational experiences on deaf identity. Saarbrucken, Germany: Lambert Academic Publishers.
McIlroy, G., & Storbeck, C. (2011). Development of deaf identity: An ethnographic study. Journal of Deaf Studies and Deaf Education, 16, 494–511.
Mead, G. H. (1934). Mind, self & society from the standpoint of a social behaviorist. Chicago, IL: University of Chicago Press.
Moores, D. (2004). The future of education of deaf children: Implications of population projections. American Annals of the Deaf, 149, 3–4.
Most, T., Wiesel, A., & Blitzer, T. (2007). Identity and attitudes towards cochlear implant among deaf and hard of hearing adolescents. Deafness & Education International, 9, 68–82.
Mottez, B. (1990). Deaf identity. Sign Language Studies, 68, 195–216.
National Institute on Deafness and Other Communication Disorders. (2013). Quick statistics. Retrieved from http://www.nidcd.nih.gov/health/statistics/Pages/
OJTE – FALL 2016 Orrange, R. M. (2003). The emerging mutable self: Gender dynamics and creative adaptations in
defining work, family, and the future. Social Forces, 82, 1–34.
Padden, C. A., & Humphries, T. (2005). Inside deaf culture. Cambridge, MA: Harvard University Press.
Pray, J. L., & Jordan, I. K. (2010). The deaf community and culture at a crossroads: Issues and challenges. Journal of Social Work in Disability & Rehabilitation, 9, 168–193.
Reagan, T. (1995). A sociocultural understanding of deafness: American Sign Language and the culture of deaf people. International Journal of Intercultural Relations,19, 239–251.
Schlesinger, H. S., & Meadow, K. P. (1972). Sound and sign: Childhood deafness and mental health. Berkeley, CA: University of California Press.
Shakespeare, T., & Watson, N. (2002). The social model of disability: An outdated ideology? Research in Social Science, 2, 9–28.
Sharagorodsky, J., Curhan, S. G., Curhan, G. C., & Eavey, R. (2010). Change in prevalence of hearing loss in US adolescents. Journal of the American Medical Association, 304, 772–778.
Simmel, G. (1971). On individuality and social forms. Chicago, IL: Chicago University Press.
Skelton, T., & Valentine, G. (2003). It feels like being deaf is normal: An exploration into the complexities of defining D/deafness and young D/deaf people’s identities. Canadian Geographer, 47, 451–466.
Strauss, A., & Corbin, J. (1998). Basics of qualitative research: Techniques and procedures for developing grounded theory. Thousand Oaks, CA: Sage.
Tajfel, H., & Turner, J. C. (1986). The social identity theory of intergroup behavior. In W. G. Austin & S. Worchel (Eds.), Psychology of Intergroup Relation (pp. 33–47). Monterey, CA:
Brooks/Cole.
U.S. Centers for Disease Control and Prevention. (2009). Summary of 2008 National CDC EHDI Data, Version A. Retrieved from http://www.cdc.gov/ncbddd/
hearingloss/2009-Data/2009_EHDI_HSFS_Summary_508_OK.pdf
U.S. Department of Education, National Center for Education Statistics. (2012). Digest of Education Statistics, 2011 (NCES 2012-001), Chapter 2.
White, K. R. (October, 2010). Twenty years of early hearing detection and intervention (EHDI): Where we’ve been and what we’ve learned. ASHA Audiology Virtual Conference.
OJTE – FALL 2016
Woodward, J. C. (1972). Implications for sociolinguistic research among the deaf. Sign Language Studies, 1, 1–7.
Wrigley, O. (1996). The politics of deafness. Washington, DC: Gallaudet University Press.
Zerubavel, E. (2007). Generally speaking: The logic and mechanics of social pattern analysis. Sociological Forum, 22, 131–145.
About the Author:
Kaitlin S. Shurts: BS in Life Science Education 4015 Benjamin Street
Cincinnati, Ohio 45245 [email protected]
Home Number: 513-417-4011 Business Number: 513-947-7400 Miami University
Biographical Sketch: It was in my Graduate Program at Miami University’s Project Dragonfly, that I first experienced authentic learning through inquiry based methods. During a spirited debate about inquiry based teaching at the Galavon Ranch in Baja Mexico for a field expedition (2014) with Miami University, I discovered my passion for inquiry-based learning in the midst of an internal debate of a possible career change from teaching. In this moment, as I stood up for the voice of my past and future students, I decided my Master Plan through the Project Dragonfly Program had to revolve around the benefits of inquiry-based teaching. Through my graduate program, teachers criticized inquiry and called me brave for trying it. I found that there is a bigger issue than to
OJTE – FALL 2016 TOPIC HERE
Improving Teaching Practices of STEM Teachers: The Teacher
Synergistic Institute in Warren County
Jennifer Blue, Ph.D., Lana Rocks, Ph.D., & Charles Setterfield, M.Arch. .
.
* Correspondence:
Dr. Jennifer Blue. Miami University 217 Kreger Hall 500 E. Spring Street Oxford, OH 45056
[email protected] 513-529-1380 Full list of author
information is available at the end of the article
Abstract:
The Teacher Synergistic Institute, funded by the National Science Foundation’s Advanced Technological Education directorate, provided professional development for high school teachers in Warren County for four years. There were two-week periods of professional development in the summers, which most teachers followed up with involvement in iDiscovery, an online collaborative learning community for teachers. The teachers involved reported satisfaction with the summer workshops and iDiscovery, and they learned instructional strategies and made changes to their teaching practices.
INTRODUCTION
Increasing workforce talent in science, technology, engineering, and math (STEM) disciplines is of profound national importance. To this end, it is critical to create a pipeline, starting in the early grades, to stimulate students’ interest in STEM courses and careers and to prepare them to compete for jobs within the expanding STEM frontier. Consequently, there is a need for teachers who are able to “prepare and inspire” students to pursue STEM related fields (President’s Council of Advisors on Science and Technology, 2010).