DEVELOPMENT OF MULTIDIMENSIONAL SEPARATIONS USING MICROFLUIDIC DEVICES FOR PROTEOMICS APPLICATIONS
Andrew George Chambers
A dissertation submitted to the faculty of the University of North Carolina at Chapel Hill in partial fulfillment of the requirements for the degree of Doctor of Philosophy in the Department of Chemistry.
Chapel Hill 2010
Approved by:
ii © 2010
iii ABSTRACT Andrew George Chambers
DEVELOPMENT OF MULTIDIMENSIONAL SEPARATIONS USING MICROFLUIDIC DEVICES FOR PROTEOMICS APPLICATIONS
(Under the direction of J. Michael Ramsey)
This work describes the development of novel microfluidic tools for the analysis of complex peptide mixtures. Gradient elution electrochromatography utilizing a
reversed-phase monolith stationary phase is demonstrated on a microchip device. Porous polymer monoliths were patterned within glass microchips by photopolymerization of acrylate monomers. Mobile phase gradients were readily produced on-chip by computer-controlled mixing of solvents. Isocratic and gradient separations of protein digests were preformed to evaluate this device.
iv
of performing LC-CE-ESI. This microchip incorporated a sample-trapping region and an LC channel packed with reversed-phase particles. In addition to LC-CE-ESI, this device was used for LC-ESI without any instrumental modifications.
v
ACKNOWLEDGEMENTS
vi
TABLE OF CONTENTS
List of Figures……….xi
List of Abbreviations………...…xvii
List of Symbols………...…...xx
CHAPTER 1: Introduction to Multidimensional Separations for Proteomics ... 1
1.1 Motivation ... 1
1.1.1 Proteomics and the Complexity of Biological Samples ... 1
1.1.2 The Necessity for High Peak Capacity ... 2
1.2 Multidimensional Separations ... 4
1.2.1 Theory ... 4
1.2.2 Conventional 2D Separations ... 6
1.2.3 Microfluidic 2D Separations ... 8
1.3 Figures ... 10
1.4 References ... 14
CHAPTER 2: Gradient Elution Capillary Electrochromatography using Monolith Stationary Phases on a Microfluidic Device ... 18
2.1 Introduction ... 18
2.2 Experimental ... 20
2.2.1 Reagents ... 20
2.2.2 Sample Preparation ... 21
2.2.3 Microchip Fabrication... 22
vii
2.2.5 Microchip Operation ... 24
2.2.6 Data Analysis ... 25
2.3 Results and Discussion ... 25
2.3.1 Photopatterned Monolith Material ... 25
2.3.2 Isocratic Separations ... 27
2.3.3 Gradient Separations ... 28
2.4 Conclusions ... 30
2.5 Acknowledgements ... 30
2.6 Figures ... 31
2.7 References ... 42
CHAPTER 3: Hybrid 2D Liquid Chromatography-Capillary Electrophoresis with Laser-Induced Fluorescence Detection ... 45
3.1 Introduction ... 45
3.2 Experimental ... 48
3.2.1 Reagents ... 48
3.2.2 Sample Preparation ... 48
3.2.3 Capillary LC Column... 48
3.2.4 Capillary-to-Microchip Fittings ... 49
3.2.5 Microchip CE Device ... 50
3.2.6 System Operation ... 51
3.2.7 Data Analysis ... 52
3.3 Results and Discussion ... 52
3.3.1 Capillary-to-Microchip Fittings ... 52
3.3.2 CE Injection Interface ... 53
viii
3.3.4 LC-CE-LIF System ... 57
3.3.5 TRITC Labeled Peptides ... 60
3.4 Conclusion ... 61
3.5 Figures ... 63
3.6 References ... 74
CHAPTER 4: Hybrid 2D Liquid Chromatography-Capillary Electrophoresis with Mass Spectrometry Detection for the Analysis of Monoclonal Antibodies ... 76
4.1 Introduction ... 76
4.2 Experimental ... 76
4.2.1 Reagents ... 76
4.2.2 Sample Preparation ... 77
4.2.3 Microchip Fabrication... 78
4.2.4 Capillary LC ... 79
4.2.5 Microchip CE ... 80
4.2.6 Microchip ESI Interface... 80
4.2.7 Mass Spectrometry ... 81
4.2.8 Data Analysis ... 81
4.3 Results and Discussion ... 82
4.3.1 LC-CE-MS System Characterization... 82
4.3.2 Antibody Tryptic Peptide Mapping ... 85
4.3.3 Foreign Contaminate Identification ... 86
4.3.4 Determination of Methionine Oxidation... 87
4.4 Conclusion ... 89
4.5 Figures ... 90
ix
CHAPTER 5: Monolithic 2D Liquid Chromatography-Capillary
Electrophoresis with Mass Spectrometry Detection ... 106
5.1 Introduction ... 106
5.2 Experimental ... 106
5.2.1 Reagents and Materials ... 106
5.2.2 Microchip Fabrication... 107
5.2.3 Particle Packing ... 108
5.2.4 Surface Modifications ... 109
5.2.5 Microchip Operation ... 109
5.2.6 Data Processing... 112
5.3 Results and Discussion ... 112
5.3.1 ESI-MS ... 112
5.3.2 LC-MS ... 113
5.3.3 LC-CE-MS ... 113
5.4 Conclusion ... 116
5.5 Figures ... 118
5.6 References ... 127
CHAPTER 6: Microfluidic Dual Electrospray Ionization Source for Accurate Mass Measurements ... 128
6.1 Introduction ... 128
6.2 Experimental ... 130
6.2.1 Pressure-Driven Strategy ... 130
6.2.2 Electrokinetically-Driven Strategy ... 131
6.3 Results and Discussion ... 133
6.3.1 Pressure-Driven Setup ... 133
x
xi
LIST OF FIGURES
Figure 1-1. The percentage of components resolved as a function of peak capacity for a 1D separation using SMO theory. Traces are shown for mixtures
containing 100, 250, 500, and 1,000 components. ... 10 Figure 1-2. General strategy for 2D separations. Peaks from the first dimension
are subjected to a second dimension of separation to increase the overall resolving
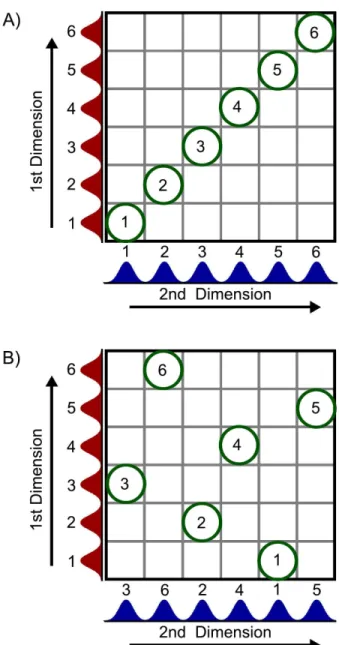
power. ... 11 Figure 1-3. Illustration of the need for orthogonality in 2D separation methods.
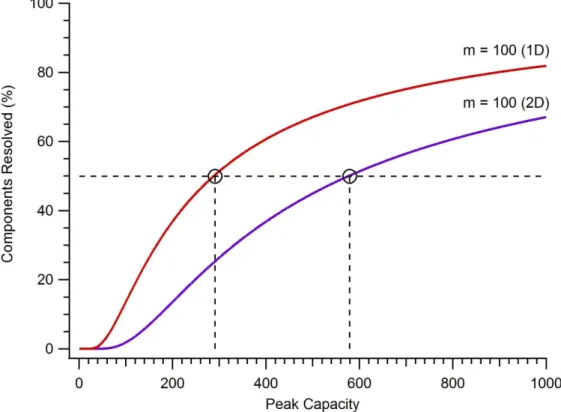
A) non-orthogonal, B) orthogonal ... 12 Figure 1-4. The percentage of components resolved as a function of peak
capacity for a 1D and 2D separation of a 100 component mixture using SMO
theory. ... 13 Figure 2-1. A) Chemical structure for 5-TRITC, B) Schematic for the labeling
reaction involving an isothiocyanate and a primary amine. ... 31 Figure 2-2. A) Channel layout for the gradient elution CEC microchip device. B)
Photograph of the device with channels filled with ink for contrast. The
dimensions of the microchip are 25 mm by 50 mm. ... 32 Figure 2-3. A) Chemical structures for the acrylates used in the monolith
synthesis, B) mechanism for the polymerization of butyl methacrylate where I is
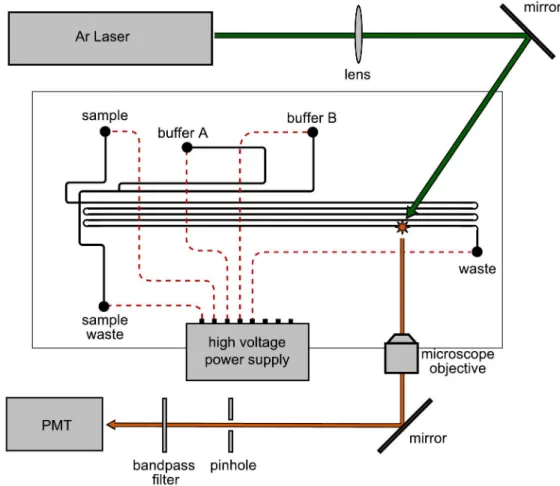
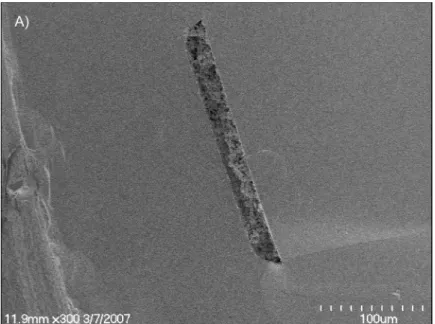
the free radical initiator and R is a butyl group. ... 33 Figure 2-4. The schematic for the complete gradient elution CEC-LIF setup. ... 34 Figure 2-5. SEM images of a microchannel cross-section filled with the monolith
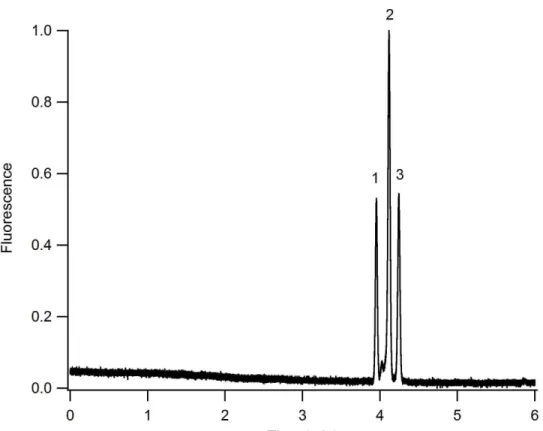
material. ... 35 Figure 2-6. CEC separation of peptides under isocratic conditions. Mobile phase: 10 mM sodium phosphate, pH 7 with 30% acetonitrile. Analytes: 1) G-P-R, 2)
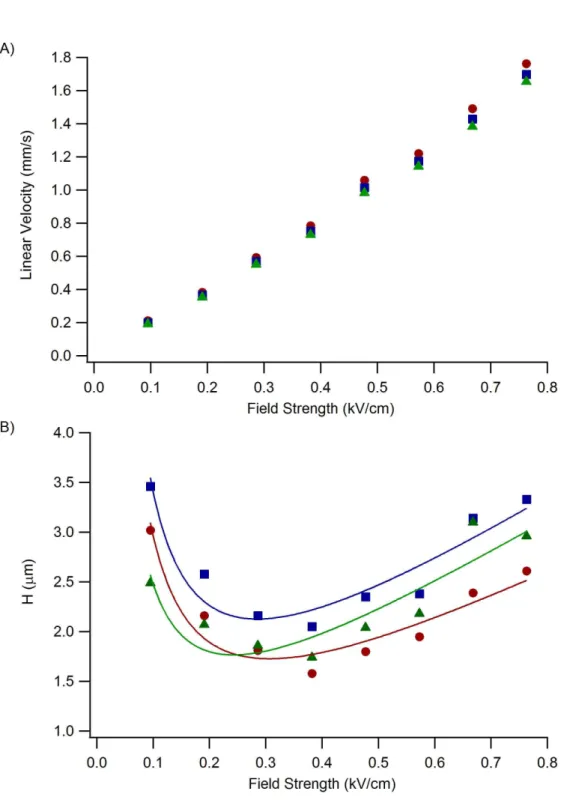
Bradykinin (1-6), 3) Enkephalin [Met5, Arg6]. Field strength: 0.38 kV/cm. ... 36 Figure 2-7. A) Linear velocity and B) plate height vs field strength. Mobile
phase: 10 mM sodium phosphate, pH 7 with 30% acetonitrile. Analytes: G-P-R
(cicles), Bradykinin (1-6) (squares), Enkephalin [Met5, Arg6] (triangles). ... 37 Figure 2-8. A) Photograph of the “T” intersection. The arrows denote the
direction of the fluid flow. B-D) Flourescence imaging of buffer mixing at
xii
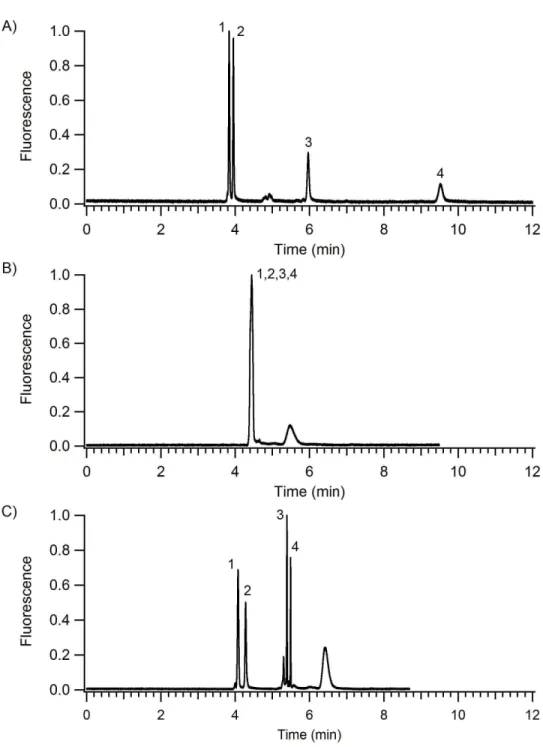
Figure 2-9. Isocratic and gradient elution CEC separations of peptides. Mobile phase: 10 mM sodium phosphate, pH 7 with A) 25% acetonitrile, B) 50%
acetonitrile, C) 20% to 50% acetonitrile in 2 min. Analytes: 1) G-P-R , 2) G-F-R, 3) Bradykinin (1-6), and 4) Enkephalin [Met5, Arg6, Phe7]. Field strength:
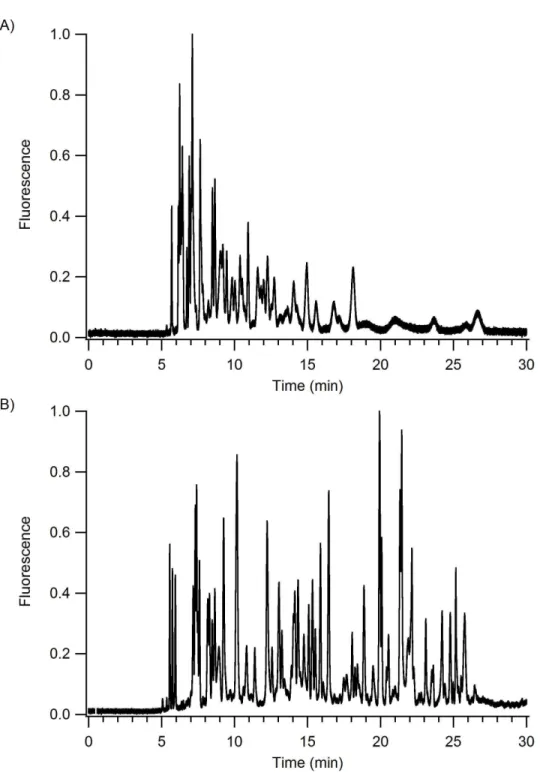
0.42 kV/cm. ... 39 Figure 2-10. Isocratic and gradient elution CEC separation of a BSA trypic
digest. Mobile phase: 10 mM sodium phosphate, pH 7 with A) 10% acetonitrile,
B) 0% to 50% acetonitrile in 33 min. Field strength: 0.3 kV/cm. ... 40 Figure 2-11. Fast gradient elution CEC separation of a BSA tryptic digest.
Mobile phase: 10 mM sodium phosphate, pH 7 with 0% to 50% acetonitrile in
8 min. Field strength: 1.0 kV/cm... 41 Figure 3-1. Photographs of the capillary-to-microchip fittings: A) disassembled
fittings, B) side view of the assembled fitting in use. ... 63 Figure 3-2. A) Schematic for the hybrid 2D LC-CE-LIF separation system, B)
chemical structure for the PolyE-323 channel surface coating. ... 64 Figure 3-3. LIF detection of rhodamine B peaks at the transfer capillary (black)
and in the LC inlet channel on the microchip (red)... 65 Figure 3-4. Migration times for 80 consecutive CE injections of the same
fluorescein and rhodamine B sample. Analysis performed on a microfluidic device with a 10 cm CE separation channel. BGE: 0.1% formic acid, 25%
acetonitrile, pH 2.5, E = 1 kV/cm, L = 95 mm. ... 66 Figure 3-5. Peak area for 80 consecutive CE injections of the same fluorescein
and rhodamine B sample. Analysis performed on a microfluidic with a 10 cm CE separation channel. BGE: 0.1% formic acid, 25% acetonitrile, pH 2.5,
E = 1 kV/cm, L = 95 mm. ... 67 Figure 3-6. Diagram of injection sequences for maximizing the number of
separations per unit time using normal and “overlapping” injections. See text for
a detailed explanation. ... 68 Figure 3-7. LC-LIF separation of a BSA tryptic digest. Flow rate: 150 nL/min.
Gradient: 15-50% B in 60 min (MPA: 0.1% formic acid in water, MPB: 0.1%
xiii
Figure 3-8. LC-CE-LIF separation of a BSA tryptic digest. Flow rate: 150 nL/min. Gradient: 15-50% B in 60 min (MPA: 0.1% formic acid in water, MPB: 0.1% formic acid in acetonitrile.) CE BGE: 1% formic acid, 25 % acetonitrile; L: 23.5 mm, E: 1.5 kV/cm. ... 70 Figure 3-9. A 2D plot of the LC-CE-LIF data shown in Figure 3-7. The red box
indicates the region that is enlarged and shown in Figure 3-10. ... 71 Figure 3-10. Enlarged spot from the 2D LC-CE-LIF data in Figure 3-9. ... 72 Figure 3-11. LC-LIF analysis of A) digestion buffer, B) digestion buffer and
trypsin, and C) digestion buffer, trypsin and cytochrome c. Flow rate: 150 nL/min. Gradient: 15-50% B in 60 min (MPA: 0.1% formic acid in water, MPB:
0.1% formic acid in acetonitrile.) ... 73 Figure 4-1. A) Schematic for the hybrid 2D LC-CE-MS system. ESI was
performed from the lower right corner of the glass microchip device. B) Photograph of the microchip device mounted in front of the inlet of a mass
spectrometer. ... 90 Figure 4-2. Analysis of the mAb tryptic digest by 1D and 2D methods. A)
LC-MS BPI chromatogram, B) LC-CE-MS BPI chromato-electropherogram. ... 91 Figure 4-3. An enlarged time axis of the mAb tryptic digest analyses shown in
Figure 4-2. A) LC-MS, B) LC-CE-MS. The dashed lines represent the individual CE separation windows. ... 92 Figure 4-4. Two-dimensional LC-CE-MS analysis of the mAb tryptic digest.
A) CE injections were performed every10 s. The m/z values for several
components are labeled. B) CE injections every 5 s. Five peptides of interest are
labeled P3-P7... 93 Figure 4-6. LC-MS of the mAb tryptic digest. Reconstructed ion chromatograms
for 5 common tryptic peptides labeled P3-P7 and the BPI chromatogram (bottom
trace). ... 95 Figure 4-7. Observed ions in the 1,500-2,000 Da range from the mAb tryptic
digest. A) LC-MS and B) LC-CE-MS. The numerical labels indicate the peak elution times for the detected masses in minutes. The masses highlighted in blue
were identified as peptides from the mAb tryptic digest. ... 96 Figure 4-8. BPI chromatograms for the LC-MS analysis of the mAb tryptic
digest. A) original sample, B) sample material spiked with leucine enkephalin
xiv
Figure 4-9. Mass spectra from the LC-MS analysis shown in Figure 4-8 at the retention time of leucine enkephalin. A) original sample, B) sample material
spiked with leucine enkephlain (556 m/z)... 98 Figure 4-10. Two-dimensional LC-CE-MS analysis of the mAb tryptic digest.
A) original sample, B) sample material spiked with leucine enkephalin. The
arrow indicates the location of the leucine enkephalin. ... 99 Figure 4-11. BPI chromatograms for LC-MS of the mAb lys-C digests.
A) original sample, B) 10% spiked oxidized control. The blue numbers indicate native peptides and red numbers indicate oxidized peptides. Data was acquired at
2 Hz. ... 100 Figure 4-12. Masses observed in the LC-MS analysis of A) the original sample
and B) 10% spiked control for peptides 1-3. Native peptides (blue), oxidized peptides (red). The numerical labels indicate the peak elution time in minutes for
the detected masses. ... 101 Figure 4-13. Two-dimensional LC-CE-MS analysis of the mAb Lys-C digests.
A) original sample, B) 10% spiked oxidized control. The blue numbers indicate
native peptides and red numbers indicate oxidized peptides. ... 102 Figure 4-14. Two-dimensional LC-CE-MS analyses showing with the original
sample and the 10% spiked oxidized sample control overlaid in the red color
scheme. ... 103 Figure 4-15. Masses observed in the LC-CE-MS analysis of A) the original
sample and B) 10% spiked control for peptides 1-3. Native peptides (blue), oxidized peptides (red). The numerical labels indicate the peak elution time in
minutes for the detected masses. ... 104 Figure 5-1. Schematic for the microchip-based LC-CE-MS system. The blue
squares outlined in dashes on the microchip denote the location of the weirs that were used to retain the packed particles. Valve 1 (V1) was used to perform LC injections and valve 2 (V2) was used to open and close the vent line. Valves are shown in the “sample loading” configuration. Electrospray was performed from
the lower right corner of the microchip. ... 118 Figure 5-2. SEM images of the cross section of a microchip channel, 33 µm deep
xv
Figure 5-3. BPI chromatogram for the LC-MS analysis of A) 200 fmol of a tryptic digest of a bovine serum albumin and yeast enolase mixture B) 800 ng of E.coli lysate tryptic digets. MPA, 0.1% formic acid in water; MPB, 0.1% formic
acid in acetonitrile; gradient 5 to 50% B in 30 min; flow rate 65 nL/min. ... 120 Figure 5-4. A) BPI chromato-electropherogram for the LC-CE-MS analysis of
the same tryptic digest of BSA and enolase shown in Figure 5-3A. B) An
expanded view of a 1 min interval in the separation above. Dashed lines indicate
CE separation windows. ... 121 Figure 5-5. A two-dimensional plot for an LC-CE-MS analysis of 200 fmol of a
tryptic digest of a bovine serum albumin and yeast enolase mixture... 122 Figure 5-6. Three replicate LC-CE-MS analyses of 200 fmol of the BSA and
enolase tryptic digest. ... 123 Figure 5-7. A) BPI chromato-electropherogram for the LC-CE-MS analysis of
the same tryptic digest of E. coli lysate shown in Figure 5-3B. B) An expanded view of a 1 min interval in the separation above. Dashed lines indicate CE
separation windows. ... 124 Figure 5-8. A two-dimensional plot of the LC-CE-MS analysis of 800 ng of an
E. coli cell lysate tryptic digest. ... 125 Figure 5-9. Mass spectra containing the highest abundance of the 552.2 m/z ion
from an E. coli cell lysate tryptic digest analyzed by (A) LC-MS and (B)
LC-CE-MS. ... 126 Figure 6-1. Schematic for the pressure-driven dual ESI setup. ... 138 Figure 6-2. Photograph of the two pressure-driven microchip emitters positioned
in front of the inlet of the mass spectrometer according to the schematic
in Figure 6-1. ... 139 Figure 6-3. Schematic of the microchip dual ESI device. A nanojunction
connects the transfer channels and the U-shaped EO pump channels. ... 140 Figure 6-4. A single microchip emitter positioned on axis with the inlet of the
mass spectrometer showing A) the electrospray plume at the optimal emitter
voltage, B) droplet formation at an attenuated emitter voltage. ... 141 Figure 6-5. Sequential sampling of ions produced from the A) left emitter
xvi
Figure 6-6. Microchip dual ESI device with A) analyte emitter active and B) reference emitter active. The electrospray plumes are illuminated with green
diode lasers. ... 143 Figure 6-7. Sequential sampling of analyte and reference materials every 2 s.
Reconstructed ion chromatograms are shown for A) reference signal [reserpine] B) analyte signal [leucine enkephalin] and C) the combined reference and analyte
signal. ... 144 Figure 6-8. Enlarged section of the data in Figure 3. Reconstructed ion
chromatograms are shown for A) reference signal [reserpine] B) analyte signal [leucine enkephalin] and C) the combined reference and analyte signal. At 14.52
s the reference electrospray is turned off and the analyte electrospray is turned on. ... 145 Figure 6-9. One minute of summed mass spectra from the A) reference
[reserpine] and B) analyte [leucine enkephalin] data file. ... 146 Figure 6-10. A) Mass measurement errors for infusion ESI-MS of leucine
enkeplain. Raw data (open circles), corrected data (closed circles). B) Expansion of the mass error axis for the corrected data showing all measurements were
xvii
LIST OF ABBERVIATIONS
1D one-dimensional
2D two-dimensional
2D-PAGE two-dimensional polyacrylamide gel electrophoresis AIBN 2,2’-azobisisobutyronitrile
AMPS 2-acrylamido-2-methyl-1-propanesulfonic acid BGE background electrolyte
BPI base peak index BSA bovine serum albumin CCD charge-coupled device CE capillary electrophoresis
CEC capillary electrochromatography
cm centimeter
°C degrees Celsius
Da dalton
EOF electroosmotic flow ESI electrospray ionization
HPLC high performance liquid chromatography
Hz Hertz
i.d. inner diameter IEF isoelectric focusing
kV kilovolt
xviii LIF laser-induced fluorescence lys-C lysyl endopeptidase
m meter
MEKC micellar electrokinetic chromatography
mg milligram
min minute
mL milliliter
mm millimeter
mM millimolar
mAb monoclonal antibody
ms millisecond
MS mass spectrometry
mW milliwatt
MW molecular weight
m/z mass to charge ratio
µL microliter
µm micrometer
µM micromolar
nL nanoliter
nm nanometer
o.d. outer diameter
xix QTof quadrupole-time of flight RSD relative standard deviation
s seconds
SDS sodium dodecyl sulfate SEM scanning electron microscope SMO statistical model of overlap Tof time of flight
TRITC tetramethylrhodamine isothiocyanate
UV ultra-violet
xx
LIST OF SYMBOLS E electric field strength
ϵ dielectric constant
ϵo permittivity of free space
H height equivalent theoretical plate
L length
m total number of components in sample N number of theoretical plates
nc peak capacity
η
viscosityp probability of separating all components in a sample
Rs resolution
s number of separated components
σ standard deviation
trun elapsed time from injection to detection of last peak twindow elapsed time for the separation window
ueo electroosmotic velocity µeo electroosmotic mobility µep electrophoretic mobility
CHAPTER 1: Introduction to Multidimensional Separations for Proteomics
1.1 Motivation
1.1.1 Proteomics and the Complexity of Biological Samples
Proteomics is the global study of all proteins in an organism to determine how protein expression and interaction regulate biological pathways. This information is crucial to improving our fundamental understanding of physiology and has immediate application in the diagnosis, monitoring and treatment of disease. One key step in deciphering the proteome is the ability to identify and quantify proteins and peptides in biological samples. This task is extremely challenging due to the complexity of
biological systems. For example, the human genome codes for approximately 20,000 to 25,000 proteins.1 The actual number of proteins expressed is likely orders of magnitude higher due to several factors including alternative messenger ribonucleic acid splicing2 and post-translational modifications.3 In addition, the range of protein concentration in some samples is a least ten orders of magnitude.4 To further complicate matters, protein expression changes in with time and in response to various environmental stimuli.
The comprehensive analysis of proteins in biological samples is dominated by mass spectrometry (MS)-based analytical methods because of their ability to
2
peptides prior to separation and MS analysis. The MS data is then used to search protein sequence databases to identify the original proteins in the sample. Alternatively, top-down approaches focus on the separation and MS analysis of intact proteins. There are many advantages and disadvantages to each approach that depend on the specific data desired. A comprehensive approach combines data from both top-down and bottom-up approaches to obtain the most complete data set from the sample. Regardless of which approach is selected, one of the largest obstacles in identifying proteins is sample
complexity, which must be reduced prior to introduction into a mass spectrometer. 1.1.2 The Necessity for High Peak Capacity
It may be useful to review a few metrics for assessing the performance of an analytical separation to further define what is necessary to separate complex biological samples. The broadening of an analyte band as it travels through the separation space can be described using the height equivalent theoretical plate, H, which is calculated by,7
= (1-1)
where is the standard deviation of the peak width and L is the length that the peak is displaced. The total number of plates, N, is the number of H units contained in the separation path,7
= (1-2)
3
components. For this purpose, it may be better to use peak capacity, , which is defined as the maximum number of peaks that can theoretically fit in a given separation space,7
= 4 (1-3)
where L is the space over which the peak may be distributed and the last peak and Rs is the resolution between adjacent peaks. This equation assumes that peaks of equal width are evenly spaced at the highest density that allowed for a given resolution. In practice, peaks are rarely spaced at even intervals and are often overlapped. Thus a peak capacity value of 100 is not sufficient to resolve a mixture of 100 components. The peak capacity required to resolve all components in a complex mixture for a given confidence interval can be described using the statistical model of overlap (SMO).8 This model assumes that peaks are randomly distributed throughout the given separation space. Using SMO theory the probability that any given component will be resolved by a one-dimensional (1D) separation can be calculated by8
=
=
(1-4)
4
Current 1D separation methods lack the peak capacity to separate even moderately complex biological mixtures. For example, reversed-phase liquid
chromatography (LC) is among the best 1D separation methods for proteins and peptides. The highest reported peak capacity to date for reversed-phase LC separations of peptides is 1,500.9 Using Equation 1-4, a peak capacity of 1,500 will only resolve 0.13% a sample that contained 5,000 peptides. It is readily apparent that this level of separation power is inadequate to resolve highly complex samples that may contain hundreds of thousands of peptides. The inability to resolve peaks results in a loss of information as overlapping peaks prevents identification and quantification when using a general detection scheme, such as ultraviolet (UV)-absorbance. MS detection can differentiate between several components introduced simultaneously; however, efficient sample ionization and data interpretation becomes problematic when large numbers of components are introduced together. In general, increasing the resolving power of the separation will increase the number of proteins identified in the original sample. The development of analytical instrumentation that can rapidly generate larger peak capacities is a critical step to advancing proteomic research.
1.2 Multidimensional Separations 1.2.1 Theory
5
peaks to a second separation provides another opportunity for components to be resolved. Giddings described two general criteria for maximizing the peak capacity of a
multidimensional separation method.10 First, separations to be coupled should be orthogonal so that there is no correlation in selectivity. Generally, different separation mechanisms are coupled so each separates the sample based on a different set of chemical or physical properties. The need for othogonality is illustrated using a 2D separation in Figure 1-3. If the selectivity is the same in both dimensions, then the peaks will fall along a diagonal line without increasing resolution as shown in Figure 1-3A. Conversely, a large difference in selectivity will result in peaks being distributed across the entire 2D separation space as shown in Figure 1-3B. This additional resolution may also allow multiple components within the original peaks to be resolved. The second criterion for multidimensional separations states that the resolution obtained in any dimension must be retained. If these two criteria are met, then the maximum peak capacity is the product of the peak capacity in each dimension,10
!"=
#×
%×
&⋯
(1-5)For example, a two dimensional (2D) separation method with a modest peak capacity of 150 in the first dimension and 50 in the second dimension could be coupled to produce a total peak capacity of 7,500.
It is important to point out that peak capacities generated by 1D and 2D
separations are not equivalent. An extension of SMO theory reveals that the probability of resolving any given component by a 2D separation is11
6
This equation shows that twice the peak capacity is needed for a 2D separation to resolve the same number of components as a 1D separation. Figure 1-4 illustrates this difference by comparing the peak capacity required to separate 50% of the components (/ ∗ 100 = 50%) in a 100 component mixture using 1D and 2D methods. Fortunately, 2D separation methods often increase the peak capacity by many fold to provide a large net gain in the ability to resolve complex mixtures.
1.2.2 Conventional 2D Separations
Two-dimensional polyacrylamide gel electrophoresis (2D-PAGE) is the most common multidimensional separation method used in the analysis of proteins.12 This method utilizes isoelectric focusing (IEF) to separate proteins by their isoelectric point followed by sodium dodecyl sulfate polyacrylamide gel electrophoresis (SDS-PAGE) to further resolve proteins essentially by size. 2D-PAGE is a very powerful protein
separation method as it can routinely resolve thousands of proteins.13 Following the separation, proteins of interest are typically excised from the gel and enzymatically digested prior to analysis by MS. Although 2D-PAGE can provide a high resolving power, this method suffers from key limitations.13-15 This method is not well suited to the analysis of several classes of proteins as very large or hydrophobic proteins do not
efficiently load into the gel and alkaline proteins are often poorly resolved. The
7
into the mass spectrometer individually. This laborious procedure makes comprehensive identification of complex samples largely impractical.
To address some of the limitations of 2D-PAGE, several column-based 2D separation methods have been developed. These 2D methods couple linear separation columns by collecting fractions from the first dimension and injecting this material onto the second dimension. One large advantage of column-based 2D separations is that they are readily coupled with MS detection via electrospray ionization (ESI).16 Columns may be coupled using an offline or online strategy. Offline column coupling requires fractions from the first dimension to be stored for later analysis by the second dimension. In online column coupling, fractions from the first column are immediately injected onto the second column for analysis. The main advantage of online column coupling is that the entire analysis is completed in the time required for the first dimension. This requires that the separation in second dimension is completed rapidly to prevent undersampling of the first dimension. In theory, peaks from the first dimension should be sampled 3-4 times by the second dimension to preserve the resolution already obtained.17
The majority of online 2D methods utilize LC in both dimensions (LC-LC), such as ion exchange chromatography followed by reversed-phase chromatography.18-22 This is largely due to the relative ease in coupling these separations as a standard LC valve can readily transfer fractions from the first column onto the second. However, it is generally difficult to complete the second dimension fast enough to keep up with the peaks eluting from the first dimension. Several alterative separation methods involving capillary
8 1.2.3 Microfluidic 2D Separations
Microfluidic devices provide a fundamentally different platform for performing chemical analysis.27-28 These microfabricated devices, also known as Lab-on-a-Chip or Micro Total Analysis Systems, are characterized by a network of interconnecting fluidic channels created in a single planer substrate. Typical channels have dimensions in the micron range and are readily fabricated using well established technologies borrowed from the semi-conductor industry. These properties give microfluidic devices inherent advantages over traditional instrumentation for chemical analysis. The confined channel environment enables precise manipulation of fluid volumes in the picoliter to microliter range. The reduced length scale also decreases sample and reagent consumption and often leads to shorter analysis time. Parallel fabrication can reduce instrumentation cost and enable highly multiplexed systems, increasing sample throughput. The most
important advantage is the ability to integrate several fluidic operations on the same device. This enables minute samples to be rapidly transported between several sequential processing steps with near zero band broadening. Integration can also reduce the
complexity of the instrumentation and facilitate automation. Over the last two decades, numerous fluidic operations have been successfully implemented on microfluidic devices to enable a wide range of chemical analyses to be performed.29-34 In addition, there have been many strategies reported for coupling these devices with MS detection via ESI.35-37
9
chromatography (MEKC) coupled with CE.40 Later improvements to this device allowed for a peak capacity of approximately 4,000 to be generated for protein digests in less than 15 min.41 Shadpour and coworkers coupled gel CE with MEKC resulting in a peak capacity of over 1,000 for proteins in 12 min.42 Multiple groups have reported devices that perform IEF-CE that are able to generate peak capacities in excess of 1,700 for proteins in less than 15 min.43-44 This represents a reduction in analysis time of
approximately two orders of magnitude when compared with conventional 2D-PAGE. These examples clearly demonstrate the power of microfluidic 2D separation systems to rapidly separate biological samples. The next crucial step towards comprehensive analysis of biological samples using microfluidic devices is the development of 2D separations that can be directly integrated with MS detection.
10 1.3 Figures
11
12
13
14 1.4 References
1. Collins, F. S.; Lander, E. S.; Rogers, J.; Waterston, R. H.; Int Human Genome Sequencing, C. Finishing the euchromatic sequence of the human genome.
Nature 2004, 431, 931.
2. Matlin, A. J.; Clark, F.; Smith, C. W. J. Understanding alternative splicing: Towards a cellular code. Nat. Rev. Mol. Cell Bio. 2005, 6, 386.
3. Uy, R.; Wold, F. Post-translational covalent modification of proteins. Science 1977, 198, 890.
4. Anderson, N. L.; Anderson, N. G. The human plasma proteome - History, character, and diagnostic prospects. Mol. Cell Proteomics 2002, 1, 845. 5. Domon, B.; Aebersold, R. Review - Mass spectrometry and protein analysis.
Science 2006, 312, 212.
6. Yates, J. R.; Ruse, C. I.; Nakorchevsky, A. Proteomics by mass spectrometry: Approaches, advances, and applications. Annu. Rev. Biomed. Eng. 2009, 11, 49. 7. Giddings, J. C. Unified Separation Science; John Wiley & Sons, Inc.: New York,
NY, 1991.
8. Davis, J. M.; Giddings, J. C. Statistical-theory of component overlap in multicomponent chromatograms Anal. Chem. 1983, 55, 418.
9. Shen, Y. F.; Zhang, R.; Moore, R. J.; Kim, J.; Metz, T. O.; Hixson, K. K.; Zhao, R.; Livesay, E. A.; Udseth, H. R.; Smith, R. D. Automated 20 kpsi RPLC-MS and MS/MS with chromatographic peak capacities of 1000-1500 and capabilities in proteomics and metabolomics. Anal. Chem. 2005, 77, 3090.
10. Giddings, J. C. Two-dimensional separations - concept and promise. Anal.
Chem. 1984, 56, 1258A.
11. Davis, J. M. Statistical-theory of spot overlap in 2-dimensional separations Anal.
Chem. 1991, 63, 2141.
12. Ofarrell, P. H. High-resolution 2-dimensional electrophoresis of proteins. J. Biol.
Chem. 1975, 250, 4007.
13. Lopez, J. L. Two-dimensional electrophoresis in proteome expression analysis.
J. Chromatogr. B 2007, 849, 190.
14. Vercauteren, F. G. G.; Arckens, L.; Quirion, R. Applications and current challenges of proteomic approaches, focusing on two-dimensional electrophoresis. Amino Acids 2007, 33, 405.
15
16. Fenn, J. B.; Mann, M.; Meng, C. K.; Wong, S. F.; Whitehouse, C. M. Electrospray ionization for mass-spectrometry of large biomolecules Science 1989, 246, 64.
17. Murphy, R. E.; Schure, M. R.; Foley, J. P. Effect of sampling rate on resolution in comprehensive two-dimensional liquid chromatography. Anal. Chem. 1998, 70, 1585.
18. Stoll, D. R.; Li, X. P.; Wang, X. O.; Carr, P. W.; Porter, S. E. G.; Rutan, S. C. Fast, comprehensive two-dimensional liquid chromatography. J. Chromatogr. A 2007, 1168, 3.
19. Dugo, P.; Cacciola, F.; Kumm, T.; Dugo, G.; Mondello, L. Comprehensive multidimensional liquid chromatography: Theory and applications. J.
Chromatogr. A 2008, 1184, 353.
20. Guiochon, G.; Marchetti, N.; Mriziq, K.; Shalliker, R. A. Implementations of two-dimensional liquid chromatography. J. Chromatogr. A 2008, 1189, 109. 21. Zhang, X.; Fang, A. Q.; Riley, C. P.; Wang, M.; Regnier, F. E.; Buck, C.
Multi-dimensional liquid chromatography in proteomics-A review. Anal. Chim. Acta 2010, 664, 101.
22. Horvatovich, P.; Hoekman, B.; Govorukhina, N.; Bischoff, R. Multidimensional chromatography coupled to mass spectrometry in analysing complex proteomics samples. J. Sep. Sci. 2010, 33, 1421.
23. Cooper, J. W.; Wang, Y. J.; Lee, C. S. Recent advances in capillary separations for proteomics. Electrophoresis 2004, 25, 3913.
24. Evans, C. R.; Jorgenson, J. W. Multidimensional LC-LC and LC-CE for high-resolution separations of biological molecules. Anal. Bioanal. Chem. 2004, 378, 1952.
25. Stroink, T.; Ortiz, M. C.; Bult, A.; Lingeman, H.; de Jong, G. J.; Underberg, W. J. M. On-line multidimensional liquid chromatography and capillary
electrophoresis systems for peptides and proteins. J. Chromatogr. B 2005, 817, 49.
26. Sandra, K.; Moshir, M.; D'Hondt, F.; Tuytten, R.; Verleysen, K.; Kas, K.;
Francois, I.; Sandra, P. Highly efficient peptide separations in proteomics Part 2: Bi- and multidimensional liquid-based separation techniques. J. Chromatogr. B 2009, 877, 1019.
27. Whitesides, G. M. The origins and the future of microfluidics. Nature 2006, 442, 368.
16
29. Reyes, D. R.; Iossifidis, D.; Auroux, P. A.; Manz, A. Micro total analysis systems. 1. Introduction, theory, and technology. Anal. Chem. 2002, 74, 2623. 30. Auroux, P. A.; Iossifidis, D.; Reyes, D. R.; Manz, A. Micro total analysis
aystems. 2. Analytical standard operations and applications. Anal. Chem. 2002, 74, 2637.
31. Vilkner, T.; Janasek, D.; Manz, A. Micro total analysis systems. Recent developments. Anal. Chem. 2004, 76, 3373.
32. Dittrich, P. S.; Tachikawa, K.; Manz, A. Micro total analysis systems. Latest advancements and trends. Anal. Chem. 2006, 78, 3887.
33. West, J.; Becker, M.; Tombrink, S.; Manz, A. Micro total analysis systems: Latest achievements. Anal. Chem. 2008, 80, 4403.
34. Arora, A.; Simone, G.; Salieb-Beugelaar, G. B.; Kim, J. T.; Manz, A. Latest developments in micro total analysis systems. Anal. Chem. 2010, 82, 4830. 35. Lazar, I. M.; Grym, J.; Foret, F. Microfabricated devices: A new sample
introduction approach to mass spectrometry. Mass Spectrom. Rev. 2006, 25, 573. 36. Foret, F.; Kusy, P. Microfluidics for multiplexed MS analysis. Electrophoresis
2006, 27, 4877.
37. Koster, S.; Verpoorte, E. A decade of microfluidic analysis coupled with electrospray mass spectrometry: An overview. Lab Chip 2007, 7, 1394.
38. Chen, H.; Fan, Z. H. Two-dimensional protein separation in microfluidic devices.
Electrophoresis 2009, 30, 758.
39. Tia, S.; Herr, A. E. On-chip technologies for multidimensional separations. Lab Chip 2009, 9, 2524.
40. Rocklin, R. D.; Ramsey, R. S.; Ramsey, J. M. A microfabricated fluidic device for performing two-dimensional liquid-phase separations. Anal. Chem. 2000, 72, 5244.
41. Ramsey, J. D.; Jacobson, S. C.; Culbertson, C. T.; Ramsey, J. M. High-efficiency, two-dimensional separations of protein digests on microfluidic devices. Anal. Chem. 2003, 75, 3758.
42. Shadpour, H.; Soper, S. A. Two-dimensional electrophoretic separation of proteins using poly(methyl methacrylate) microchips. Anal. Chem. 2006, 78, 3519.
43. Li, Y.; Buch, J. S.; Rosenberger, F.; DeVoe, D. L.; Lee, C. S. Integration of isoelectric focusing with parallel sodium dodecyl sulfate gel electrophoresis for multidimensional protein separations in a plastic microfludic network. Anal.
17
CHAPTER 2: Gradient Elution Capillary Electrochromatography using Monolith Stationary Phases on a Microfluidic Device
2.1 Introduction
In capillary electrochromatography (CEC), the mobile phase is driven through separation column or channel by electroosmosis. The velocity of this electroosmotic flow (EOF), ueo
,
can be determined by,u
eo=
ζ ) ) *
η
(2-1)
where ζ is the zeta potential, +,is the permittivity of free space, + is the dielectric
constant of the electrolyte solution, - is the electric field strength and η is the viscosity of the solution. There are important considerations that arise when the mobile phase is driven by EOF as opposed to an applied pressure driven system as in LC. The presence of the electric field will separate molecules by electrophoresis and thus CEC is a
combination of electrophoretic and chromatographic separation mechanisms. The main advantage of CEC over LC is that the flat flow profile of EOF introduces less band broadening than pressure-driven flow.1-2 In addition, velocity of the EOF is independent of column diameter or geometry of the stationary phase support under common operating conditions. This means that very small packing material may be used to improve mass transfer efficiency. The use of pressure-driven flow with this material may be
19
Microfluidic devices are well suited to performing CEC separations due to the ease at which EOF can be precisely controlled.3-4
In early microchip CEC work, an open-channel design was used where the stationary phase was created by simply functionalizing the channel surface.5 Although efficiencies over 500,000 plates/m for isocratic separations were achieved,6 the mass loading capacity of open-channel devices is relatively low.7-8 Reducing the mass of the injected sample is not always feasible as the concentration of analytes may fall below the limit of detection. Mass loading is an especially important consideration when samples are highly complex or when analytes are present over a wide range of concentrations. Consequently, there have been numerous studies focused on increasing the mass loading capacity by incorporating three-dimensional solid supports within the channels to
increase the surface area of the stationary phase. Several different strategies have been explored including packing channels with particles, synthesizing organic or inorganic monoliths, and fabricating micro pillar arrays within the channels. 9
20
and ESI.13-14 There have been many reports on photopolymerized acrylate-based monoliths employed for microchip CEC separations.15-19
Gradient elution in CEC provides the same advantages as in LC, specifically reducing analysis times while increasing the overall resolution and sensitivity. Previously, we have demonstrated gradient elution integrated with MEKC20 and open-channel CEC on microchips.6,8 At the time of this research, all previous microchip CEC with three-dimensional stationary phase supports utilized isocratic mobile phase elution. Some recent research by Watson and coworkers has explored this technique with some success.21 In this chapter, CEC with monolithic stationary phases is combined with gradient elution for improving separations of protein digests.
2.2 Experimental 2.2.1 Reagents
21
Stock buffer solutions were prepared by combining sodium phosphate monobasic and dibasic to give a concentration of 100 mM and a pH of 7. For all experiments, the buffer was diluted with water and acetonitrile to a final concentration of 10 mM.
2.2.2 Sample Preparation
Preparation of fluorescently-labeled peptides was adapted from a previously reported procedure.7 Individual peptides where dissolved in 100 mM sodium bicarbonate (pH 9) at a concentration of 10 mg/mL. For the digest, BSA was dissolved in 100 mM sodium bicarbonate (pH 9) at a concentration of 20 mg/mL, thermally denatured at 80 °C for 45min and then cooled to room temperature for subsequent digestion. Trypsin was dissolved in 100 mM sodium bicarbonate (pH 9) at a concentrated of 2 mg/mL. The BSA and trypsin solutions were then combined at a 40:1 ratio (substrate/trypsin) by weight and allowed to react overnight at 37 °C.
Digest peptide mixtures and single peptides were fluorescently labeled using the following procedure. TRITC was dissolved in dimethyl sulfoxide at 10 mg/mL,
combined with the peptides at approximately a 1:1 molar ratio, and allowed to react between 3-5 hours at room temperature. All peptides were labeled with 5-TRITC except G-P-R and G-F-R, which were labeled with the mixed isomers 5(6)-TRITC. The
22 2.2.3 Microchip Fabrication
Microchips were fabricated from glass substrates (White Crown B-270; Telic Co., Valencia, CA) using standard photolithography, wet chemical etching, and bonding procedures.22 Figure 2-2A shows the basic layout of the channels and reservoirs for the microchip device. Glass cylinders were attached to the access ports at the channel termini using chemically resistant epoxy (Hysol E-120HP; Loctite, Rocky Kill, CT) and were used as fluid reservoirs. The serpentine separation channel incorporated
asymmetric turns to minimize band broadening as previously discussed.23-25 All channels were 13 µm deep and 96 µm wide at full width except for the asymmetric turns that were 37 µm wide at full width and exhibited the expected edge profile of an isotopic etch with good mask integrity. The separation channel was 192 mm in length; however, the
effective separation distance was defined by the point of laser-induced fluorescence (LIF) detection (see microchip operation). The distance from the “T” intersection to the
injection cross was 5 mm. A photograph of the microchip is shown in Figure 2-2B. 2.2.4 Monolith Synthesis
The monolith synthesis within the microchannels was adapted from a previously reported procedure.16 The channels were first functionalized with an acrylate that was later incorporated into the monolith structure during the photopolymerization to provide attachment to the channel walls. The channels were prepared by sequentially flushing with the following solutions: 1 N sodium hydroxide, water, 1 M hydrochloric acid, water, and methanol. The chip was then dried in a vacuum oven at 50 °C for 6 hours. The glass channel walls were functionalized by continuous flushing with 1%
23
volumetric unless otherwise noted. Afterwards, the chip was flushed with dry toluene, and then acetonitrile, before being briefly dried under vacuum.
Figure 2-3 shows the chemical structure of the acrylate monomers and the general mechanism for polymerization.26 The acrylate monomers were filtered through basic activated alumina to remove inhibitors before use. The monomer mixture consisted of 69% butyl acrylate as the hydrophobic monomer, 30% 1,3-butanediol diacrylate as the crosslinker, 0.25% AMPS to provide the negative surface charge, and 0.30%
3-trimethoxysilylpropyl acrylate for enhanced surface attachment and structural stability. This concentration of AMPS corresponds to half the amount stated in the previously reported procedure. The free-radical initiator, AIBN, was added at 0.5% (w/w) of the monomers. The monomer casting solvent was created from 5 mM sodium phosphate (pH 7), ethanol, and acetonitrile in a 1:1:3 ratio. The monomers and casting solvent were then combined at a ratio of 1:2 (monomers : casting solvent). This solution was
sonnicated for 5 min before use to ensure uniform distribution. Note that excessive sonication will heat the solution and initiate free radical production prematurely.
24
phosphate, pH 7 and 75% acetontirile. The distance between the injection cross and the monolith in the separation channel was 1 mm. The microchip was stored with buffer in the channels; however, the reservoirs were filled with water to prevent the acetonitrile from diminishing the epoxy’s structural integrity. The chip was placed in a sealed container to prevent the monolith from drying out when not in use.
2.2.5 Microchip Operation
25
microscope objective (CD-240-M40; Creative Devices, Neshanic Station, NJ), spatially filtered with a 800-µm diameter pinhole, filtered spectrally by a long pass filter (LP02-514RU-25; Semrock, Rochestor, NY), and detected by a photomultiplier tube (R928; Hamamatsu, Bridgewater, NY). The photomultiplier signal was amplified by a low-noise current amplifier (SR570; Stanford Research Systems, Sunnyvale, CA) and read into the computer by a second I/O board (PCI-6251; National Instruments, Austin, TX).
2.2.6 Data Analysis
Peak capacity values were calculated using open source software (Peak Finder, available at http://omics.pnl.gov/software). This program fits the peaks with a Gaussian curve and then calculates the median peak width (4σ). The peak capacity is then
calculated by Equation 1-3 using a resolution of 1. 2.3 Results and Discussion
2.3.1 Photopatterned Monolith Material
Negatively charged porous polymer monoliths were fabricated in glass microchips by photopolymerization of acrylate monomers following established
26
structure. This material has been previously characterized and found to have a average pore size of 1 µm (by mercury porosimetry) and a surface area ~1-3 m2/g (by the BET method).12 As previously noted, the monolith material could be readily removed from the device by thermal decomposition.17 A 6 hr dwell time at 400 °C was sufficient to completely remove the material without damaging the microchip device. Thus a single microchip device could be used to evaluate several different monolith formulations.
By simply masking off areas to be irradiated, the monolith formation was easily localized to the separation channel. There are several advantages to photopatterning the monolith material in the separation channel as opposed to filling the entire device. First, an open sample channel reduces the loading time required for hydrophobic analytes to travel to the injection cross. This is especially important when one desires to load an aqueous sample as often done in gradient elution separations. Secondly, an open injection cross reduces the injection bias based on the analyte’s hydrophobicity.
However, a photopatterned device has both open and monolith filled regions that may lead to significant drawbacks. A change in the surface charge at the interface between the open channel and monolith will result in a different zeta potential and by Equation 2-1 the velocity of the EOF will be different. This difference in EOF will create a pressure gradient that will produce recirculating flow.28-29 It is advantageous to
27
difficult to establish the gated injection scheme. To correct this mismatch in EOF, the amount of AMPS in the monomer solution was reduced to lower the EOF in the
monolith. The new monolith produced an EOF velocity approximately equal to the open-channel regions. This was verified qualitatively by fluorescence imaging of rhodamine B injections.
2.3.2 Isocratic Separations
Although the separation mechanism for electrochromatography is a combination of electrophoresis and chromatography, neutral molecules are separated solely by chromatographic partitioning. As test analytes, four short peptides were chosen that had a net charge after labeling with TRITC near zero. CE separations using an identical microchip without the monolith could not resolve these labeled peptides with a field strength of 0.45 kV/cm. In addition, CEC separations were not able to separate these peptides when the mobile phase contained over 50% acetonitrile. Figure 2-6 shows an isocratic separation of three of these peptides using 30% acetonitrile. Since these
molecules are only separated by chromatographic partitioning, the optimal linear velocity for the mobile phase can be determined by constructing a van Deemter plot. However, there was difficultly in determining the mobile phase velocity in these experiments. In LC experiments, the mobile phase velocity is generally determined by measuring the dead time, meaning the time required for an unretained molecule to elute. Commonly used dead time markers for reversed-phase LC with UV-absorbance detection are hydrophilic, low molecular weight organic molecules that are not charged such as
28
without being charged was not readily available. However, the mobile phase velocity is directly proportional to the applied field strength as shown in Equation 2-1. Figure 2-7A shows that the velocity for each peptide is linearly related to the applied field strength. This data suggests that the mobile phase velocity is also linearly related to the applied field strength. Therefore plotting the plate height as a function of the field strength produces a pseudo-van Deemter plot shown in Figure 2-7B. Although the linear velocity of the mobile phase was not known, the optimum conditions for reducing H could be readily obtained. A separation field strength of 0.38 kV/cm produces the optimum mobile phase linear velocity for these three peptides. Here, the separation efficiency for enkephalin [Met5, Arg6] was 570,000 plates/m, which corresponds to 105,000 plates generated on the device. This efficiency value compares well with previously reported isocratic electrochromatography results using a similar monolith material.17
2.3.3 Gradient Separations
The voltages applied to the buffer A and buffer B reservoirs for gradient
29
Figure 2-9A shows the separation of four TRITC-labeled peptides with a net charge near zero under isocratic elution conditions using 25% acetonitrile. As the solvent strength is increased in subsequent separations, resolution decreased until ultimately all four peptides coelute at 50% acetonitrile shown in Figure 2-9B. Increasing the amount of acetonitrile slightly reduces the EOF as previously observed in CE experiments.30
Figure 2-9C shows the separation of the same analytes employing a mobile phase gradient from 20% to 50% acetonitrile. The resolution between the first two peptides is maintained while the time necessary to elute the later eluting peptides is decreased
considerably. In addition, the last two peptides are greatly focused by the gradient, which increased their signal-to-noise ratio.
A BSA tryptic digest was analyzed to further illustrate the advantage of gradient elution in microchip CEC. Figure 2-10A shows an isocratic separation of the BSA digest using 10% acetonitrile. Many of the earlier eluting peaks are overlapped while the later peaks are quite broad. It is likely that several components either remain on the separation column or their efficiency is so poor that their concentration is below the limit of
30 2.4 Conclusions
Porous polymer monoliths created by the photopolymerization of acrylate monomers are well suited for microchip CEC due to their ease of fabrication and the tunability of their chemical and physical properties. Adjusting the surface charge to balance the EOF between the monolith and open-channel regions largely avoided the drawbacks of pressure driven flow. The ability to perform gradient elution significantly increased the separation power of CEC, leading to high efficiency separations of protein digests. Gradient elution CEC is likely a good candidate to be coupled with CE for 2D microfluidic separations. Future work should also focus on the integration of mass spectrometry detection for comprehensive identification of peptides in complex mixtures. 2.5 Acknowledgements
Use of the Peak Finder software, written by Matthew Monroe, is acknowledged in the following statement. “Portions of this research were supported by the NIH National Center for Research Resources (Grant RR018522), and the W.R. Wiley Environmental
Molecular Science Laboratory (a national scientific user facility sponsored by the U.S.
Department of Energy's Office of Biological and Environmental Research and located at
PNNL). PNNL is operated by Battelle Memorial Institute for the U.S. Department of
31 2.6 Figures
32
Figure 2-2. A) Channel layout for the gradient elution CEC microchip device. B) Photograph of the device with channels filled with ink for contrast. The
33
34
35
36
37
38
39
Figure 2-9. Isocratic and gradient elution CEC separations of peptides. Mobile phase: 10 mM sodium phosphate, pH 7 with A) 25% acetonitrile, B) 50%
40
41
42 2.7 References
1. Bartle, K. D.; Myers, P. Theory of capillary electrochromatograpy. J.
Chromatogr. A 2001, 916, 3.
2. Rathore, A. S. Theory of electroosmotic flow, retention and separation efficiency in capillary electrochromatography. Electrophoresis 2002, 23, 3827.
3. Stachowiak, T. B.; Svec, F.; Frechet, J. M. J. Chip electrochromatography. J.
Chromatogr. A 2004, 1044, 97.
4. Pumera, M. Microchip-based electrochromatography: designs and applications.
Talanta 2005, 66, 1048.
5. Jacobson, S. C.; Hergenroder, R.; Koutny, L. B.; Ramsey, J. M. Open-channel electrochromatography on a microchip. Anal. Chem. 1994, 66, 2369.
6. Kutter, J. P.; Jacobson, S. C.; Matsubara, N.; Ramsey, J. M. Solvent-programmed microchip open-channel electrochromatography. Anal. Chem. 1998, 70, 3291. 7. Gottschlich, N.; Jacobson, S. C.; Culbertson, C. T.; Ramsey, J. M.
Two-dimensional electrochromatography/capillary electrophoresis on a microchip.
Anal. Chem. 2001, 73, 2669.
8. Broyles, B. S.; Jacobson, S. C.; Ramsey, J. M. Sample filtration, concentration, and separation integrated on microfluidic devices. Anal. Chem. 2003, 75, 2761. 9. Peterson, D. S. Solid supports for micro analytical systems. Lab Chip 2005, 5,
132.
10. Viklund, C.; Ponten, E.; Glad, B.; Irgum, K.; Horstedt, P.; Svec, F. ''Molded'' macroporous poly(glycidyl methacrylate-co-trimethylolpropane trimethacrylate) materials with fine controlled porous properties: Preparation of monoliths using photoinitiated polymerization. Chemistry Of Materials 1997, 9, 463.
11. Yu, C.; Svec, F.; Frechet, J. M. J. Towards stationary phases for chromatography on a microchip: Molded porous polymer monoliths prepared in capillaries by photoinitiated in situ polymerization as separation media for
electrochromatography. Electrophoresis 2000, 21, 120.
12. Ngola, S. M.; Fintschenko, Y.; Choi, W. Y.; Shepodd, T. J. Conduct-as-cast polymer monoliths as separation media for capillary electrochromatography.
Anal. Chem. 2001, 73, 849.
43
14. Ro, K. W.; Nayalk, R.; Knapp, D. R. Monolithic media in microfluidic devices for proteomics. Electrophoresis 2006, 27, 3547.
15. Shediac, R.; Ngola, S. M.; Throckmorton, D. J.; Anex, D. S.; Shepodd, T. J.; Singh, A. K. Reversed-phase electrochromatography of amino acids and peptides using porous polymer monoliths. J. Chromatogr. A 2001, 925, 251.
16. Fintschenko, Y.; Choi, W. Y.; Ngola, S. M.; Shepodd, T. J. Chip
electrochromatography of polycyclic aromatic hydrocarbons on an acrylate-based UV-initiated porous polymer monolith. Frensen. J. Anal. Chem. 2001, 371, 174. 17. Throckmorton, D. J.; Shepodd, T. J.; Singh, A. K. Electrochromatography in
microchips: Reversed-phase separation of peptides and amino acids using photopatterned rigid polymer monoliths. Anal. Chem. 2002, 74, 784.
18. Lazar, I. M.; Li, L. J.; Yang, Y.; Karger, B. L. Microfluidic device for capillary electrochromatography-mass spectrometry. Electrophoresis 2003, 24, 3655. 19. Faure, K.; Bias, M.; Yassine, O.; Delaunay, N.; Cretier, G.; Albert, M.; Rocca, J.
L. Electrochromatography in poly(dimethyl)siloxane microchips using organic monolithic stationary phases. Electrophoresis 2007, 28, 1668.
20. Kutter, J. P.; Jacobson, S. C.; Ramsey, J. M. Integrated microchip device with electrokinetically controlled solvent mixing for isocratic and gradient elution in micellar electrokinetic chromatography. Anal. Chem. 1997, 69, 5165.
21. Watson, M. W. L.; Mudrik, J. M.; Wheeler, A. R. Gradient elution in microchannel electrochromatography. Anal. Chem. 2009, 81, 3851.
22. Jacobson, S. C.; Hergenroder, R.; Koutny, L. B.; Ramsey, J. M. High-speed separations on a microchip. Anal. Chem. 1994, 66, 1114.
23. Griffiths, S. K.; Nilson, R. H. Low dispersion turns and junctions for microchannel systems. Anal. Chem. 2001, 73, 272.
24. Molho, J. I.; Herr, A. E.; Mosier, B. P.; Santiago, J. G.; Kenny, T. W.; Brennen, R. A.; Gordon, G. B.; Mohammadi, B. Optimization of turn geometries for microchip electrophoresis. Anal. Chem. 2001, 73, 1350.
25. Ramsey, J. D.; Jacobson, S. C.; Culbertson, C. T.; Ramsey, J. M. High-efficiency, two-dimensional separations of protein digests on microfluidic devices. Anal. Chem. 2003, 75, 3758.
26. Legido-Quigley, C.; Marlin, N. D.; Melin, V.; Manz, A.; Smith, N. W. Advances in capillary electrochromatography and micro-high performance liquid
44
27. Jacobson, S. C.; Koutny, L. B.; Hergenroder, R.; Moore, A. W.; Ramsey, J. M. Microchip capillary electrophoresis with an integrated postcolumn reactor. Anal.
Chem. 1994, 66, 3472.
28. Potocek, B.; Gas, B.; Kenndler, E.; Stedry, M. Electroosmosis in capillary zone electrophoresis with nonuniform zeta-potential. J. Chromatogr. A 1995, 709, 51. 29. Rathore, A. S.; Horvath, C. Axial nonuniformities and flow in columns for
capillary electrochromatography. Anal. Chem. 1998, 70, 3069.
CHAPTER 3: Hybrid 2D Liquid Chromatography-Capillary Electrophoresis with Laser-Induced Fluorescence Detection
3.1 Introduction
The Jorgenson group reported the first online system for comprehensive LC-CE separations.1 This system utilized a 6-port valve and sample loop to interface the LC column and CE capillary. The valve was setup such that fresh buffer was presented to the CE capillary while the LC effluent filled the sample loop. To perform CE injections, the CE voltage was turned off and the valve was actuated to deliver the LC effluent in the sample loop to the CE capillary. After a short electrokinetic injection at low voltage, the valve was actuated to again present buffer to the CE capillary and the CE voltage was restored. All of the LC effluent in the sample loop was not injected but rather a very small fraction. The CE injections were performed frequently such that a fraction of every LC peak was injected at least once into the CE dimension. The large dead volume
associated with the valve and loop setup prompted the same group to develop a
46
low voltage. The transverse flow and the CE voltage were then turned back on to perform the CE separation. Additional modifications to this basic interface have improved performance and ease of use.3
One challenging aspect of the transverse flow gating system was that it relied upon the precise alignment of the LC and CE capillaries. The gap between the capillaries must be within tens of microns to prevent excessive dilution of the LC effluent before it reaches the CE capillary. More recently, Bergstrom and coworkers partially addressed this issue by designing a microfabricated interface from polydimethylsiloxane.4-5 This created a confined region between the LC and CE capillaries to reduce the dilution of the LC effluent when performing CE injections. Unfortunately, this benefit was largely rescinded by the fact these injections were transported back to a capillary for the CE separation. The band broadening that occurs in the interface/CE capillary connection is much more critical than the LC capillary/interface connection due to the much smaller volumes of the CE peaks.
47
speed and efficiency. For example, our group has demonstrated that microchip CE can generate over 18,000 plates/s which resulted in a peak capacity of 48 in only 0.8 s.7
The greatest challenge in a hybrid LC-CE system is overcoming the large dead-volume usually associated with transferring fluid from capillaries to microfluidic devices. If this can be overcome, a system would combine state of the art LC separations
performed in capillaries at ultra high pressures with the speed and efficiency of microchip CE would be feasible. Yang and coworkers reported a hybrid system that coupled
capillary-based LC with microchip-based CE.8 They were able to couple a 250 µm i.d. capillary LC column operated at a flow rate of 1.5 µL/min to a simple cross channel microchip using a pinched injection scheme.9 However, this injection scheme does not allow for rapid consecutive CE injections due to the time required to load sample at the injection cross after each injection.
48 3.2 Experimental
3.2.1 Reagents
Water used in this experiment was deionized and filtered (Nanopure Diamond, Barnstead International, Dubuque, IA). The following materials were purchased from Fisher Chemicals (Fairlawn, NJ): acetone (HPLC grade), acetonitrile (HPLC grade), acetic acid (HPLC grade), tetrahydrofuran (HPLC grade). The following materials were obtained from Sigma Chemical Co. (St. Louis, MO):
1,2-bis(3-aminopropylamino)ethane, bovine serum albumin, cytochrome c from horse heart, epichlorohydrin, formic acid (Acros Organics, 99%), trypsin from bovine pancreas, and rhodamine B. The 5-TRITC was purchased from Molecular Probes (Eugene, OR). The Kasil 2130 potassium silicate solution can be obtained from PQ Corp. (Valley Forge, PA). The PolyE-323 polymer was synthesized as previously described, adjusted to pH 7 with acetic acid, and diluted with water to 15% (by mass) polymer.10
3.2.2 Sample Preparation
Proteins were digested with trypsin and labeled with 5-TRITC as described in Chapter 2 and frozen until needed. Just prior to experiments, the digest was diluted with an aqueous solution of 0.1% (v/v) formic acid and 3% (v/v) acetronitrile to a final concentration of 1 µM.
3.2.3 Capillary LC Column
49
ratio of Kasil 2130 to formamide.11 The 2.5 µm diameter porous particles (X-Bridge C18, Waters Corp., Milford, MA) were suspended in tetrahydrofuran at 2.5 mg/mL and sonicated briefly. This slurry of particles was forced into the capillary at a pressure of 2000 bar using a previously described apparatus12 with an updated capillary fitting.13 After a sufficient length of the capillary was packed, the column was flushed with
acetonitrile and then water. A temporary inlet frit was formed with a heated wire stripper while the column was flushed with an aqueous solution at a pressure of 700 bar. The packed capillary was cut to a length of 54 cm and a new inlet frit was prepared using the same sol-gel fused microfiber procedure mentioned above.
3.2.4 Capillary-to-Microchip Fittings
Fittings were developed to connect capillary tubing to microchips. Photographs of the fittings are displayed in Figure 3-1. A C-clamp was used to compress a modified LC fitting against a microchip. The C-clamp was machined from an 8-mm square stainless steel rod cut to a length of 20 mm. A 3-mm-wide slot was cut in one end of the rod to accept the microchip. A hole was drilled perpendicularly to the slot and tapped to match the thread of the fitting assembly. The fitting assembly consisted of a
polyetheretherketone nut (F121-H, Upchurch Scientific, Oak Habor, WA) modified to hold a stainless steel coned insert. The cone of the insert was used to press a
50
checked by inspecting the capillary’s position through the hole drilled in the bottom of the C-clamp.
3.2.5 Microchip CE Device
Figure 3-2A shows a schematic of the simple cross channel microchip used for 2D LC-CE separations. Microchips were fabricated from 150-µm-thick glass substrates (Corning 0211 borosilicate, Erie Scientific Co., Portsmouth, NH) by standard
photolithography, wet-chemical etching, and bonding procedures.14 Microchips were attached to 0.9-mm-thick glass with UV epoxy (68, Norland Products Inc., Cranbury, NJ) to provide greater structural support. The 4-cm-long CE channel was 7 µm deep and 65 µm wide at full width as measured by profilometry (P15, KLA, Tencor Corp., San Jose, CA).