FORMAL LABORATORY REPORT
Prelab Before coming to the lab each student must be prepared. It is expected that each student has completed all pre-lab activities such as reading the lab handout and/or relevant material in the textbook or answering assigned questions.
Paper 8½" x 11" (21.5 cm x 27.5 cm) white lined paper or letter paper. The report should be single spaced with 12 pt Times Roman font. There should be a 1 inch margin on all sides of the pages.
Title Page The title page should include the following items: a title centered 1/3 from the top of the page; an identification containing the student's name, lab partner’s name, course number, due date, and teacher's name located at the bottom right hand corner of the page.
Objective The objective is a concise statement outlining the purpose of the experiment. e.g. To determine the boiling point of H2O
Introduction The introduction should contain any prior knowledge on which the experiment is based; including an explanation of principles, definitions, experimental techniques, expected results (hypothesis), theories and laws.
Materials The materials section is a list of all equipment, reagents (chemicals), and computer programs that were used to complete the experiment. Drawings of the apparatus setup should be included in this section if needed.
Procedure The procedure is a detailed statement (step by step) of how the experiment was performed such that the experiment could be repeated using your report. Safety precautions which were followed should be stated. The procedure must be written in the impersonal (3rd person) past tense: e.g. We are taking the temperature every 2 minutes. V
The temperature was taken every 2 minutes. U
Results This section may consist of quantitative and/or qualitative observations of the experiment.
Quantitative Results Graphs and Tables
When graphs are required, special attention should be paid to the following items: the type of graph expected (straight line or curve), utilizing the entire graph paper, plotted point size, title of the graph, and axis labels. When numerous measurements have occurred, data is to be placed in a data table whenever possible. Figure headings are placed below the figure and should give a short description of the figure. The figure number should be in bold print. Table headings are found above the table and should also have a brief description. The table number is also in bold print.
Calculations
One example of each type of calculation should be included. Results from numerous calculations should be placed in a data table with the proper number of significant figures and correct units.
% yield and % error calculations should be included when possible % yield = actual yield x 100
theoretical yield
% error = theoretical value-experimental value x 100 theoretical value
Qualitative Results Observations
This is a qualitative written description and/or sketch of what was seen during the experiment. It may be in the form of a table or simply a written description.
Conclusion The conclusion is a concise statement that answers the objective. The result of percent error and/or percent yield should be discussed and compared with known results. A portion of the conclusion should be dedicated to error analysis which discusses any possible sources of error that may have contributed to the percent error or yield. The conclusion should be written in the impersonal past tense.
Literature Cited
Any information borrowed from another source which is not common knowledge must be cited within the text of the report as outlined in the “Directions for Preparing Formal Papers at Three Oaks” as provided by the English Department. All sources of information are to be listed in the Literature Cited section of the lab report in alphabetical order in the format suggested in the for-mentioned section of the student agenda. This section should be on a separate final page of the report.
Questions Although questions are not part of a formal lab report, they should be answered on a separate sheet of paper and attached to the report where applicable.
Important Reminders for a Lab Report
1) Spelling
2) Significant figures and units regarding measurements and calculations 3) Avoid personal pronouns
4) Headings should stand out and each section should be separated by 1 line
5) Neatness counts -> use rulers when needed (especially when using tables and graphs), type if possible
Do not copy verbatim (word for word) from the lab handout or any other
source. This is plagiarism and would result in a zero mark and possible
further consequences.
Lab #1
Boiling Point of Water
John Smith
Jane Jones
Science 421
Objective
To determine the boiling point of water.
Introduction
Kinetic theory states that all molecules in matter are in constant motion (Kane and Sternheim, 1984). As these molecules absorb more energy they have a higher amount of random movement. As energy is absorbed in the form of heat the average kinetic energy (temperature) of the molecules will increase except during a phase change. The absorbed energy used in the phase change breaks the attractive forces between the molecules, thus transformation occurs in the orientation of the molecules. An example of a phase change would be the boiling point of water which is a change from a liquid to a gas. This can be observed by using a temperature versus time line graph when the slope becomes zero (plateau) The boiling point of water is expected to be 100.00 o
C (Merck, 1976).
Materials
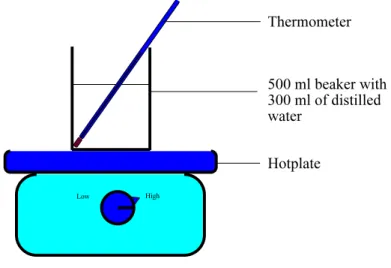
500 ml beaker, distilled water, thermometer, hot plate, Word Perfect 11.1
Procedure
The required materials were selected and taken to the workstation. The beaker was filled with approximately 300 ml of distilled water. The beaker was gently placed on the hotplate. The thermometer was placed in the beaker and the initial temperature was recorded. The hotplate was switched on to high. The temperature was recorded every 2 minutes until 6 minutes after boiling began. The hotplate was turned off and the materials were allowed to cool for at least 10 minutes before the equipment was dismantled.
Results
Quantitative Results
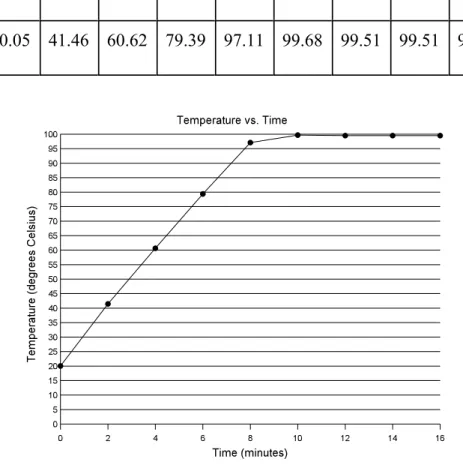
Table 1 Graph displaying data obtained from the heating of water from 0 to 16 minutes. Time
(minutes)
0 2 4 6 8 10 12 14 16
Temp (o
C)
20.05 41.46 60.62 79.39 97.11 99.68 99.51 99.51 99.51
Figure 2. A line graph of temperature versus time of the data obtained in Table 1. Calculation of percent error:
% error = theoretical value - experimental value x 100 theoretical value
= 100.00 o
C - 99.51 o
C x 100 100.00 o
C
= 0.49 o
C x 100 100.00 o
C
Qualitative Results
Numerous small bubbles formed at the bottom of the beaker at 70.6 o
C. The size and rate of bubble formation increased as the temperature increased. At 100.0 o
C the rate and size of bubble formation remained constant. At that temperature, there was constant production of steam.
Conclusion
It was determined from the data plotted in the temperature versus time graph (Figure 2) that the boiling point of water is 99.51 o
C. This concurs very closely with the stated hypothesis, therefore the experiment was deemed a success. The percent error was found to be 0.49%. Possible sources of error could have involved impurities in the water and human error in reading the thermometer. Possible sources of the impurities in the water are chemicals from dirty glassware. Improvements would include more accurate thermometers, clean equipment and proper reading of the thermometer.
Literature Cited
Kane, Joseph W. and Morton M. Sternheim. Physics. New York: John Wiley & Sons, 1984 ed.
Merck, Josef. Merck Index of Chemical Constants. New