A SYSTEMATIC REVIEW AND APPLICATION OF INDICATOR SELECTION METHODS FOR MONITORING WATER, SANITATION, AND HYGIENE IN
SCHOOLS
Stefanie Mei Schwemlein
A thesis submitted to the faculty at the University of North Carolina at Chapel Hill in partial fulfillment of the requirements for the degree of Bachelor’s of Science in Public
Health in the Department of Environmental Health Sciences in the Gillings School of Global Public Health.
Chapel Hill April 2014
Approved by:
_________________________________
Dr. Jamie Bartram (advisor) Dr. Jill Stewart
ABSTRACT
STEFANIE MEI SCHWEMLEIN: A Systematic review and application of indicator selection methods for monitoring water, sanitation, and hygiene in schools
(Under the direction of Jamie Bartram)
Monitoring of water, sanitation, and hygiene (WaSH) is necessary to track
progress, improve accountability, and demonstrate impacts of efforts to improve WaSH
conditions and services. Particularly in low-resource settings, there is currently no
standard method for selecting WaSH indicators, which are necessary for robust
monitoring and evaluation. To address this need, we first conducted a systematic
literature review of existing indicator selection methods used in environmental science,
international development, and other related fields. Based on findings from the
systematic review, we then developed a WaSH indicator selection method, which
includes the following stages: (1) defining concepts and purpose; (2) selecting and
justifying a conceptual framework; (3) developing a list of candidate indicators; (4)
determining selection criteria; (5) scoring indicators against criteria; and (6) selecting the
final suite of indicators. Finally, this method was applied to the selection of indicators for
school WaSH, and these final twenty indicators were organized into an
input-output-outcome-impact framework. The resulting suite of school WaSH indicators provides a foundation for coordinated monitoring, identifies focus areas for resource allocation, and
ACKNOWLEDGEMENTS
I would like to thank my advisor, Dr. Jamie Bartram, who provided guidance,
feedback, and vision on the development and completion of this paper. I would also like
to thank Drs. Jackie MacDonald-Gibson and Jill Stewart for their feedback and advice
throughout the writing of this paper. Their suggestions, along with those of my
classmates in their Water and Health Communication course, transformed this project
from a series of disparate parts into a coherent whole. Additionally, this project would not
be complete without the Health Sciences Librarian Mellanye Lackey’s early suggestions
regarding survey design and systematic literature review methods. I would also like to
thank Georgia Kayser, who provided valuable and substantive feedback on a draft of the
paper. Finally, I would like to acknowledge Ryan Cronk for his support and advice on
this project, which would not have been possible without his insight and superb office
TABLE OF CONTENTS
LIST OF TABLES... 5
LIST OF FIGURES... 5
INTRODUCTION... 6
METHODS... 9
RESULTS... 14
DISCUSSION ... 25
CONCLUSION ... 28
APPENDIX 1: LIST OF POTENTIAL INDICATOR SELECTION CRITERIA ... 30
APPENDIX 2: SELECTION CRITERIA QUESTIONNAIRE ADMINISTERED TO WI RESEARCHERS ... 32
APPENDIX 3: LIST OF CANDIDATE INDICATORS IDENTIFIED IN THE LITERATURE ... 37
APPENDIX 4: SCORING OF INDICATORS AGAINST SELECTION CRITERIA …...…. 43
LIST OF TABLES
1. Definitions of methods catalogued from indicator selection literature
2. Characteristics of studies included in the review, grouped by field of study
3. Criteria used for the evaluation of candidate indicators, with descriptions
4. Final list of indicators, after scoring and final selection
LIST OF FIGURES 1. Literature search flow diagram
2. Number of references included in review, grouped by field of study
3. Number of studies using each method for indicator selection, grouped by field of study
4. Method for selection of WaSH indicators
5. Conceptual framework for school WaSH indicators
1. INTRODUCTION
The United Nations (UN) Millennium Development Goal 2.A recognizes the
objective to “ensure that, by 2015, children everywhere, boys and girls alike, will be able
to complete a full course of primary schooling” (UN, 2000). Adequate water, sanitation,
and hygiene (WaSH) facilities in school settings are a basic foundation for achieving this
goal. Schools are of particular importance because many positive hygiene behaviors are
learned in this setting, and those lessons lead to improved hygiene outside the classroom,
contributing to long-term improvements in hygiene practices. Further, improved WaSH
conditions in school settings reduces the risk of disease spread from children to families,
contributing to reduced disease burden in the wider community (Adams et al., 2009).
Effects of school WaSH on health, education, and equity outcomes have been
documented. The health impacts of poor school WaSH conditions are numerous,
including higher rates of infectious, gastrointestinal, neuro-cognitive and psychological
illnesses (Jasper et al., 2012). These WaSH-related health outcomes have been reported
to reduce children’s education outcomes, contributing to absenteeism, impaired cognitive
abilities, and lowered school performance (GLAAS, 2013). Further, school WaSH is
associated with equity across gender and disability in the classroom. When sanitation
facilities are made available 11% more girls attend school (WHO, 2002). Additionally, in
schools where easily accessible facilities are not available, children with disabilities often
avoid eating and drinking to avoid needing the toilet, which eventually contributes to
their dropping out of school (Adams et al., 2009). This places an additional economic
burden on the families of disabled children, further compounding inequality. These
school WaSH conditions (Lee, Rosenzweig, and Pitt, 1997; Jasper et al., 2012).
In response to the importance of WaSH access in schools, the UN identified
provision of universal access to safe drinking water to schools as a primary objective for
the post-2015 development agenda (UN, 2013). Despite the proposed focus on school
WaSH in the UN post-2015 development agenda, monitoring against relevant standards
and guidelines in school settings remains a challenge. Monitoring of school WaSH
conditions is necessary to track progress, improve accountability, and demonstrate
impact. Monitoring is also vital for informing policy development and resource
investment. However, stakeholders often do not allocate adequate financial resources
implement robust WaSH program monitoring (Kusek and Rist, 2004). As a result, efforts
to benchmark and report accurate data on the status of school WaSH are limited. There is
a considerable need to improve the quality and coordination of monitoring in order to
identify weaknesses in data collection and to inform future decisions in policy and
practice.
To improve quality and coordination of monitoring in school WaSH, it is
necessary to develop a structured process for data collection based on a set of indicators.
Lorenz (2001) describes such an indicator set as “[an] aggregation of variables [that]
describes a system or process such that it has significance beyond the face value of its
components.” A carefully constructed suite of indicators can therefore be useful for
policymakers and other stakeholders because “they can provide valuable information on
complex issues in a relatively accessible way.” (Niemeijer and de Groot, 2008).
readily apparent, and (2) they simplify information about complex phenomena to improve
communication. However, there is currently no rigorous and standardized method for
WaSH indicator selection, which can “make it difficult to validate the information
provided by those indicators” (Dale and Beyeler, 2001). The development of a rigorous
and transparent method for indicator selection is therefore necessary for meaningful and
credible monitoring of school WaSH.
In response to the need for improved monitoring of school WaSH, this review
aims to develop a standard method for the selection of school WaSH indicators. To this
end, a systematic literature review is conducted of existing indicator selection methods
used in environmental science and ecology, international development, water
management, and other related fields. Based on the results of this review, an indicator
selection method is constructed, tailored to the needs of the school WaSH sector. Finally,
2. METHODS
2.1. Systematic Literature Review 2.1.1. Literature search strategy
Published, peer-reviewed literature were screened in October 2013 using the
following electronic databases: PubMed; Web of Science; Global Health; and Academic
Search Complete. The search was based on the keyword string: “indicator* AND
selection AND criteria AND (environment* OR development OR public health OR
water).” The search was restricted to papers for which there was an abstract and full
article available in English.Papers were included in the review if they presented an
analysis of indicators in the fields of environment, international development, and water.
Papers were included only if they elaborated on the methods used to identify, select,
and/or validate indicators. Studies comprising of analysis of clinical or biological
indicators (e.g., fecal indicators, biomarkers, human samples) were excluded.
Dissertations and non-peer reviewed literature are not included in the review. The search
had no restrictions on time or location.
After the initial electronic database search was conducted, reference titles were
screened, and then an abstract screening was conducted. Full-text articles of selected
references were reviewed, and articles that met inclusion and exclusion criteria were
included for analysis.
2.1.2. Characteristics included in the assessment
Methods for indicator selection cataloged from included references are listed in
Table 1. Characteristics were not pre-determined by the authors; rather, each method was
Table 1: Definitions of methods cataloged from indicator selection literature
Method Definition
Defining the purpose of the indicator suite
The concept being measured by the indicator suite is explicitly defined
Bellagio Principles Authors reference the Bellagio Principles, a set of guidelines for sustainability assessment and indicator design (Hardi and Zdan, 1997)
Theoretical/conceptual framework
Organizational structure to categorize indicators; Provides the basis for the selection and combination of variables into a meaningful composite under a fitness-for-purpose principle (OECD, 2008)
Literature review for initial indicators
Preliminary list of indicators is constructed following a thorough literature review of existing indicators for the concept in question
Determining selection criteria A list of quality criteria by which the initial list of indicators should be screened is defined
Rating selection criteria by importance or relevance
Selection criteria are rated or ranked into a weighting scheme (either qualitative or quantitative) that reflects the importance of each criterion
Scoring indicators against selection criteria
Each initial indicator is scored based on the extent to which it meets the defined selection criteria
Delphi Technique Delphi Technique is a method to extract opinion from experts through the distribution of a series of questionnaires, without having the experts congregate at an agreed time and place (Delbecq et al. 1975). Experts are allowed to assess, modify and change components/ indicators provided in the
conceptual framework. Consulting panel of experts or
other stakeholders (not including Delphi Technique)
Experts or other stakeholders in the field of study are consulted for input on appropriateness of indicators, frameworks, and/or methods used
Final indicator selection Based on results from the criteria screening, stakeholder/ expert feedback, or some other criteria, a final suite of indicators is selected from the initial list
Application of methods in pilot test or case study
2.2. Selecting Indicators for School WaSH
A method for selecting WaSH indicators was developed following analysis of the
systematic literature review results (See Section 3.1.2.). Methodological stages were
chosen based on identified needs and frequency of use in studies included in the
systematic review. The chosen methods were then applied to the selection of a suite of
school WaSH indicators. The methods are detailed below.
2.2.1. Define Purpose and Scope
To produce an effective and meaningful suite of indicators, it is necessary to
define the concept of interest and establish the purpose and scope of the indicator suite
(Niemeijer and de Groot, 2008). This stage helps to frame the subsequent methods by
establishing a precisely defined set of goals and to avoid selecting indicators only
tangentially related to the concept. The concept and purposes may be broadly or narrowly
defined, depending on user needs and the intended audience.
2.2.2. Select and Justify a Conceptual Framework
The purpose of a conceptual framework is to provide organizational structure for
categorizing and combining indicators in a logical and useful way (OECD, 2008). Ostrom
(2011) suggests that one major aim of a conceptual framework is to “identify the
universal elements that any theory relevant to the same kind of phenomena (in this case,
school WaSH) needs to include.” Ostrom further notes that the role of frameworks in not
only to identify individual indicators but to determine “general relationships among these
elements that one needs to consider for institutional analysis” [emphasis added].
diverse and confusing; as such, a framework is needed to structure information “to make
it more accessible and intelligible to decision-makers and the general public.”
To determine an appropriate conceptual framework, existing monitoring models
and frameworks were reviewed. Models reviewed include those used in health behavior,
international development, WaSH, and human rights. The final framework was
developed based on its appropriateness to the context of school WaSH programs.
2.2.3. Develop a list of candidate indicators
Candidate indicators were extracted through a literature review of existing school
WaSH indicators and other relevant school WaSH literature.
2.2.4. Determine the selection criteria
A set of selection criteria was generated using a methodology adapted from
Gudmundsson (2010). First, a list of potential selection criteria was generated following a
review of indicator selection criteria described in the literature. A list of potential criteria
is included in Appendix 1. WaSH researchers at the UNC Water Institute (WI) were
contacted to solicit feedback on the list of potential criteria based on clarity and relevance
to WaSH. The WI researchers were provided with the list of potential screening criteria
and definitions; then they were prompted to respond to a series of questions concerning
the clarity and relevance of each of the selection/screening criteria. The questions were as
follows:
1. Do you understand the criterion?
2. Do you think the criterion is relevant for the selection of WaSH indicators? 3. Do you find a need for more detail to assess the relevance of this criterion? 4. Does this criterion overlap significantly with other criteria? If yes, list the criteria
A copy of the administered questionnaire is included in Appendix 2. Answer choices
were limited to yes or no, followed with an opportunity to provide open-ended comments
about the exercise or about the potential criteria.
Based on the feedback from WI researchers, a final list of selection criteria was
determined. Where the researchers suggested a need for more detail, criteria were
re-evaluated and definitions were refined. Where criteria were thought to overlap with
others, the offending criteria were clarified or consolidated into a single criterion. Criteria
considered irrelevant for the selection of WaSH indicators were removed from the list.
2.2.5. Score indicators against criteria
The adopted selection criteria (Table 3) were used to screen the list of candidate
indicators. Each candidate indicator was scored for its suitability in relation to each
criterion. The indicator was assigned a score of 0 (zero) if the indicator does not meet the
selection criterion, or 1 (one) if the indicator does meet the selection criterion. A score of
0.5 was assigned if the indicator meets the selection criteria in some instances and not in
others, or if reviewer was unsure of the appropriate response.
2.2.6. Select final suite of indicators
Based on the indicator scoring results, a final selection of indicators was chosen.
In order to obtain a final suite that included a relatively even spread of indicators across
each framework category (i.e., inputs, outputs, outcomes, impacts; see Section 3.2.2.),
only the indicators that received scores at least one standard deviation above the mean
3. RESULTS
3.1. Systematic Literature Review 3.1.1. Search results
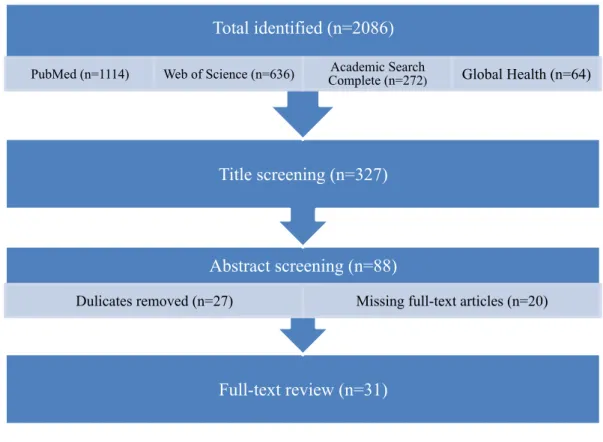
The primary literature search yielded 2,086 references, with the majority of
results obtained from PubMed (n=1114, 53.4%). Screening based on reference title
identified 327 potentially relevant results. A secondary screening of abstracts found 152
potentially relevant papers; 88 remained after removing duplicates (27) and references for
which the full-text article was not available online (20). Thirty-one references were
included after the final, full-text screening. A flow diagram illustrating the review is
included in Figure 1.
Figure 1: Literature search flow diagram. N indicates the number of studies remaining after each identification or review stage.
Full-text review (n=31) Abstract screening (n=88)
Dulicates removed (n=27) Missing full-text articles (n=20)
Title screening (n=327) Total identified (n=2086)
3.1.2. Characteristics of studies included in review
Of the 31 papers included in the review, 16 presented methods for indicator
selection in the fields of ecology and environment (52%); nine papers dealt with issues of
energy and international development (29%); and the remaining six were specific to
water management and WaSH (19%) (Figure 2).
Figure 2: The thirty-one studies included in the review were classified as belonging to one of three broad categories based on field of study.
The included studies aimed to measure a variety of complex concepts and used a
range of frameworks to organize indicator sets. Ten studies attempted to measure the
sustainability of a system or sector (32%). Framework types frequently used to organize
indicator suites include the Driving forces-Pressures-State-Impact-Response (DPSIR)
(n=5), Social-Economic-Ecologic/Environment (SEE) (n=7), and
Pressure-State-Response (PSR) (n=2). Ten studies developed unique frameworks specific to the factor or
concept that the indicator suite aimed to measure (32%). Six studies did not use or Ecology and
environment, 16 Energy and
development, 9
recommend using a framework for structuring indicators (19%). The specific factors
measured and framework types used by each included study are summarized in Table 2.
Table 2: Characteristics of studies included in the review, grouped by field of study.
Study Reference Number Factor measureda Framework typeb,c
Ecology and Environment
Breckenridge et al.
(1995) Ecological conditions of rangelands FS
Dinsdale and Harriott
(2004) Anchor damage; coral reef health FS
Doren et al. (2009) Ecosystem health Mod DPSIR
Fontalvo-Herazo et al.
(2007) Marine and coastal system health FS
Gomontean et al.
(2008) Forest ecosystem health FS
Lebacq et al. (2013) Sustainability of livestock systems Mod SEE
Maes et al. (2011) Effects of forest management FS
Malecki et al. (2008)
Environmental public health surveillance
system capacity -
Monroy-Ortiz et al. (2009)
Importance of plant species to local
conservation FS
Niemeijer and de
Groot (2008) State of the environment Mod DPSIR
Rice and Rochet
(2005) Ecosystem effects of fishing -
Rubio and Bochet
(1998) Desertification risk -
van Oudenhoven et al. (2012)
Effects of land management on ecosystem
services Mod DPSIR
Zalidis et al. (2004)
Environmental state and impacts of land
use and management Mod DPSIR
Zhen and Routray
(2003) Sustainability of agricultural systems SEE Zucca (2012) Land degradation and desertification DPSIR
Energy and Sustainable Development
Afgan et al. (2000) Sustainability of energy systems Mod SEE
Bobbitt et al. (2005) Well-being, public health FS
Buchholz et al. (2009) Sustainability of energy systems SEE Castillo and Pitfield
a “Factor measured” refers to the issue or topic that the indicators in the study aim to measure.
b “Framework type” refers to the organizational model used to structure the indicator suite. The specific
framework details were extracted then categorized by the types that were found.
c “FS” = factor-specific = study developed a unique framework specific to the factor or concept being
measured; “Mod” = modified version of framework type listed; “DPSIR” = Driving forces-Pressures-State-Impact-Response (Smeets and Weterings, 1999; OECD, 1999, 2001; Hammond et al., 2005); “SEE” = Social-Economic-Environmental/Ecologic (Elkington, 1994); “PSR” = Pressure-State-Response (OECD, 1993); “-” = framework not provided in the study.
!
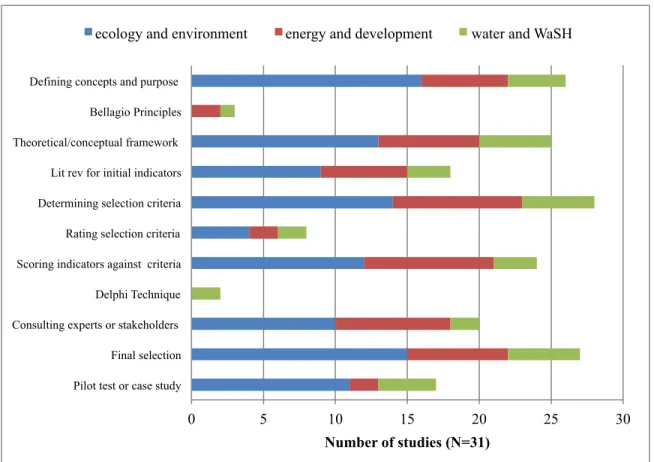
Eleven methodological characteristics were catalogued for each study: defining
the purpose of the indicator suite (n=26); using Bellagio Principles (n=3); constructing a
theoretical or conceptual framework (n=25); conducting a literature review to find the
initial list of indicators (n=18); determining a set of selection criteria (n=28); rating
selection criteria by relevance or importance (n=8); scoring indicators against the
selection criteria (n=24); applying the Delphi Technique (n=2); consulting a panel of
experts or stakeholders any time throughout the selection process (n=20); making a final
selection based on screening or feedback (n=27); and applying the methods in a pilot test
or case study (n=17) (Figure 3). The highest number of methodological characteristics
used in a single paper was nine (Bobbitt et al., 2005; Gomontean et al., 2008); Maes et Corbière-Nicolliera et
al. (2011) Sustainability of energy systems SEE
Doody et al. (2009) Sustainable development -
Joumard et al. (2011) Environmental impact (transport sector) Mod PSR Kurka and Blackwood
(2013) Sustainability of energy systems Mod SEE
Tanguay et al. (2013) Sustainability of tourism industries SEE
Water Management and WaSH
Garfi and Ferrer-Marti (2011)
Conditions of rural water and sanitation
projects in developing countries Mod SEE Garriga and Foguet
(2010) Water stress and scarcity FS
James et al. (2012) Water quantity FS
Juwana et al. (2010 a,
b) Sustainability of water resources FS
Lorenz et al. (2001) Pressures on river ecosystems Mod PSR Singhirunnusorn and
Stenstrom (2009)
Appropriateness of wastewater treatment
al., 2011), and the lowest was four (Doody et al., 2009; Garriga and Foguet (2010); Rubio
and Bochet, 1998; Zalidis et al., 2004). A description of each catalogued characteristic is
provided in Section 2.1.2.
Figure 3: Number of studies using each method for indicator selection, grouped by field of study (indicated by color).
0 5 10 15 20 25 30
Pilot test or case study Final selection Consulting experts or stakeholders Delphi Technique Scoring indicators against criteria Rating selection criteria Determining selection criteria Lit rev for initial indicators Theoretical/conceptual framework Bellagio Principles Defining concepts and purpose
Number of studies (N=31)
3.2. Selecting Indicators of School WaSH
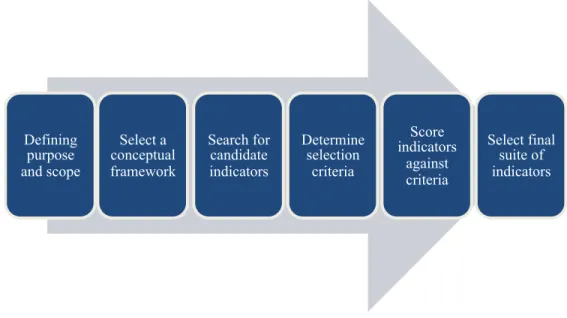
The final method for school WaSH indicator selection was constructed based on an
analysis of the results of the literature review (Section 3.1). Methodological stages were
chosen based on identified needs and frequency of use in studies included in the
systematic review. An outline of the final method is included in Figure 4.
Figure 4: Method for selection of school WaSH indicators.
3.2.1. Purpose of indicator suite
In constructing of a suite of school WaSH indicators, the aim is to identify a set of
elements that, when taken together, reflect the state of WaSH in school settings on the
national level. This proposed tool for measuring and communicating the overall state of
school WaSH can be used by national decision-makers, non-governmental organizations,
and local stakeholders to better coordinate monitoring, to identify focus areas for
resource allocation, and to highlight needs for policy development.
3.2.2. Conceptual Framework
Defining purpose and scope
Select a conceptual framework
Search for candidate indicators
Determine selection
criteria
Score indicators
against criteria
The conceptual framework selected for school WaSH indicators is a modified
version of the “health behavior” logic model presented in the 2011 Monitoring,
Evaluation and Review of National Health Strategies, developed by the World Health
Organization and the International Health Partnership+ (IHP+) and other international
organizations (IHP and WHO, 2011). The framework is composed of four sections: (1)
inputs, (2) outputs, (3) outcomes, and (4) impacts (Figure 5).
Figure 5: Conceptual framework for school WaSH indicators (WHO, 2011).
The first section, inputs, includes national-level strategies and investments made
into the school WaSH sector. This category reflects the state of national school WaSH
policy, financing, standards and guidelines, planning, and monitoring. The second
section, outputs, refers to “direct product[s] of program activities that program providers
have direct control over” (World Bank, 2006). Indicators in this category focus on
programmatic aspects of school WaSH (e.g., % of schools with access to an improved
water source) and are reflective of international standards and guidelines (e.g., JMP
definition of “improved” source/facility). The third section, outcomes, refers to
conditions that indicate program success or failure in meeting short-term goals of
population behavioral change and utilization of services and facilities. Indicators in this
category monitor “changes in behaviors, knowledge and actions among participants as a
result of the program” (World Bank, 2006). The final category, impacts, refers to
“fundamental changes experienced by program beneficiaries as a result of the program.”
These include long-term objectives for health, education, and overall effectiveness of the
program to achieve development objectives and goals.
3.2.3. Candidate indicators
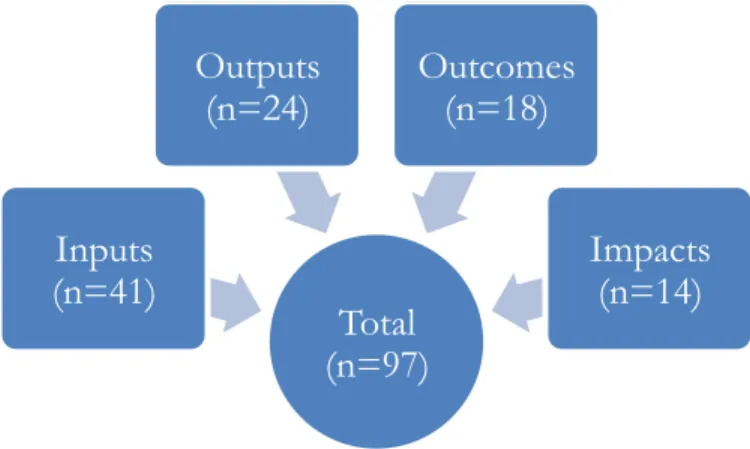
The initial list included 97 candidate indicators. The number of indicators
included in each framework section is displayed in Figure 6. A complete list of candidate
indicators from the reviewed literature is included in Appendix 3.
Figure 6: Number of candidate indicators included in each section of the school WaSH conceptual framework.
3.2.4. Selection criteria
Based on the results and feedback of the selection criteria questionnaire described
in Section 2.2.4, nine indicator selection criteria were chosen (Table 3). The selection
criteria were grouped using three categories proposed by Gudmundsson (2010):
representation, collection, and application. The selection criteria in the representation
category aim to measure the analytical soundness with which an indicator actually
measures school WaSH. Collection refers to factors that affect how indicator data can be
obtained. The final category is application, which refers to the usefulness of the indicator
in a policy, planning, or decision-making process. While these three categories were not Total
(n=97) Inputs
(n=41)
Outputs
(n=24) Outcomes (n=18)
used in the scoring process, they provide conceptual structure to the list of selection
criteria, and they highlight three major aims of this indicator suite.
Table 3: Criteria used for the evaluation of candidate indicators. Criteria were selected based on feedback from a consultation with a panel of WaSH experts.
3.2.5. Score indicators against criteria
The complete scoring rubric and final averaged scores of the initial list of indicators are
included in Appendix 4.
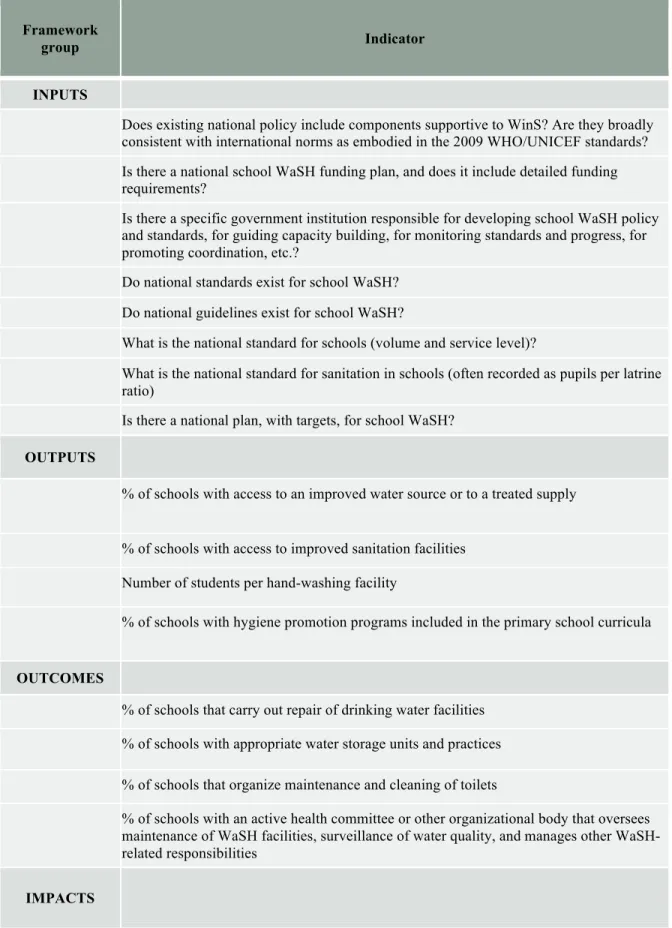
3.2.6. Final selection of indicators
Based on the results of the selection criteria scoring method, 20 school WaSH indicators
were selected using the methods described in Section 2.2.6 (Table 4).
Category Criterion Definition
Representation Valid There must be an accurate correlation between an indicator and the issue for which it is supposed to proxy (WHO, 2006).
Reliable Indicator measurement produces the same value if repeated in the same way on the same population and at almost the same time (WHO, 2006)
Sensitive Indicator reveals important changes in the factor of interest (WHO, 2006)
Collection Measurable Indicator is straightforward and relatively inexpensive to measure (Dale and Beyeler, 2003)
Data
available
Data are available and accessible, accurate, comparable over time, complete with historical information and covering sufficient geographic area (OECD, 2003).
Ethical Collection of data complies with human rights and requires only data consistent with morals, beliefs or values of the population (WHO, 2006).
Application Interpretable Indicator is relatively simple to understand and interpret
Relevant to
targets
Indicator is clearly relevant to articulated purpose of the suite.
Table 4: Final list of indicators, after scoring and final selection.
Framework
group Indicator
INPUTS
Does existing national policy include components supportive to WinS? Are they broadly consistent with international norms as embodied in the 2009 WHO/UNICEF standards?
Is there a national school WaSH funding plan, and does it include detailed funding requirements?
Is there a specific government institution responsible for developing school WaSH policy and standards, for guiding capacity building, for monitoring standards and progress, for promoting coordination, etc.?
Do national standards exist for school WaSH?
Do national guidelines exist for school WaSH?
What is the national standard for schools (volume and service level)?
What is the national standard for sanitation in schools (often recorded as pupils per latrine ratio)
Is there a national plan, with targets, for school WaSH?
OUTPUTS
% of schools with access to an improved water source or to a treated supply
% of schools with access to improved sanitation facilities
Number of students per hand-washing facility
% of schools with hygiene promotion programs included in the primary school curricula
OUTCOMES
% of schools that carry out repair of drinking water facilities
% of schools with appropriate water storage units and practices
% of schools that organize maintenance and cleaning of toilets
% of schools with an active health committee or other organizational body that oversees maintenance of WaSH facilities, surveillance of water quality, and manages other WaSH-related responsibilities
Primary School Net Enrollment Ratio (# of children of primary school age enrolled in primary school / number of children of primary school age)
Primary school completion rates, male and female (as % of relevant age group)
Ratio of female to male primary school enrollment
4. DISCUSSION
This study reviewed existing methods of indicator selection and identified six
methodological stages appropriate to selecting indicators for school WaSH. This method
was then applied for the selection of school WaSH indicators. This indicator suite can be
used as a monitoring tool that reflects the status of national school WaSH and effectively
communicate needs for national policy development and allocation of financial resources.
4.1. Systematic Review
Indicator suites have previously been constructed for monitoring and evaluation in
a variety of study fields. Though numerous studies provide discussion and critiques of
indicator selection processes (e.g., Niemeijer and deGroot, 2008; Gundmudsson, 2010),
this study is the first to systematically review indicator selection methods. In performing
this review, we present a summary of existing indicator selection methods for
environment, international development, and water. This summary provides a foundation
for critical assessment of existing indicator selection methods and can be used to inform
future efforts to construct indicator sets. Further, our findings display considerable
homogeneity in methods for indicator selection across fields of study, providing a
foundation for the construction of a standard model for indicator selection. This
homogeneity in indicator selection methods is evident in two ways: (1) the relatively
small number of distinct methods identified (only eleven unique methods were identified
across 31 studies), and (2) the frequency with which each method was used across the
studies (eight of the methods were used by over half of the studies). Though homogeneity
and frequency of use are not necessarily indicative of best practices or appropriateness
methods, as it suggests that other researchers have found these methods to be useful. The
methods finally selected provided logical organization to the indicator selection process,
eliminating the arbitrariness often associated with indicator selection and index
construction. Additionally, the explicitly defined process improves transparency,
allowing other researchers or stakeholders to better understand each stage in the
decision-making process.
4.2. School WaSH Indicator Suite
This study represents the first attempt to apply a rigorous and transparent method
to the selection of school WaSH indicators. Previous efforts to select and present
WaSH-related indicators include the Human Right to Water, the UN Water Global Analysis and
Assessment of Sanitation and Drinking-Water (GLAAS), and the WHO/United Nations
Children’s Fund (UNICEF) Joint Monitoring Programme (WHO, 2003; WHO and
UN-Water, 2012; WHO and UNICEF, 2012). Despite the availability of these WaSH
indicator sets, none provide a set of indicators or guidance specifically for school WaSH
monitoring. Additionally, none of these monitoring frameworks specify a validated or
transparent indicator selection method. This study aimed to advance school WaSH
monitoring efforts by applying a rigorous indicator selection method to the selection of
school WaSH-specific indicator suite.
Applying these methods also revealed some potential deficiencies and needs for
clarification in the selection process. For example, of the final twenty indicators, eight of
them were in one framework category (inputs). This skew occurred primarily because the
majority of indicators identified in the literature were concentrated in this category;
importance across framework categories. Further refinement of selection methods is
necessary to correct these imbalances, if they are in fact problematic. A related deficiency
of the method is that it does not include a set of selection criteria to evaluate the indicator
set on a whole or the inter-relation between indicators. Niemeijer and deGroot (2008)
argue for inclusion of such a stage, noting that “the utility and scientific credibility of
indicator studies can be greatly enhanced if formal selection criteria are applied not just
to indicators individually, but also in relation to an indicator’s analytical utility within the
total constellation of a selected set of indicators.” Despite this suggestion, use of this
analytical tool was not discussed in other literature included in the review. Its application
may support a more streamlined and more representative indicator suite as well as more
even distribution of indicators across the framework categories.
Another potential deficiency of the indicator selection method includes the
uniform weighting of the selection criteria. Only eight of the 31 included studies
employed a weighting scheme in applying the selection criteria, but this method may be
more useful than the literature would indicates by frequency of use. A tailored weighting
scheme may provide precision to the indicator scoring method and would allow for a
prioritization of the criteria based on user needs. Another deficiency in the indicator
selection method is the lack of a detailed description of how final selection is conducted,
as based on the selection criteria scoring results. None of the literature included in the
review provided details of this selection process, and thus we developed a new method,
only including indicators that scored over one standard deviation above the mean within
each framework category.
This study revealed a number of areas for future research. Further study is
necessary to determine how to evaluate interrelations between indicators as well as
indicator suites on the whole. Additional methodological refinement is needed to
determine the usefulness of using a weighting scheme for selection criteria. A clearer
description of final selection methods based on selection criteria scoring is also needed.
Additionally, further study is needed to determine appropriate scale and weights for
consolidation of the indicators into a school WaSH composite index. A composite index
is a compilation of individual indicators into a single value on the basis of an underlying
model (OECD, 2008). Such composite indices are controversial because of their tendency
to mask important aspects of complex concepts; however, such an index, if constructed
properly, can serve as an important tool to facilitate monitoring and interpreting general
trends in school WaSH conditions globally. The indicator suite produced in this study
serves as a foundation for the construction of such an index. Finally, more research is
needed to determine how a suite of indicators can better monitor and reflect needs on
scales ranging from household and community level to national and global levels.
5. CONCLUSIONS
This study reviews indicator selection methods and proposes a transparent and
validated method for selecting indicators in WaSH and other fields. The suite of school
WaSH indicators developed using the proposed methods provides a structure for
monitoring of school WaSH programs, identifies focus areas for stakeholder resource
allocation, and highlights gaps in data collection. Additional work is recommended to
communication of indicator data into an easily interpretable measurement tool for
identifying and communicating specific needs within the school WaSH sector. This work
contributes to a better understanding of the factors important to school WaSH and
provides a framework for improved monitoring and evaluation of WaSH conditions
30
APPENDIX 1: List of potential indicator selection criteria
CRITERIA DEFINITION
1 Representative Indicator is well-correlated to the issue for which it is supposed to proxy
2 Conceptually valid Indicator is based on a widely accepted and understood conceptual model
3 Well-defined Indicator is explicitly defined by appropriate statistical units of measurement and standard international terminology
4 Sensitive Indicator reveals important changes in the factor of interest
5 Specific Indicator reflects only the changes in the issue or factor under consideration
6 Transparent The following factors are described in an understandable way: the way the indicator is constructed, how it varies with what it represents, and how it is influenced by uncertainties.
7 Reliable Indicator is likely to produce the same value if it its measurement were repeated in the same way on the same population and at almost the same time
8 Measureable Indicator is relatively inexpensive and straightforward to measure, and data are collected and updated with appropriate frequency
9 Data available Indicator has data that are available and accessible, accurate, comparable over time, complete with historical information and covering sufficient geographic area
10 Threshold availability Theory allows calculation of reference point associated with serious harm
11 Aggregability without loss of representativeness
How easy and to which degree indicators can be aggregated, to higher geographical levels, with other indicators
12 Discountability Discounting influences people's assessment and evaluation of impacts that will be perceived in different moments of time, as well as trade-offs with other effects characterized in other moments and through other indicators.
13 Policy relevant Indicator is useful for making policy decisions
31
15 Responsive to change Factors which influence the indicator can be altered to induce improvements in the factor of interest
16 Transferable Indicator can be adapted to other similar contexts in order to compare different scenarios
17 Simple Indicator is simple or uncombined
18 Negative incentivization Will the measurement process encourage undesired behaviors by those under measurement?
32
APPENDIX 2: Selection criteria questionnaire administered to Water Institute (WI) researchers.
33
Do you understand
the criterion?
Rate the importance of this criterion for the selection of WASH indicators.
Do you need more detail to assess the relevance of this
criterion?
Does this criterion significantly overlap
with other criteria?
If you believe this criterion significantly overlaps with others, list by number the other
criteria with which it overlaps
. Yes (1) No (2) Not important (1) Somewhat important (2) Very important (3)
Yes (1) No (2) Yes (1) No (2) Enter Text here (1)
1. Representative
(1) ! ! ! ! ! ! ! ! !
2. Conceptually
valid (2) ! ! ! ! ! ! ! ! !
3. Well-defined
(3) ! ! ! ! ! ! ! ! !
4. Sensitive (4) ! ! ! ! ! ! ! ! !
5. Specific (5) ! ! ! ! ! ! ! ! !
7. Reliable (6) ! ! ! ! ! ! ! ! !
8. Measurable (7) ! ! ! ! ! ! ! ! !
9. Data available
(8) ! ! ! ! ! ! ! ! !
10. Threshold
availability (9) ! ! ! ! ! ! ! ! !
11. Aggregability without loss of representativity
34
(10) 12. Discountability
(11)
! ! ! ! ! ! ! ! !
13. Policy
relevant (12) ! ! ! ! ! ! ! ! !
14. Linkable to
targets (13) ! ! ! ! ! ! ! ! !
15. Responsive to
change (14) ! ! ! ! ! ! ! ! !
16. Transferable
(15) ! ! ! ! ! ! ! ! !
17. Simple (16) ! ! ! ! ! ! ! ! !
18. Negative insentivisation
(17)
! ! ! ! ! ! ! ! !
35
Q2 BEFORE BEGINNING THIS EXERCISE, please open the attached document and use it as a reference. Review the definition of the criterion in question, then indicate the strength of the following 2 hypothetical school WASH indicators in the context of each criterion: Indicator 1: "Percent of schools at which sanitation facilities are accessible to all users, including adults and children, the elderly, and those with physical disabilities." Indicator 2: "Life expectancy at birth (total years)."
Strength of indicator 1 Strength of indicator 2
Weak (1) Moderate (2)
Strong
(3) N/A (4) Weak (1)
Moderate (2)
Strong
(3) N/A (4) 1. Representative
(1) ! ! ! ! ! ! ! !
2. Conceptually
valid (2) ! ! ! ! ! ! ! !
3. Well-defined
(3) ! ! ! ! ! ! ! !
4. Sensitive (4) ! ! ! ! ! ! ! !
5. Specific (5) ! ! ! ! ! ! ! !
6. Transparent (6) ! ! ! ! ! ! ! !
7. Reliabile (8) ! ! ! ! ! ! ! !
8. Measurable (9) ! ! ! ! ! ! ! !
9. Data Available
(10) ! ! ! ! ! ! ! !
10. Threshold
Availability (12) ! ! ! ! ! ! ! !
11. Aggregatability
without loss of representativeness
(13)
36
12. Discountability
(14) ! ! ! ! ! ! ! !
13. Policy
Relevant (15) ! ! ! ! ! ! ! !
14. Linkable to
targets (16) ! ! ! ! ! ! ! !
15. Responsive to
change (17) ! ! ! ! ! ! ! !
16. Transferable
(18) ! ! ! ! ! ! ! !
17. Simple (19) ! ! ! ! ! ! ! !
18. Negative incentivisation
(20)
! ! ! ! ! ! ! !
19. Ethical (21) ! ! ! ! ! ! ! !
37
APPENDIX 3: List of candidate indicators identified in the literature.
INPUTS
1
Does existing national policy include components supportive to WinS? Are they broadly consistent with international norms as embodied in the 2009 WHO/UNICEF standards?(MP)--national
2 Under which national policy instruments/frameworks is WinS a component? 3 Do policies exist that address gender disparities in WinS (Excel)?
4 Do policies exist that address disabilities in WinS (Excel)?
5 If there is a national WinS plan, does it include detailed funding requirements? (MP)--national
6
Is there a primary source of funding available for O&M of WASH facilities and hygiene education in schools? Is it consistent and reliable? (MP)--sub-national
7 What % of capital and recurrent costs are dependent on donor funding? (MP)--national
8
Are there sufficient funds available for the construction of WinS facilities? If not, what are the gaps? (MP)--sub-national
9
If funding gaps exist, is new funding being actively pursued? (e.g., have funding proposals been developed? Do education system proposals for funding include WinS components? (MP)--national
10
Might need an indicator for: investment in schools for the poorest regions in the country - these indicators need to be supportive of the new post-2015 language (and recommendations for post-2015 language)
11
Might need an indicator for: something about "weaning" off donor funding - not sure what exactly this would look like
12 Is there a specific govt institution responsible for WinS? (WinS DLC)
13
Are there national bodies for developing WinS policy and standards, for guiding capacity building, for monitoring standards and progress, for promoting coordination, etc.? (MP)--national
14
Are these bodies active? (e.g., are their recommendations taken into account by the Ministry of Education, by donors, etc.)? (MP)--national
15
38
16 Are roles and responsibilities of key stakeholders clearly defined? 17 Do national standards exist for WinS?
18 Do national guidelines exist for WinS? 19 Are the standards "regionally adequate?"
20 What is the national water standard for schools (volume and service level?) (Excel)
21 What is the national standard for sanitation in schools OR pupils per latrine/toilet ratio (Excel)
22 Is there an effective regulatory framework that encourages and supports compliance? Are regulations actively enforced country-wide? (MP)--national
23
To what extent are national standards reflected in sub-national regulations, programs and practices, and monitoring and enforcement? (MP) (or some other indicator of national standards reflected in sub-national regulations, programs and practices; as well as monitoring and enforcement)
24 Is there a national plan, with targets, for WinS? (MP)--national
25 Does the national Ministry of education planning process include plans and targets for WinS? (MP)--national
26
Do national policy documents and national institutions provide adequate guidance resources for sub-national planning processes? (MP)--national
27 To what extent are CSO and NGO stakeholders included in the planning process? (MP)--national 28 Does the sub-national area have a WinS plan with targets? (MP)--sub-national
29
Is there a set of training materials and/or a training program based on national WinS policies and standards? (MP)--national
30 Do national teacher training programs include components on hygiene education? (MP)--national
31 Are NGO, CSO and private sector actors given access to training materials and programs? (MP)--sub-national
32 To what extent are national WinS policies disseminated, implemented and operationalized on the sub-national level?
39
34 Is there a national monitoring system for WinS progress? (MP)--national 35 Is WinS monitoring included as a component of national EMIS? (MP)--national 36 Is EMIS WinS data published along with other educational data? (MP)--national
37
Is there evidence that national policies and/or plans have been adjusted as a result of information from monitoring systems? (MP)--national
38 Data collection mechanism (EMIS, survey, etc.) (Excel) 39 Indicator of data collection coverage (Excel)
40 Integration of WinS in national data collection systems? (WinS DLC) 41 Rating of reliability of WinS monitoring data (WinS DLC)
OUTPUTS
42
Quantity indicator (% of schools with access to a regionally adequate volume of water for all WASH needs (sufficient quantity available for drinking, personal hygiene, food prep, cleaning and laundry?))
43
Quality of water source indicator (maybe "% of schools at which primary water supply meets WHO guidelines/national standards regarding microbiological, chemical or radiological parameters?") 44 % of schools with access to an improved water source OR a treated supply (Excel)
45 % of schools with water source [x distance] from main building?
46
Time availability/reliability of functionality indicator (% of schools with access to water for X hours/day or proportion of year of water availability)
47 % of schools with drinking water facilities accessible to disabled children/staff 48 % of schools with access to improved sanitation facilities (Excel)
49 % of schools meeting (national/international?) standard for pupils per functional latrine/toilet 50 Number of girls per functional latrine
51 Number of boys per functional latrine/urinal
52 % of schools with gender separated latrines or other sanitation facilities (WinS DLC) 53 % of schools with sanitation facilities that are accessible to disabled children/staff
40
55 % of schools with soap available for handwashing (WinS DLC) 56 % of schools with (adequate?) handwashing facilities
57 % of schools with anal cleaning materials available (SWASH 2012) 58 Number of students per hand-washing facility
59 % of schools with supplies/facilities for menstrual hygiene maintenance available 60 % of schools with handwashing facilities that are accessible to disabled children/staff
61
Time availability/reliability of functionality indicator (% of schools with access to handwashing facility and soap for X hours/day or proportion of year of handwashing facility and soap availability)
62 % of schools with hygiene promotion programs included in the primary school curricula (GLASS) 63 % of schools with at least one teacher trained in hygiene promotion
64 % of schools with an active WASH attendant
65 % of schools in which the daily schedule includes designated time allotted to washing hands before and after eating
OUTCOMES
66 % of schools that treat water before use?
67 % of schools with appropriate water storage units and practices 68 % of children using shared/unshared cup for drinking
69 % of schools with an active health committee or other body that oversees regular O&M of WASH facilities, water quality surveillance, WASH monitoring/review responsibilities, etc. 70 % of schools that carry out repair of drinking water facilities
71 % of population not practicing open defecation (WinS DLC)
72 % of schools with health clubs that organize maintenance and cleaning of toilets (WinS DLC) 73 Average structural condition & cleanliness of sanitation facilities
74 Maintenance of area around toilet
75 % of schools that carry out repair of toilets
41
77 % of schools in which children are generally expected by their peers to wash their hands after using the latrine (WinS DLC)
78 % of schools in which children are generally expected to contribute to the maintenance of school WASH facilities 79 Some indicator for children's perceptions/satisfaction with water source at school
80 Some indicator for teacher/staff perceptions/satisfaction with water source at school
81 Some indicator for children's perceptions/satisfaction with latrines and other sanitation facilities at school
82 Some indicator for teacher/staff perceptions/satisfaction with latrines and other sanitation facilities at school
83 Some indicator for girls' perceptions about level of privacy provided by access to latrines and other sanitation services
IMPACTS
84 Under 5 child mortality rates (per 1000 live births) (MER annex) 85 Children under 5 who are stunted (MER annex)
86 Diarrhea incidence (episodes per child year) in children under 59 mo.
87 Proportion of children (pre-school aged and school aged) requiring preventative chemotherapy for soil-transmitted helminthiases
88 Life expectancy at birth (total years) (health indicator in the “Health Index” of the HDI) (MER annex)
89 Primary School Net Enrollment Ratio (NER) (number of children of primary school age enrolled in primary school / number of children of primary school age)--UNICEF metric 90 Attendance/absenteeism--Primary School Net Attendance Rate
91 Primary school completion rates, male and female (% of relevant age group) 92 Youth literacy rates, male and female (% of ages 15-24)
42
95 Some indicator for girls' perceptions about level of privacy provided by access to latrines and other sanitation services
43
APPENDIX 4: Scoring of indicators against selection criteria. Numbers in the left-hand column refer to indicator numbers provided in Appendix 3.
Representation Operation Application TOTAL
Valid Reliable Sensitive Measurable Data
available
Ethical Interpretable Relevant to targets
Actionable
INPUTS
1 1 1 0.5 1 1 1 0.5 1 1 8
2 0 1 0 1 1 1 1 0 0.5 5.5
3 1 0.5 0.5 1 1 1 0.5 1 1 7.5
4 1 0.5 0.5 1 1 1 0.5 1 1 7.5
5 1 1 1 1 1 1 0.5 1 1 8.5
6 0.5 0.5 1 0.5 1 1 0 0.5 0.5 5.5
7 0.5 0.5 0.5 0.5 0.5 1 0.5 0.5 0.5 5
8 0.5 0.5 1 0.5 0.5 1 0 1 0.5 5.5
9 0.5 0.5 0 0 0.5 1 0 0.5 1 4
10 1 0.5 1 0.5 0.5 1 - 1 1 6.5
11 0.5 0.5 0.5 0 0 1 - 0.5 0.5 3.5
12 0.5 1 0.5 1 1 1 0.5 1 1 7.5
13 1 1 0.5 1 1 1 1 1 1 8.5
14 1 1 0 0.5 0.5 1 0.5 1 1 6.5
15 0.5 1 0 0.5 0.5 1 0 0.5 0.5 4.5
16 0.5 1 0 1 0.5 1 0.5 0.5 1 6
17 1 1 0.5 1 1 1 0.5 1 1 8
18 1 1 0.5 1 1 1 0.5 1 1 8
19 0.5 0.5 0 0.5 0 1 0 1 1 4.5
20 1 1 0.5 1 1 1 1 0.5 1 8
44
22 1 0.5 0.5 0.5 0.5 1 0 1 1 6
23 1 0 0 0.5 0.5 1 0 1 0.5 4.5
24 1 1 1 1 1 1 0.5 1 1 8.5
25 0.5 1 0 1 1 1 0.5 0.5 1 6.5
26 0.5 1 0.5 0.5 0.5 1 0.5 0.5 1 6
27 0.5 0.5 0.5 0 0.5 1 0 0.5 1 4.5
28 0.5 0.5 0.5 0.5 0.5 1 0.5 0.5 1 5.5
29 0.5 1 0 1 1 1 1 0.5 1 7
30 0.5 1 0.5 1 1 1 1 1 1 8
31 0 0.5 0.5 0 0.5 1 0.5 0.5 1 4.5
32 1 0 0.5 0 0 1 0.5 0.5 0.5 4
33 1 1 0.5 1 1 1 1 0.5 1 8
34 1 1 0.5 1 1 1 1 0.5 1 8
35 0.5 1 0 1 1 1 1 0 1 6.5
36 0 1 0 1 1 1 1 0.5 1 6.5
37 1 0.5 0.5 0.5 0.5 1 0.5 1 0.5 6
38 0 1 0 1 1 1 1 0 1 6
39 0.5 0.5 0 0.5 0.5 1 0.5 1 0.5 5
40 0.5 0.5 0 0.5 0.5 1 0.5 0.5 0.5 4.5
41 1 0 0 0.5 0 1 0 0.5 0.5 3.5
OUTPUTS
42 1 0.5 1 0.5 0.5 1 0.5 1 0 6
43 1 0 1 0.5 0.5 1 - 1 0 5
44 1 1 1 0.5 1 1 1 1 0.5 8
45 1 1 1 0.5 0.5 1 1 0.5 0 6.5
46 1 0 1 0.5 0 1 0.5 0.5 0 4.5
47 0.5 1 0.5 0.5 0.5 1 1 1 0 6
45
49 1 0.5 0.5 0.5 0.5 1 1 1 0.5 6.5
50 1 1 0.5 1 0.5 1 1 1 0.5 7.5
51 1 1 0.5 1 0.5 1 1 1 0.5 7.5
52 1 1 1 0.5 0.5 1 0.5 1 0.5 7
53 1 1 1 0.5 0.5 1 1 1 0.5 7.5
54 1 0 1 0 0 1 0.5 0.5 0 4
55 1 0.5 1 0.5 0.5 1 1 1 0.5 7
56 1 1 1 0.5 0.5 1 0.5 1 0.5 7
57 0.5 1 0.5 0.5 0 1 1 0.5 0 5
58 1 0.5 1 1 0.5 1 1 1 1 8
59 1 1 0.5 0.5 0.5 1 1 1 0.5 7
60 1 1 1 0.5 0.5 1 1 1 0.5 7.5
61 0.5 0 1 0 0 1 0.5 0.5 0 3.5
62 1 1 0.5 1 1 1 1 1 1 8.5
63 1 1 0.5 0.5 0.5 1 1 0.5 1 7
64 0.5 1 0.5 0.5 0.5 1 0.5 0.5 1 6
65 0.5 1 0.5 0 0.5 1 1 0.5 1 6
OUTCOMES
66 1 0 1 0.5 0 1 1 0.5 0.5 5.5
67 1 0.5 1 0.5 0.5 1 1 1 0.5 7
68 0.5 0.5 0 0 0 1 1 0.5 0 3.5
69 0.5 1 0.5 1 0.5 1 1 0.5 1 7
70 1 1 0.5 0.5 0.5 1 0.5 1 0.5 6.5
71 0.5 0.5 1 0 0.5 1 1 0.5 0 5
72 1 0.5 0.5 0.5 0.5 1 1 0.5 1 6.5
73 0.5 0 0 0 0 1 0.5 0.5 0 2.5
74 0.5 0.5 0 0 0 1 0 0.5 0 2.5
46
76 1 0.5 1 0 0 1 0.5 1 0 5
77 0.5 1 0 0 0 1 0.5 0.5 0 3.5
78 0.5 1 0 0 0 1 0.5 0.5 0 3.5
79 0.5 0.5 0.5 0.5 0 1 - 1 0 4
80 0.5 0.5 0 0.5 0 1 - 0.5 0 3
81 0.5 0.5 0.5 0.5 0 1 - 1 0 4
82 0.5 0.5 0 0.5 0 1 - 0.5 0 3
83 0.5 0.5 0.5 0.5 0 1 - 1 0 4
IMPACTS
84 0.5 1 0 0.5 1 1 1 1 0 6
85 0.5 1 0 0.5 0.5 1 0.5 1 0 5
86 0.5 0 0 0 0.5 1 0.5 1 0 3.5
87 0.5 1 0 0.5 0.5 1 0.5 1 0 5
88 1 1 0.5 0.5 1 1 0.5 0.5 0 6
89 1 1 1 1 1 1 1 1 0.5 8.5
90 1 0.5 1 0.5 1 1 0.5 1 0 6.5
91 1 1 0.5 1 1 1 1 1 0.5 8
92 0.5 0.5 0 0.5 1 1 1 1 0.5 6
93 1 1 0.5 1 1 1 1 1 0.5 8
94 1 1 0.5 1 1 1 1 1 0.5 8
95 0.5 0 0.5 0.5 0 1 - 1 0 3.5
96 0.5 0 0.5 0.5 0 1 - 0.5 0 3
REFERENCES
Adams, J., Bartram, J., & Chartier, Y. (2009). Water, sanitation and hygiene standards
for schools in low-cost settings. Retrieved from
http://www.who.int/entity/water_sanitation_health/publications/wash_standards_sch ool.pdf
Afgan, N. H., Carvalho, M. G., & Hovanov, N. V. (2000). Energy system assessment with sustainability indicators. Energy Policy, 28(9), 603–612. doi:10.1016/S0301-4215(00)00045-8
Bobbitt, L., Green, S., Candura, L., & Morgan, G. a. (2005). The Development of A County Level Index Of Well-Being. Social Indicators Research, 73(1), 19–42. doi:10.1007/s11205-004-6165-9
Breckenridge, R. P., Kepner, W. G., & Mouat, D. a. (1995). A process for selecting indicators for monitoring conditions of rangeland health. Environmental Monitoring
and Assessment, 36(1), 45–60. doi:10.1007/BF00546984
Buchholz, T., Luzadis, V. a., & Volk, T. a. (2009). Sustainability criteria for bioenergy systems: results from an expert survey. Journal of Cleaner Production, 17, S86– S98. doi:10.1016/j.jclepro.2009.04.015
Castillo, H., & Pitfield, D. E. (2010). ELASTIC – A methodological framework for identifying and selecting sustainable transport indicators. Transportation Research
Part D: Transport and Environment, 15(4), 179–188. doi:10.1016/j.trd.2009.09.002
Corbière-Nicollier, T., Blanc, I., & Erkman, S. (2011). Towards a global criteria based framework for the sustainability assessment of bioethanol supply chains. Ecological
Indicators, 11(5), 1447–1458. doi:10.1016/j.ecolind.2011.03.018
Dinsdale, E. a, & Harriott, V. J. (2004). Assessing anchor damage on coral reefs: a case study in selection of environmental indicators. Environmental Management, 33(1), 126–39. doi:10.1007/s00267-003-3056-9
Doody, D. G., Kearney, P., Barry, J., Moles, R., & O’Regan, B. (2009). Evaluation of the Q-method as a method of public participation in the selection of sustainable
development indicators. Ecological Indicators, 9(6), 1129–1137. doi:10.1016/j.ecolind.2008.12.011
Doren, R. F., Trexler, J. C., Gottlieb, A. D., & Harwell, M. C. (2009). Ecological indicators for system-wide assessment of the greater everglades ecosystem restoration program. Ecological Indicators, 9(6), S2–S16.
doi:10.1016/j.ecolind.2008.08.009
Fontalvo-Herazo, M. L., Glaser, M., & Lobato-Ribeiro, A. (2007). A method for the participatory design of an indicator system as a tool for local coastal management.
Ocean & Coastal Management, 50(10), 779–795.
doi:10.1016/j.ocecoaman.2007.03.005
Garfì, M., & Ferrer-Martí, L. (2011). Decision-making criteria and indicators for water and sanitation projects in developing countries. Water Science & Technology, 64(1), 83. doi:10.2166/wst.2011.543
Gomontean, B., Gajaseni, J., Edwards-Jones, G., & Gajaseni, N. (2008). The
development of appropriate ecological criteria and indicators for community forest conservation using participatory methods: A case study in northeastern Thailand.
Ecological Indicators, 8(5), 614–624. doi:10.1016/j.ecolind.2007.08.006
Gudmundsson, H. (2010). Criteria and methods for indicator assessment and validation - a review of general and sustainable transport related indicator criteria and how to
apply them Scientific Report.
Gudmundsson, H., Tennøy, A., Joumard, R., Waeger, P., Folkeson, L., Dalkmann, H., … Ramos, A. P. (2010). Criteria and methods for indicator assessment and validation - A review of general and sustainable transport related indicator criteria and how to
apply them Scientific Report.
James, C. A., Kershner, J., O’Neill, S., & Levin, P. S. (2012). A methodology for evaluating and ranking water quantity indicators in support of ecosystem-based management. Environmental Management, 49(3), 703–19. doi:10.1007/s00267-012-9808-7
Jasper, C., Le, T.-T., & Bartram, J. (2012). Water and sanitation in schools: a systematic review of the health and educational outcomes. International Journal of
Environmental Research and Public Health, 9(8), 2772–87.
doi:10.3390/ijerph9082772
Joumard, R., Gudmundsson, H., & Folkeson, L. (2011). Framework for Assessing Indicators of Environmental Impacts in the Transport Sector. Transportation
Research Record: Journal of the Transportation Research Board, 2242(-1), 55–63.
doi:10.3141/2242-07
Juwana, I., Perera, B. J. C., & Muttil, N. (2010a). A water sustainability index for West Java - Part 2: refining the conceptual framework using Delphi technique. Water
Science and Technology!: A Journal of the International Association on Water
Pollution Research, 62(7), 1641–52. doi:10.2166/wst.2010.453
Juwana, I., Perera, B. J. C., & Muttil, N. (2010b). A water sustainability index for West Java. Part 1: developing the conceptual framework. Water Science and Technology!:
A Journal of the International Association on Water Pollution Research, 62(7),
1629–40. doi:10.2166/wst.2010.452
Kayser, G. L., Moriarty, P., Fonseca, C., & Bartram, J. (2013). Domestic water service delivery indicators and frameworks for monitoring, evaluation, policy and planning: A Review. International Journal of Environmental Research and Public Health,
10(10), 4812–35. doi:10.3390/ijerph10104812
Kurka, T., & Blackwood, D. (2013). Participatory selection of sustainability criteria and indicators for bioenergy developments. Renewable and Sustainable Energy Reviews,
24, 92–102. doi:10.1016/j.rser.2013.03.062
Lebacq, T., Baret, P. V., & Stilmant, D. (2012). Sustainability indicators for livestock farming. A review. Agronomy for Sustainable Development, 33(2), 311–327. doi:10.1007/s13593-012-0121-x
Lee, L., Rosenzweig, M. R., & Pitt, M. M. (1997). The effects of improved nutrition, sanitation, and water quality on child health in high-mortality populations. Journal