Sharif University of Technology
Scientia IranicaTransactions E: Industrial Engineering http://scientiairanica.sharif.edu
Finding an improved region of eciency via
DEA-ecient hyperplanes
N. Ebrahimkhani Ghazi
a, F. Hosseinzadeh Lot
a;, M. Rostamy-Malkhalifeh
a,
G.R. Jahanshahloo
b, and M. Ahadzadeh Namin
ca. Department of Mathematics, Science and Research Branch, Islamic Azad University, Tehran, Iran. b. Department of Mathematics, Teacher Training University, Tehran, Iran.
c. Department of Mathematics, Shahr-e-Qods Branch, Islamic Azad University, Tehran, Iran. Received 13 December 2016; received in revised form 2 June 2017; accepted 18 September 2017
KEYWORDS Data Envelopment Analysis (DEA); Eciency; Value judgment; Linear programming; Production Possibility Set (PPS)
Abstract.The analysis of eciency is conducted for two vital purposes: rstly, in order to evaluate the current level of eciency; secondly, to provide information on how to improve the level of eciency, which is to provide benchmarking information. The inecient Decision Making Units (DMUs) are usually able to improve their performance, and Data Envelopment Analysis (DEA) projections provide a prescription for improvement. However, sometimes, an inecient DMU cannot move its performance toward the best practice by either decreasing its inputs or increasing its outputs. On the other hand, it can scarcely reach its ecient benchmark. This research suggests a method to nd an improved region of eciency through DEA-ecient hyperplanes by providing an algorithm for detecting an improved eciency path. In addition to the production of reasonable benchmarking information, the proposed algorithm provides the general requirements that satisfy the demands which every professional decision-maker should meet. Finally, we provide a more detailed description of some new issues, extending the insights from this analysis of the benchmark region from the under-evaluated inecient DMU. Finally, numerical examples are provided to demonstrate the results of the analysis.
© 2018 Sharif University of Technology. All rights reserved.
1. Introduction
The traditional Data Envelopment Analysis, as initially proposed by Charnes et al. [1], is a relatively new \data-oriented" approach to assessing the performance of a set of DMUs that use multiple inputs to produce multiple outputs. Most DEA approaches, such as the approach introduced by [2], focus on relative eciencies.
*. Corresponding author.
E-mail addresses: [email protected] (N. Ebrahimkhani Ghazi); [email protected] (F. Hosseinzadeh)
doi: 10.24200/sci.2017.20004
Recently, some researchers have studied the per-formance improvement in DEA to meet the decision-maker's goals [3-6]. So many DEA-eciency improve-ment papers have certain points of view such as the modied formulation of the DEA model where bounds are imposed on each factor; this model was proposed by Kao [7]. Another model was introduced by Chen et al. [8] that modied the original DEA model by decomposing the normalizing equation for being asso-ciated with the dierent dual variables. In addition, by means of the equation of dening hyperplanes of PPS, one can nd the region of eciency improvement. In 2011, Khoshfetrat and Daneshvar [9], in a paper, proposed improving the weak eciency frontiers in fuzzy DEA models, where they implicitly dealt with the knowledge of the sensitivity analysis in depth.
This may indeed show the importance of obtaining the dening hyperplanes of the PPS.
The studies of ecient frontiers and characteri-zation of dierent types of hyperplanes have been less intensively investigated [10,11]. The connotation of the ecient frontier DMUs in the DEA was studied by Jahanshahloo et al. [12]; this study found the piece-wise linear frontier of the production function. In the aforementioned study, the researchers developed a way to obtain ecient frontier using 0-1 integer programming. Despite the greater computational ef-forts required to solve the 0-1 integer programming for small n (number of DMUs), solving the 0-1 model for large n is preferable to solving n linear pro-grams; these preference relationships can be derived as strengths. In addition, searching for the ecient frontier in the DEA was considered by Korhonen [13]. Their approach was developed to create a free search for the ecient frontier in Multiple-Objective Linear Programming (MOLP) MOLP-this can also be used in DEA. Furthermore, Jahanshahloo et al. [14] suggested an approach to nding strong dening hyperplanes of the PPS in DEA, in which the observed deciency of an alternative optimal solution of a multiplier form has been removed. In addition, the construction of all DEA-ecient frontiers in Generalized Data Envel-opment Analysis (GDEA) was discussed by Yu and Zeleny [15]. In their work, they derived a necessary and sucient condition for a point to be nondominated. It provided a simple proof conrming that the set of all nondominated extreme points is indeed connected. They then obtained a decomposition theorem and some necessary and sucient conditions for a face to be nondominated. Lot et al. [16] provided an algorithm in order to nd ecient hyperplanes with the Variable Returns to Scale (VRS) assumption of technology by using the MOLP structure. They characterized the ecient hyperplanes that make up the DEA ecient frontier only by nding the ecient faces of the MOLP problem without exploring its extreme ecient points. Sensitivity and stability analysis of the specic under-evaluated DMU is one of the areas of interest in DEA. In 1985, Charnes et al. [17] initiated the sensitivity analysis of a CCR model for a specic ecient DMU with a single output. They constructed variations in the data for the DMU under consideration and initiated the change in the inverse matrix used to produce solutions in typical simplex algorithm computer codes. Then, in 2015, Forghani et al. considered sensitivity analysis in the two-stage DEA, and found that the necessary and sucient conditions for preserving a DMU's eciency classication were developed when various data changes were applied to all the DMUs [18]. Many more papers have studied sensitivity analysis with various data types such as integer data type [3], fuzzy data [19], etc. Another model proposed by
Huang et al. [20], later generalized by Jahanshahloo et al. [21], showed that all the ecient surfaces of the BCC model passing through DMUP were generated for
the case; in this model, the largest stability region of the under-evaluated extreme ecient DMU was constructed by the omission of DMUP from the
obser-vations set. Later, the largest stability region proposed in their paper was improved by [22]. Today, many algorithms have been proposed to nd the ecient region of a specied DMU simply specied by the concept of all the possible values that remain or become ecient [23,24].
DEA also provides benchmarking information in order to improve the eciency of the DMU. This information distinguishes DEA from other eciency methodologies. The reference points that are used for obtaining the benchmarking information are vital not only for evaluating the potential performance of the DMU, but also for providing information on how to improve its performance, as observed by Bogetoft and Hougaard [5]. Inappropriate selection of reference points might lead to misleading guidance on how to improve eciency. The DEA model was introduced by Farrell [25], and later developed by Charnes et al. [1]; it uses an oriented radial measure of eciency for the identication of reference points on the boundary of the PPS with the input orientation or the output orientation of the observed unit. The main weakness of radial eciency measures is that they disregard the possible existence of slacks associated with the projected points on the production frontier (see the fol-lowing examples: [9,19,23,26]). Many practical studies have used non-oriented measures; for example, Colwell and Davis [27] used an intermediation approach that specied inputs in the form of costs and outputs in the form of revenue. Finding the closest target has been considered for both oriented models (see the following examples: [28-30]) and non-oriented models (see the following examples: [31-35]). The only question that most DEA studies focus on is \how is a company inecient?"; the question of \how can a company become ecient?" is the second case for review. Interactive DEA (IDEA) usage was suggested by Post and Spronk [32] in order to make the benchmarking information sensible from the inecient DMU's view-point. In addition, for obtaining the most relevant and easily attainable benchmarking information, the least-distance measure was proposed by Baek and Lee [36], which provides a well-dened eciency measure, too. To answer the second question, this study focuses on the best rational way for an inecient DMU to meet the DM's needs, whether it is still inecient or not. On the ip side, the simplistic claim that the region of eciency improvement is more relevant than nding their eciency is really misleading. Applying the results of [16,20-22,27,38], the current paper aims
to obtain the improved region of eciency by using all the dening hyperplanes of PPS. Now, there is a need to evaluate the use of DEA as a decision aid for considering the improved region of eciency based on the overall value judgment; this is claried in [39]. The value judgment here can, therefore, be ex-pressed in our new proposed algorithm to describe the benchmarking region improvement concept. By means of the new algorithm, the improvement path for an inecient DMU based on value judgment is thereafter identied. In measuring the improvement region, the incorporation of value judgment is, therefore, also very important. The remaining parts of this paper will be unfolded as follows. To explain the new benchmarking region, we start with a description of obtaining the dening hyperplanes of PPS in Section 2, which briey reviews a mathematical basis used for this study. In Section 3, we illustrate our proposed algorithm to obtain the improvement of the benchmarking region. In Section 4, three numerical examples are documented for intuitively describing the new algorithm in order to nd an improved region of eciency. Section 5 provides our concluding remarks and future directions for research.
2. Preliminaries
In this section, a brief description of the BCC input-oriented model and the approaches to nding ecient hyperplanes are included.
2.1. The BCC input-oriented model
The DEA-BCC model was proposed for dealing with situations whose proportionality between the inputs and outputs is not constant along the ecient frontier. The BCC model [4] was initially developed by adding a convexity restriction to the CCR [1] model envelope for-mulation. This generated a VRS frontier. Suppose that we have n DMUs, where each DMUj(j = 1; 2; ; n)
produces the same s outputs in (possibly) dierent amounts, yrj (r = 1; 2; ; s), using the same m
inputs, and xij (i = 1; 2; ; m) in (possibly) dierent
amounts. The BCC input-oriented model evaluates the eciency of DMUo, the DMU under consideration, by
solving the following \multiplier linear form" program:
max Xs
r=1
uryro uo;
s.t. Xm
i=1
vixio= 1; s
X
r=1
uryrj m
X
i=1
vixio uo 0;
j = 1; ; n; uo; free;
vi; ur">0;
i=1; 2; ; m; r =1; 2; ; s; (1) where uiand viare the decision variables, respectively,
that are associated with output r and input i, and " is a positive non-Archimedean innitesimal.
In addition to the eciency score, the most practical information given by the DEA study is the set of Pareto-ecient projection points for the under-evaluated DMU. The coordination of a projection point can be interpreted as the \target" levels of performance of the inputs and outputs. The obtained targets provide an indication of how an assessed DMU improves its performance eciently. Therefore, the closer the assessed DMU is to the targets, the lesser practical eort it needs to be ecient. The basic DEA model in [1], which is called the CCR model, has led to several extensions, most notably the BCC model of [4]. Assume that there are n DMUs(DMUj :
j = 1; 2; ; n) that consume Xj = (x1j; ; xmj) to
produce Yj = (y1j; ; ysj). The BCC input-oriented
(BCC-I) model evaluates the eciency of DMUo and
the considered DMU by solving the following linear program:
min ;
s.t. X
j
jxij xio; 8 i;
X
j
jyrj yro; 8 r;
X
j
j= 1; 8 j;
j 0; 8 j; (2)
where is the optimal solution obtained from Eq. (2).
Denition 1: (Pnj=1
jxj;Pnj=1jyj) = (xo; yo)
is the input-oriented projection point of DMUoon the
ecient frontier.
2.2. Finding ecient hyperplanes
A method for generating all the ecient surfaces of the BCC model passing through DMUp was suggested
by [20,38] and improved by [22], which are as follows: min uo;
s.t. Xs
r=1
uryrp m
X
i=1
s
X
r=1
uryrj m
X
i=1
vixij uo;
j = 1; ; n;
m
X
i=1
vi+ s
X
r=1
ur= 1;
vi "; ur ";
i = 1; 2; ; m; r = 1; 2; ; s; (3) max uo;
s.t. Xs
r=1
uryrp m
X
i=1
vixip = uo; s
X
r=1
uryrj m
X
i=1
vixij uo;
j = 1; 2; ; n;
m
X
i=1
vi+ s
X
r=1
ur= 1;
vi "; ur ";
i = 1; 2; ; m; r = 1; 2; ; s: (4) Note that in an optimal solution to Relations (3) and (4), all of those observed ecient points that satisfy their respective constraints as equalities also lie on the ecient facet contained in the hyperplane passing through (xp, yp). To conduct sensitivity analysis
of each ecient unit called DMUp, Jahanshahloo et
al. [21] used dening hyperplanes that are binding at DMUp and the new frontier, which is formed by the
omission DMUp from the observations set.
Moreover, the MOLP problem suggested by [16] for nding ecient hyperplanes with the VRS assump-tion of technology in DEA is as follows:
max fUY1 V X1 uo; UY2 V X2;
uo; ; UYn V Xn uog;
s.t. UYj V Xj uo 0; j = 1; ; n;
1U + 1V = 1;
V 1"; U 1": (5)
Changing the inequality constraints of Model (5) to equalities and minimizing the objective function of the
converted model are as follows: min fS1; S2; ; Sng;
s.t. UYj V Xj uo+Sj=0; j = 1; ; n;
1U + 1V = 1;
Sj 0; j = 1; ; n;
V 1"; U 1": (6)
Assume that J = f1; ; ng and M = fIjI Jg. The feasible region of Model (6) is denoted by W For I 2 M; F (I) represents a face of W [15]. Note that F () = W ; for I 2 M, F (I) = is possible. Model (SPI), which is similar to the model proposed by [37],
is as follows: ZI = max
n
X
j=1
Tj n
X
j=1
Sj;
s.t. UYj V Xj uo+ Sj= 0;
j = 1; ; n; U0Y
j V0Xj u0o+ Tj= 0;
j = 1; ; n;
Sj Tj 0; j = 1; ; n;
Tj= 0; j 2 I;
1U + 1V = 1; 1U0+ 1V0= 1;
Sj 0; Tj 0; j = 1; ; n;
U 1"; U0 1";
V 1"; V0 1": (7)
The algorithm for nding ecient hyperplanes with the VRS technology in DEA, which was proposed by Hosseinzadeh et al. [16], is as follows:
Step 1. Let k = 1, Fk = , EFk = , and
J = f1; 2; ; ng. Subscripted sets Fk and EFk are
the set of DMUs on the faces of the PPS and the set of subscripts of the DMUs on ecient faces of the PPS, respectively. With the VRS assumption of technology, dictating that both sets of DMUs contain k-element sets, proceed to Step 2;
Step 2. Evaluate Mk = fI JkIj = kg. If jJj < k
Step 3. If Mk 6= , select I 2 Mk; then, proceed to
Step 4. Otherwise, go to Step 5;
Step 4. Solve SPI and set Mk = MknI. If ZI > 0,
then Fk = Fk[ I and proceed to Step 3. If ZI = 0,
then Fk = Fk [ I and EFk = EFk [ I. Suppose
that (U; V; u
o)k is the optimal solution of SPI as
the gradients of the ecient hyperplanes. If SPI is
infeasible, proceed to Step 3;
Step 5. Let k = k + 1, Fk = , EFk = , and
[I2FkI = J. Proceed to Step 2.
Owing to the nite number of DMUs and the fea-sibility of linear programming problem SPI, the
it-erative proposed algorithm is guaranteed to con-verge.
Another approach to identifying the equations of the weak dening hyperplanes of the PPS of the BCC model was proposed by Jahanshahloo et al. [38]. The summary of this identication is as follows:
Step 1. Considering each DMUk (k 2 J) evaluate
the following models: min k
l " m
X
i=1
Si +Xs
r=1
S+ r
! ;
s.t. X
j2J fkg
k
jxlj+ Sl = klxlk;
X
j2J fkg
k
jxij+ Si = xik;
i = 1; ; m; i 6= l; X
j2J fkg
k
jyrj Sr+= yrk;
r = 1; ; s; X
j2J fkg
k j = 1;
k
j 0 (j 2 J = f1; ; ng) fkg;
Si 0; Sl 0; r = 1; ; s; l = 1; ; m;
S+
r 0 i = 1; ; m; kl free: (8)
max 'k q + "
m
X
i=1
ti +Xs
r=1
t+ r
! ;
s.t. X
j2J fkg
k
jxij+ti =xik; i = 1; ; m;
X
j2J fkg
k
jyqj tq = 'kqyqk;
X
j2J fkg
k
jyrj t+r = yrk;
r = 1; ; s; r 6= q; X
j2J fkg
k j = 1;
k
j 0; j 2 J fkg;
ti 0; i = 1; ; m; t+
r 0; r = 1; ; s; q = 1; ; s;
'k
q free: (9)
in which " is a non-Archimedean number;
Step 2. Form two sets Il and Oq. Corresponding
with any DMUj 2 Il (or Oq), form the weak ecient
virtual, DMUl
j(DMUm+qj ), as mentioned previously.
Put the indices of the extreme ecient and weak ecient virtual DMUs in F . Let jF j = L;
Step 3. For each p; q 2 F in which p 6= q, evaluate DMUk = 12DMUp +12DMUq; if it is ecient, then
p 2 Fq and q 2 Fp;
Step 4. For each (j = 1; ; L), Fj = F Fj;
Step 5. Choose the arbitrary m + s members of F so that none of them belongs to another F . Call this set D = fj1: :jm+sg. Using D, a hyperplane can
be constructed as follows:
x1 x1j1 xm xmj1
x1j2 x1j1 xmj2 xmj1
: : :
: : :
: : :
x1jm+s x1j1 xmjm+s xmj1
y1 y1j1 ys ysj1
y1j2 y1j1 ysj2 ysj1
: : :
: : :
: : :
y1jm+s y1j1 ysjm+s ysj1
= 0;
where x1; ; xm, y1; ; ysare variables, xpjt (p =
1 ; m; t = 1; ; m + s) is the pth input of the DMUjt, and yqjt(q = 1; ; s; t = 1; ; m + s) is
of the afore-mentioned hyperplane is in the form of Pt+ = 0, where z = (x1; ; xm; y1;...;ys), P is the
gradient vector of the hyperplane, and is a scalar; Step 6. If P has any component that is less than or equal to zero, proceed to Step 8; otherwise, let w = (xw
1; ; xwm; yw1; ; ysw) be dened as follows:
xw
i = maxfxijjj = 1; ; ng; i = 1; ; m;
yw
r = minfyrjjj = 1; ; ng; r = 1; ; s:
If: Ptz
j+ = 0; j 2 D;
Ptz
j+ 0; j 2 F D;
Ptw + < 0;
then Pt+ = 0 is supporting; otherwise, proceed to
Step 8.
Step 7. If at least one of m + s members of D is a weak ecient virtual DMU, then Pt+ = 0 is a
weak dening hyperplane. Otherwise, it is a strong dening hyperplane;
Step 8. If another subset of F with m + s members can be found, go to Step 5; otherwise, stop.
3. The proposed algorithm
The proposed algorithm for nding the benchmarking region of eciency derived by percentage increase in the pre-eciency value of the under-evaluated ine-cient DMU with the VRS technology in the DEA is as follows:
In order to incorporate such a priori information into the process of our algorithm, we rst specify percentage related to the under-evaluated inecient DMU based on value judgment.
The benchmarking region of an eciency im-provement for an inecient DMU, REA, is just dened
by the following equation: REA=
8 > < > :
0 @X
T iA
YT rA
1 A
T
XT
iA XiAT ; YrAT YrAT
9 > = > ;: The rst step of this method is to nd all the den-ing (ecient) hyperplanes of the PPS. These hyper-planes can be found by using the algorithm proposed in [2,3,14,18,20,22,40,41] (one of these papers can be applied to nd the dening hyperplanes of the PPS). To check the accuracy of all these dening hyperplanes, however, we compared all of these approaches, which resulted in the same dening hyperplane (see Exam-ples 1 and 2 in Section 4). Let P = fp1; ; p2; ptg be
the set of these dening (ecient) hyperplanes. Then, consider DMUAas an inecient DMU under evaluation
to nd the new benchmarking region by increasing the eciency (obtained from Model (2)) of DMUA by
percentage. 1 is considered as a set of the extreme
ecient DMUs from the PPS. Assume that k = 1, and by setting DMU(k)A as a projection point of DMUA
using Model (2), pk represents a hyperplane in which
the projection point satised hyperplane pk equation.
It is, however, to be noted that if DMU(k)A satises multiple hyperplanes{it is laid on the intersection of hyperplanes{we should follow the rest of the process for all of them. Following this, from DMU(k)A , we will consider ^DMU(k)A whose eciency is
A= A+%. To
calculate the input/output amounts of ^DMU(k)A , use the following formula:
^
DMU(k)A =~x(k)A ; ~yA(k)= x(k)A
A ; y (k) A
!
= Ax(k)A
A ; y (k) A
!
: (10)
Suppose that P0
kis the hyperplane that passes through
^
DMU(k)A and has the same normal vector as hyperplane pk. By dening 1, we nd the extreme ecient DMUs
that lie on hyperplane pk so that at least one of its
inputs or outputs is more than DMU(k)A (in case of the existence of more than one DMU, follow the same process for all of them). Whether such a DMU exists or not, the following two case studies are considered: Case 1. If such a DMU exists, consider the new DMU as DMU(k+1)A subscript. Now, we must consider whether DMU(k+1)A belongs to REA or not:
i) If DMU(k+1)A belongs to REA, suppose that
hy-perplane pk+1represents a dening ecient
hyper-plane in which DMU(k+1)A satises hyperplane pk+1
Equation. Consider ^DMU(k+1)A , whose eciency is
A = A + %. To calculate the input/output
amounts of ^DMU(k+1)A , use the following formula: ]
DNU(k+1)A =~x(k+1)A ; ~yA(k+1) = x(k+1)A
A ; y (k+1) A
!
: (11)
a) If ^DMU(k+1)A belongs to REA, suppose that
hyperplane P0
k+1 is the equation which passes
through ^DMU(k+1)A and has the same normal vector as hyperplane pk+1; hence, start the
process from the beginning;
b) If ^DMU(k+1)A does not belong to REA, suppose
that hyperplane P0
k+1 is the equation which
passes through ^DMU(k+1)A and has the same normal vector as hyperplane pk+1; then, to nd
a point on hyperplane P0
k+1, use the following
proposed model:
max ' + "(1s++ 1s );
s.t. Xn
j=1
jxj= xA s ; n
X
j=1
jyj= 'yA+ s+; n
X
j=1
j = 1;
U 'yA+s+ V xA s +uo=0;
j 0; (12)
where UY V X + u o = 0 is the equation of
hyperplane P0 k+1.
Theorem 1. The eciency score of each trans-formed point of the extreme ecient DMUs is
A.
Proof. Assume ^DMU(k+1)A with coordinates:
x^
DMU(k+1)A ; yDMU^ (k+1) A
= x(k+1)A
A ; y (k+1) A
! ; as an arbitrary transformed extreme ecient DMU that belongs to the virtual improved fron-tiers. Considering ^DMU(k+1)A with the BCC input-oriented model, we obtain:
min DMU^(K+1) A ;
s.t. Xn
j=1
jxj ^DMU(K+1) A xDMU^
(K+1) A
= DMU^(K+1) A 1 A x(K+1)A
;
n
X
j=1
jyj yDMU^(K+1) A = y
(K+1) A ; n
X
j=1
j = 1;
j 0; (13)
A feasible solution of this model can be:
(^
DMU(k+1)A =
A; DMU^(k+1)A = 1;
j= 0 (j 6= ^DMU (k+1) A )):
Then, the optimal ^DMU(k+1) A , i.e.,
^ DMU(k+1)A
, is not greater than
A:(DMU^(k+1) A
A).
It will be sucient to show that ( ^ DMU(k+1)A
A).
By the contradictory assumption, suppose that (
^ DMU(k+1)A
<
A). Hence, DMU^(k+1) A
=
A "
for some " > 0. By evaluating Model (13) with this assumption, we get:
8 > > > > > > > > > > > > > > > > > > > > > > < > > > > > > > > > > > > > > > > > > > > > > : n X j=1
jxj DMU^(K+1) A x^DMU
(K+1) A
= ^ DMU(K+1)A
1
A
x(K+1)A
= A " A x(K+1)A = 1 " A x(K+1)A
n
P
j=1jyj yDMU^(K+1)A = y
(K+1) A n
P
j=1j = 1
j 0;
It is obvious that (1 "
A) < 1. In this manner, a
feasible solution for DMU(k+1)A is: DMU(k+1)
A = (1
"
A) < 1; DMU
(k+1) A = 1;
j= 0; (j 6= DMU(k+1)A ):
Consequently, DMU(k+1)A is inecient and is in contrary to the assumption.
Therefore, we have ^
DMU(k+1)A =
A, thus
completing the proof.
Let an optimal solution of Model (12) be ('; s ; s+). Based on the following theorems,
this model gives us a point that rstly belongs to REA; secondly, this reference point of DMUA,
i.e., (xA s ; 'yA+ s+), dominates DMUAand
belongs to hyperplane P0 k+1.
Theorem 2. Given Model (12), we have:
a) (xA s ; 'yA+ s+) is a dominating DMUA
and, thus, (xA s ; 'yA+ s+) also belongs
to REA;
b) (xA s ; 'yA+s+) lies on hyperplane Pk+10 ;
c) Model (12) is feasible. Proof.
(a) Since s 0, s+ 0, and ' 0, then we
have (xA s xA) and ('yA+ s+ yA).
Considering DMUAas an inecient unit,
the optimal solution of Model (12) is expressed as ('> 1) or [(s :s+) 6= 0]. Then, we have:
(xA s )
'y
A+ s+
6=
xA
yA
;
which means that (xA s ; 'yA+ s+) is a
dominating DMUA; thus, (xA s ; 'yA+
s+) also belongs to REA;
(b) Evidently, based on the fourth constraint of Model (12), the obtained reference point from Model (12), i.e., point (xA s ; 'yA+ s+),
lies on hyperplane P0
k+1: UY V Y + u o= 0;
(c) Considering that the extreme points used in the proposed algorithm belong to REA, if
the extreme DMU does not belong to REA
in one step, the new obtained point from Model (12) will be in REA in the next step of
the algorithm (see Section b in Case 1). Thus, each transformed point of the extreme ecient DMUs will belong to REA (if the transformed
point of the extreme DMU does not belong to REA in one step, then the new obtained point
from Model (12) will be in REA in the next
step of the algorithm (see Section ii) in Case 1)).
According to the algorithm procedure, the new improved facets (the new virtual frontiers) are obtained from the convex hull of these points. Besides, PPS is convex and, thus, the convex hull of these points belongs to REA; consequently, the
new improved facets also belong to REA.
This illustrates not only the fact that the fourth constraint belongs to REA, but also that the
reference point of DMUA, i.e., (xA s ; 'yA+
s+), belongs to RE
A (based on Part A of
Theo-rem 2). The model is thus always feasible. Replace the new point with ^DMU(k+1)A by connecting DMUA to the new point ^DMU
(k+1) A ,
which lies on hyperplane P0
k+1 (see Figure 1); this
process is nished;
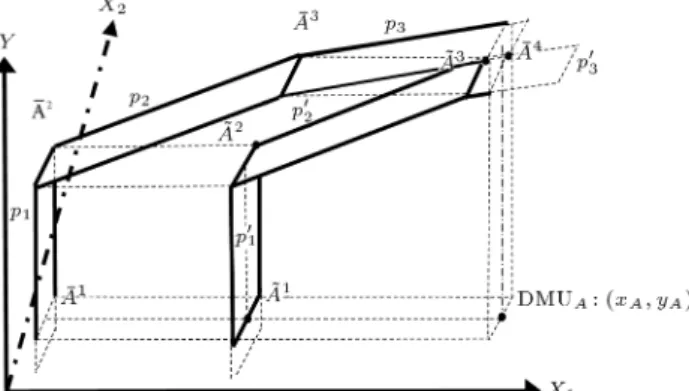
Figure 1. The benchmarking region of eciency (Case 1).
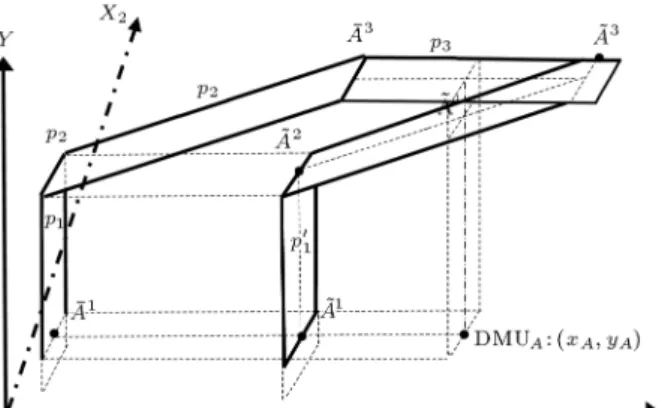
Figure 2. The benchmarking region of eciency (Case 2. ^
DMU(3)A belongs to REA).
ii) If DMU(k+1)A does not belong to REA, then the
process is the same with Part b) of Section i), except that instead of the equation of hyperplane P0
k+1 in the fourth constraint of Model (12), the
fourth constraint is replaced with hyperplane P0 k.
Case 2. If such a unit does not exist, hyperplane pk+1is a weak dening hyperplane. Similarly, calculate
the output/input amounts of ^DMU(k+1)A by Eq. (11). If ^DMU(k+1)A belongs to REA, then it is sucient to
connect DMUAto ^DMU (k+1)
A (see Figure 2); otherwise,
nd a point from Model (12) with the equation of hyperplane P0
k+1in the fourth constraint.
Replace the new point with ^DMU(k+1)A and name it ^DMU(k+1)A . It is then sucient to connect DMUAto
^
DMU(k+1)A s (see Figure 3).
Evidently, ^DMU(k+1)A lies on both hyperplanes, P0 k
and P0
k+1. Throughout the algorithm,
^
DMU(1)A ! ^DMU(2)A ! ! ^DMU(k+1)A
represents the benchmarking movement in which the points ^DMU(1)A :^DMU(2)A : :^DMU(k+1)A lie on hyper-planes P0
sub-Figure 3. The benchmarking region of eciency (Case 2. ^
DMU(3)A does not belong to REA).
scripts of the ecient improved faces of the PPS for DMUAis considered (except the second part of Case 2
in which ^DMU(k+1)A lies on hyperplane P0
k). Note
that all the new shifted units of the extreme points in the PPS have an equivalent eciency value of
A=
(K)
A + %.
Hence, starting at benchmark point ^DMU(1)A , passing through all the obtained hyperplanes through-out the algorithm and, eventually, stopping at ^
DMU(k+1)A , one can achieve the benchmark region of deciency improvement.
Among the previous works, this study explores an improved benchmark and, sequentially, an improved re-gion of eciency for an inecient DMU. In comparison, some papers nd a benchmark turning the inecient DMU to an ecient DMU [25]. Additionally, some other papers used the DEA sensitivity analysis just to explore a point as a virtual benchmark for an inecient DMU [18].
Practically, an inecient DMU sometimes cannot improve its performance to the best practice by either decreasing its inputs or increasing its outputs.
The current paper suggests an improved region that is characterized such that the eciency value of each point in this region will be derived by the hyperplane with the same normal vector of the orig-inal PPs hyperplane. In fact, we improve all the hyperplanes that belong to REA. Considering that
any change has implications, the process of nding a suitable benchmark is constantly faced with changes and evidently increasing costs. We, therefore, always try to remove or reduce these changes. The strength of the present approach is that, with considerably little numerical eort, one can get an insight into the improved eciency region of a given DMU; unlike many previous works, it is based on exact results of a well-dened value judgment.
The proposed algorithm. The summary of the
proposed algorithm is given below. Here, DMUA is
considered as an inecient DMU under evaluation in order to nd a new region by increasing the eciency (obtained by Model 2) of DMUA by %.
Step 1. Find all the dening (ecient) hyperplanes of the PPS. Let P = fp1; ; p2; ptg be the set of
these dening (ecient) hyperplanes;
Step 2. Assume that k = 1 and 1= fDMUjjj= 1
and j= 1 in assessing DMUj by Model (2)g;
Step 3. Solve Model (2) and set DMU(k)A as a projection point of DMUA;
Step 4. Look for pk representing a hyperplane that
DMU(k)A satises in hyperplane pk equation;
Step 5. From DMU(k)A , consider ^DMU(k)A whose eciency is
A = A + %. To calculate the
input/output amounts of ^DMU(k)A , use the following formulas:
For k = 1; ^
DMU(k)A =~x(k)A ; ~yA(k)= x(k)A
A ; y (k) A
!
= Ax(k)A
A ; y (k) A
! :
Step 6. Find the equation of hyperplane P0 k which
passes through ^DMU(k)A and has the same normal vector as hyperplane pk;
Step 7. Using the denition of 1, look for extreme
ecient DMUs that lie on hyperplane pk so that
at least one of its inputs or outputs is more than DMU(k)A . (In the case of the existence of more than one DMU for all of them, follow the process from Step 8.) If such a DMU exists, go to Step 8; otherwise, go to Step 9;
Step 8. Subscript the new DMU as DMU(k+1)A . If DMU(k+1)A belongs to REA, then proceed to Step 10;
otherwise, proceed to Step 11;
Step 9. If such a unit does not exist, i.e., hyperplane pk+1 is a weak dening hyperplane, calculate the
output/input amounts of ^DMU(k+1)A from Eq. (11). If
^
DMU(k+1)A belongs to REA, then proceed to Step 14;
otherwise, proceed to Step 15;
Step 10. If DMU(k+1)A belongs to REA, hyperplane
pk+1 represents a dening ecient hyperplane in
which DMU(k+1)A satises hyperplane pk+1 equation.
Consider ^DMU(k+1)A whose eciency is
To calculate the input/output amounts of ^DMU(k+1)A , use the following formula:
^
DMU(k+1)A =~x(k+1)A ; ~y(k+1)A = x(k+1)A
A ; y (k+1) A
! : (14) Here, we confront two cases: either ^DMU(k+1)A be-longs to REA, then proceed to Step 12; or it does not
belong to REA, then proceed to Step 13;
Step 11. If DMU(k+1)A does not belong to REA,
then, by using Model (12), except that instead of the equation of hyperplane P0
k+1in the fourth constraint
of Model (12), the fourth constraint is replaced with the equation of hyperplane P0
k.
Replace the new point with ^DMU(k+1)A and name it ^DMU(k+1)A . By connecting DMUA to the
new point, ^DMU(k+1)A , which lies on hyperplane P0 k
and has at least one input/output value of DMUA,
this process is nished. Proceed to Step 16;
Step 12. If ^DMU(k+1)A belongs to REA, suppose
that hyperplane P0
k+1 is the equation that passes
through ^DMU(k+1)A and has the same normal vector as hyperplane pk+1; hence, proceed to Step 7;
Step 13. If ^DMU(k+1)A does not belong to REA,
suppose that hyperplane P0
k+1 is the equation which
passes through ^DMU(k+1)A and has the same normal vector as hyperplane pk+1; then, nd a point from
Model (12) in which the fourth constraint is the equation of hyperplane P0
k+1. Replace the new point
with ^DMU(k+1)A . By connecting DMUA to the new
point, ^DMU(k+1)A , which lies on hyperplane P0 k+1, this
process is nished;
Step 14. If ^DMU(k+1)A belongs to REA, then it is
sucient to connect DMUA to ^DMU (k+1)
A . Proceed
to Step 16;
Step 15. If ^DMU(k+1)A does not belong to REA, nd
a point from Model (12) with the equation of hyper-plane P0
k+1in the fourth constraint. Replace the new
point with ^DMU(k+1)A and name it ^DMU(k+1)A . Then, it is sucient to connect DMUA to ^DMU
(k+1) A ;
Step 16. Stop.
The PPS is a polyhedral convex set whose ver-tices correspond to the ecient DMUs. Besides, a polyhedron is dened as the intersection of a nite collection of generalized halfspaces. More generally,
a half space is either of the two parts into which a hyperplane divides an ane space. Since the number of the dening hyperplane of a PPS is nite, the number of the new improved hyperplanes is less than that of the dening hyperplanes. The validity of the algorithm is, therefore, obvious owing to the nite number of dening hyperplanes.
4. Numerical example
This section provides a numerical example that helps clarify the concept of the improved region of the DMU's eciency and its comparative advantage over conventional DEA models.
In light of the growing strategic importance of the function of managing a company's most important asset{its reputation{there is a need of fundamentally evaluating the improved region of the DMU's eciency to obtain a guideline for future planning.
Example 1: Let us assume that we have eight sample DMUs, each using one input to produce one output with the data given in Table 1. All the virtual and real DMUs are depicted in Figure 4. By the foregone algorithm.
For nding the improved region by increasing the eciency (obtained from Model (2)) of DMUG by
% = 13:75%, we rst nd all the maker hyperplanes of PPS. These hyperplanes' set is as follows:
f x+2 = 0; y 4x+6=0; 2y x 9=0; y 8=0g:
Table 1. Sample DMUs.
DMU A B C D E F G H
Input 2 3 7 4.4 3.3 6 4 8
Output 2 6 8 6 4.5 5 3 4
1 = fDMUA; DMUB; DMUCg is the set of the
extreme ecient DMUs of the data of Table 1. By solving Model (2) and setting DMU(1)G as the projection point of DMUG, we have:
DMU(1)G = (x; y) = (2:25; 3):
From DMU(1)G , which lies on p1: y 4x + 6 = 0, we are
considering ^DMU(1)G , whose eciency is:
G= 0:5685%=13:75%:!G = G + % = 0:7:
Using Eq. (10), we calculate the input/output amounts of ^DMU(1)G :
^
DMU(1)G =~x(1)G ; ~yG(1)= (3:2143; 3): Now, we are looking for hyperplane p0
1, which passes
through ^DMU(1)G and has the same normal vector as hyperplane p1; this is shown as follows:
y 4x + 12:857 = 0:
DMUB is an extreme ecient DMU that lies on
hyperplane p1; its inputs and outputs are more than
DMU(1)G .
Since DMUB belongs to REG, we subscript it as
DMU2G.
A dening ecient hyperplane in which DMU2A satises hyperplane p2equation, is represented by p2=
2y x 9 = 0. By Eq. (11), we calculate ^DMU2G, whose eciency is = 0:7, as follows:
^
DMU2G= ~x2 G; ~yG2
= (4:2857; 6):
The equation of the hyperplane which passes through ^
DMU(2)G and has the same normal vector as hyperplane p2 is as follows:
P0
2= 2y x 7:7143 = 0;
since ^DMU2Gdoes not belong to REG, based on Step 13
of the algorithm, we replace ^DMU2Gwith the new point (4, 5/85715) obtained from Model (12), which lies on hyperplane P0
2and has at least one input/output value
of DMUG (see Figure 4).
Since there is no other DMU in REG, there are
also no other improved hyperplanes.
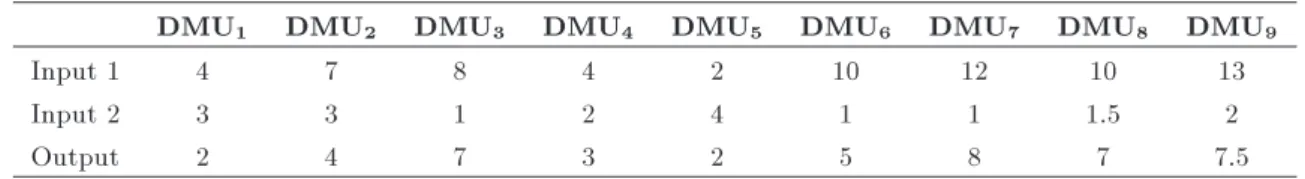
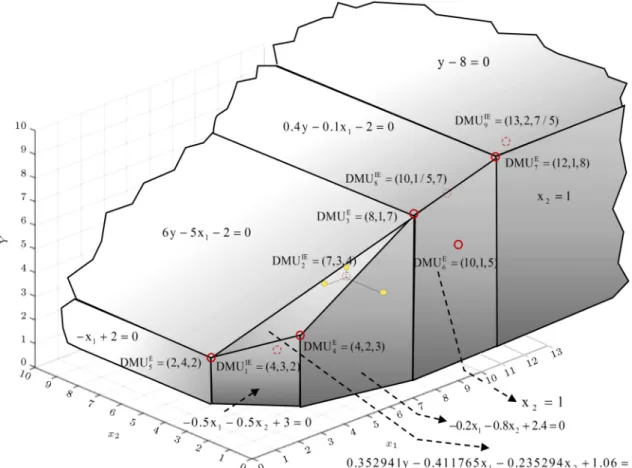
Example 2: The data of 9 DMUs from Hosseinzadeh Lot's paper (2011) [19] are used as a numerical example and consist of two inputs and one output, as shown in Table 2.
We intend to nd the improved region of the DMU's eciency using the data in Table 2. We, therefore, use the proposed algorithm to obtain the improved eciency region of DMU2 by increasing its
current eciency value (
2 = 0:6885246 to % =
11=1475%).
After nding all the dening hyperplanes as shown in Figure 5, the set of extreme ecient points of PPS is as follows:
1= fDMU3; DMU4; DMU5; DMU7g:
By determining the radial projection reference point of DMU2 by Model (2) DMU(1)2 , we look for hyperplane
p1 in which DMU(1)2 satises hyperplane p1 equation:
DMU2= (x1; x2; y) = (7; 3; 4) ! DMU(1)2
= (0:6885246(7); 0:6885246(3); 4);!DMU(1)2 = (4:8196722; 2:0655738; 4);
p1: 0:352941y 0:411765x1 0:235294x2+1:06=0:
Now, we intend to nd ^DMU(1)2 , whose eciency is
2+ % = 0:8. The input/output amounts of ^DMU (1) 2
are calculated as follows: ^
DMU(1)2 =~x(1)12; ~x(1)22; ~y(1)2 =
0:6885246(7)
0:8 ;
0:6885246(3)
0:8 ; 4
= (6:02459025; 2:58196725; 4):
In Step 6, we nd the equation of hyperplane P0 1
which passes through ^DMU(1)2 and has the same normal vector as hyperplane p1 which is as follows:
p1= (; ; ) = (0:352941; 0:411765; 0:235294);
Table 2. The data of the eight DMUs.
DMU1 DMU2 DMU3 DMU4 DMU5 DMU6 DMU7 DMU8 DMU9
Input 1 4 7 8 4 2 10 12 10 13
Input 2 3 3 1 2 4 1 1 1.5 2
Figure 5. The visual description scheme.
(y yA) + (x1 x1A) + (x2 x2A) = 0 !
0:352941(y 4) 0:411765(y 4)
0:411765(x1 6:02459025)
0:235294(x2 2:58196725) = 0;
P0
1: 0:352941y 0:411765x1 0:235294x2
+ 1:676472806 = 0:
DMU3and DMU5are the extreme ecient DMUs lying
on hyperplane p1 where at least one of their inputs
or outputs is more than DMU(1)2 . Based on Step 11 of the algorithm, since DMU(2)2 does not belong to RE2, we nd point ^DMU
(2)
A = (7; 2:4687495; 5:062504)
by Model (12) in which the fourth constraint is the equation of hyperplane P0
1.
At this point, to clarify the strategy of the pro-posed algorithm, we follow the algorithm for DMU9=
(13; 2; 7:5) as follows.
We solve Model (2) and nd that DMU(1)9 is a projection point of DMU9; DMU(1)9 = (10; 1:5; 7:5).
The equation of a hyperplane is p1: 0:4y 0:1x1
2 = 0, such that DMU(1)9 satises its equation.
Now, we consider ^DMU(1)9 whose eciency is 9 =
9 + % = 0:769230769 + 0:130769231 = 0:9(% =
13:0769231%).
By Eq. (10), the following unit is calculated: ^
DMU(1)9 = (11:1; 1:709401709; 7:5) The equation of hyperplane P0
1is 0:4y 0:1x1 1:8 = 0
The extreme ecient DMU that lies on hyper-plane p1 is DMU7 = DMU(2)9 and its rst input is
greater than DMU(1)9 .
As DMU(2)9 belongs to RE9, based on Step 10 of
the proposed algorithm, we nd two dening ecient hyperplanes, p2and p3, in which DMU(2)9 satises their
equations as follows: (
p2: y 8 = 0
p3: x2 1 = 0
Now, by using Eq. (11), ^DMU(2)9 is considered, whose eciency is
9 = 0:9 : ^DMU (2)
9 = (13:3; 1:1; 8).
As ^DMU(2)9 does not belong to RE9, suppose that
P0
2 : y 8 = 0; P30 : x2 1:1 = 0 are the equations of
the same normal vector as hyperplanes p2 and p3,
respectively.
In addition, there is no other extreme ecient unit that passes through equations of hyperplanes p2and p3.
Based on Step 13, to understand the improved region better, Model (12) is employed. In the equation of y 8 = 0, the obtained point is (9:73; 1:26; 8:0000325); in the equation of x2 1:1 = 0, the obtained point
is (13; 1:2; 8:6750025). We replace the new points with ^DMU(2)9 and ^DMU(3)9 . By connecting DMU9 to
the new points, ^DMU(2)9 and ^DMU(3)9 , which lie on hyperplanes P0
2 and P30, the process is nished. The
part of improved obtained hyperplanes P0
1, P20, and P30,
included in the points ^DMU(1)9 , ^DMU(2)9 , and ^DMU(3)9 , is the improvement benchmarking region.
Note that, in Figure 5, notations DMUEj and
DMUIE
j , j = 1; ; n, respectively, represent the
ecient and inecient units. 5. Conclusions
As it is an issue of considerable importance, this study sought to make the standards more exible for choosing the benchmarks. This standard can, however, dier from that of decision-makers. If a company has a specic corporate strategy or future vision, the standards for choosing benchmarks might be more complex. There is a central question in the evaluation of an inecient DMU: instead of having a benchmark with an eciency value of one, how can an inecient DMU achieve a more realistic benchmark in which the eciency is less than one? This means that a wide range of knowledge on this study becomes available. A framework for dening a benchmark region in evalu-ating an inecient DMU was derived from the value judgment by increasing the current eciency. This paper developed a procedure for shifting the ecient frontier toward the inecient DMU. The procedure yielded an exact improved region that is derived by increasing the eciency score of a specic inecient DMU by %, and the eciency score of each point belonging to the new improved frontiers is dierent. It is indeed a new virtual frontier that is recognized as a realistic benchmarking region for the under-evaluated inecient DMU. One of the advantages of the current analysis is the incorporation of value judgment into the current situation of hyperplanes through specic eciency improvement for the under-evaluated ine-cient DMU. The value judgment here can, therefore, be represented by the improved region concept. In addition, we used the sensitivity analysis of eciency to nd the new region. Further research will concentrate on the region of the MPSS (Most Productive Scale Size) by using hyperplanes to evaluate DMUs.
References
1. Charnes, A., Cooper, W.W., and Rhodes, E. \Measur-ing the eciency of decision mak\Measur-ing units", European Journal of Operational Research, 2, pp. 429-444 (1978).
2. Tavana, M. and Khalili-Damghani, K. \A new two-stage Stackelberg fuzzy data envelopment analysis model", Measurement, 53, pp. 277-296 (2014).
3. Banihashemi, S., Tohidi, G., and Sanei, M. \Sen-sitivity analysis of ecient and inecient units in integer-valued data envelopment analysis", Interna-tional Journal of Mathematical Modelling & Compu-tations, 4, pp. 45-53 (2014).
4. Banker, R.D., Charnes, A., and Cooper, W.W. \Some models for estimating technical and scale ineciencies in data envelopment analysis", Management Science, 30, pp. 1078-1092 (1984).
5. Bogetoft, P. and Hougaard, J.L. \Eciency evalua-tions based on potential (non-proportional) improve-ments", Journal of Productivity Analysis, 12, pp. 233-247 (1999).
6. Diabat, A., Shetty, U., and Pakkala, T. \Improved eciency measures through directional distance for-mulation of data envelopment analysis", Annals of Operations Research, 229, pp. 325-346 (2015).
7. Kao, C. \Eciency improvement in data envelopment analysis", European Journal of Operational Research, 73, pp. 487-494 (1994).
8. Chen, T.-H., Bao, C.-P., and Chang, S.-Y. \Another view of eciency improvement in data envelopment analysis", Journal of the Chinese Institute of Industrial Engineers, 26, pp. 109-114 (2009).
9. Khoshfetrat, S. and Daneshvar, S. \Improving weak eciency frontiers in the fuzzy data envelopment analysis models", Applied Mathematical Modelling, 35, pp. 339-345 (2011).
10. Akbarian, D. \On characterizing weak dening hyper-planes (weak Facets) in DEA with constant returns to scale technology", arXiv preprint arXiv:1409.7546, (2014).
11. Hadi-Vencheh, A., Jablonsky, J., and Esmaeilzadeh, A. \The slack-based measure model based on support-ing hyperplanes of production possibility set", Expert Systems with Applications, 42, pp. 6522-6529 (2015).
12. Jahanshahloo, G.R., Lot, F.H., and Zohrehbandian, M. \Finding the piecewise linear frontier production function in data envelopment analysis", Applied Math-ematics and Computation, 163, pp. 483-488 (2005).
13. Korhonen, P. \Searching the ecient frontier in data envelopment analysis", In Aiding Decisions with Mul-tiple Criteria, Springer, pp. 543-558 (2002).
14. Jahanshahloo, G.R., Hosseinzadeh, F., Rezai, H.Z., and Balf, F.R. \Finding strong dening hyperplanes of production possibility set", European Journal of Operational Research, 177, pp. 42-54 (2007).
15. Yu, P. and Zeleny, M. \The set of all nondominated solutions in linear cases and a multicriteria simplex method", Journal of Mathematical Analysis and Ap-plications, 49, pp. 430-468 (1975).
16. Hosseinzadeh, F., Jahanshahloo, G.R., Mozaari, M., and Gerami, J. \Finding DEA-ecient hyperplanes using MOLP ecient faces", Journal of Computational and Applied Mathematics, 235, pp. 1227-1231 (2011).
17. Charnes, A., Cooper, W.W., Lewin, A.Y., Morey, R.C., and Rousseau, J. \Sensitivity and stability analysis in DEA", Annals of Operations Research, 2, pp. 139-156 (1984).
18. Forghani, A. and Naja, E. \Sensitivity analysis in two-stage DEA", Iranian Journal of Optimization, 07, pp. 872-886 (2015).
19. Khalili-Damghani, K. and Taghavifard, B. \Sensitivity and stability analysis in two-stage DEA models with fuzzy data", International Journal of Operational Re-search, 17, pp. 1-37 (2013).
20. Huang, Z., Li, S., and Rousseau, J. \Determining rates of change in data envelopment analysis", Journal of the Operational Research Society, 48, pp. 591-593 (1997).
21. Jahanshahloo, G.R., Hosseinzadeh, F., Shoja, N., Sanei, M., and Tohidi, G. \Sensitivity and stability analysis in DEA", Applied Mathematics and Compu-tation, 169, pp. 897-904 (2005).
22. Ebrahimkhani, N., Hosseinzadeh, F., Rostamy-Malkhalifeh, M., Jahanshahloo, G., and Namin, M.A. \An improved approach on sensitivity and stability analysis in DEA", International Journal of Applied Mathematics and StatisticsTM, 56, pp. 75-84 (2017).
23. Kordrostami, S., Pourjafar, S., and Pourjafar, H. \A geometric method in data envelopment analysis to obtain the region of eciency", Indian Journal of Science and Technology, 6, pp. 4116-4122 (2013).
24. Zamani, P. and Borzouei, M. \Finding stability re-gions for preserving eciency classication of variable returns to scale technology in data envelopment anal-ysis", Journal of Industrial Engineering International, 12, pp. 499-507 (2016).
25. Farrell, M.J. \The measurement of productive e-ciency", Journal of the Royal Statistical Society. Series A (General), 120, pp. 253-290 (1957).
26. Kerstens, K. and Vanden^a Eeckaut, P., Technical E-ciency Measures on DEA and FDH: A Reconsideration of the Axiomatic Literature, In Universite Catholique de Louvain, Center for Operations Research and Econometrics (CORE) (1995).
27. Colwell, R.J. and Davis, E.P. \Output and produc-tivity in banking", The Scandinavian Journal of Eco-nomics, S111-S129 (1992).
28. Lovell, C.K. and Schmidt, P. \A comparison of alterna-tive approaches to the measurement of producalterna-tive e-ciency", In Applications of Modern Production Theory: Eciency and Productivity, Springer, pp. 3-32 (1988).
29. Pahlavan, R., Omid, M., and Akram, A. \Application of data envelopment analysis for performance assess-ment and energy eciency improveassess-ment opportuni-ties in greenhouses cucumber production", Journal of Agricultural Science and Technology, 14, pp. 1465-1475 (2012).
30. Coelli, T. \A multi-stage methodology for the solution of orientated DE models", Operations Research Let-ters, 23, pp. 143-149 (1998).
31. Portela, M.C.A.S., Borges, P.C., and Thanassoulis, E. \Finding closest targets in non-oriented DEA models: the case of convex and non-convex technologies", Jour-nal of Productivity AJour-nalysis, 19, pp. 251-269 (2003).
32. Post, T. and Spronk, J. \Performance benchmarking using interactive data envelopment analysis", Euro-pean Journal of Operational Research, 115, pp. 472-487 (1999).
33. Russell, R.R. \Measures of technical eciency", Jour-nal of Economic Theory, 35, pp. 109-126 (1985).
34. Frei, F.X. and Harker, P.T. \Projections onto ecient frontiers: theoretical and computational extensions to DEA", Journal of Productivity Analysis, 11, pp. 275-300 (1999).
35. Golany, B., Phillips, F., and Rousseau, J. \Models for improved eectiveness based on DEA eciency results", IIE Transactions, 25, pp. 2-10 (1993).
36. Baek, C. and Lee, J.-D. \The relevance of DEA bench-marking information and the least-distance measure", Mathematical and Computer Modelling, 49, pp. 265-275 (2009).
37. Sayin, S. \An algorithm based on facial decomposition for nding the ecient set in multiple objective linear programming", Operations Research Letters, 19, pp. 87-94 (1996).
38. Jahanshahloo, G., Lot, F.H., and Akbarian, D. \Finding weak dening hyperplanes of PPS of the BCC model", Applied Mathematical Modelling, 34, pp. 3321-3332 (2010).
39. Seiford, L.M. and Zhu, J. \Context-dependent data envelopment analysis-measuring attractiveness and progress", Omega, 31, pp. 397-408 (2003).
40. Sh. Banihashemi, M.S., Abri, A.GH., and Sourani, F. \Finding `Improvement region' for the inecient units in data envelopment analysis", Applied Mathematics & Information Sciences, Appl. Math. Inf. Sci., 10, pp. 1169-1176 (2016).
41. Cherchye, L. and Van Puyenbroeck, T. \A comment on multi-stage DEA methodology", Operations Research Letters, 28, pp. 93-98 (2001).
Biographies
Nasrin Ebrahimkhani Ghazi is a PhD Student at the Mathematics Department of the Islamic Azad University, Sciences and Research Branch, Tehran, Iran. Her research interests include data envelopment analysis and operation research.
Farhad Hosseinzadeh Lot is a Professor at the Department of Mathematics, Science and Research Branch, Islamic Azad University, Tehran, Iran. His major research interests are operations research and data envelopment analysis. His publications have appeared in several journals, including European Jour-nal of OperatioJour-nal Research, Computers Industrial Engineering, Journal of the Operational Research So-ciety, Applied Mathematics and Computation, Applied Mathematical Modelling, Mathematical and Computer Modelling, and Journal of the Operational Research Society of Japan, among others.
Mohsen Rostamy-Malkhalifeh is an Associate Pro-fessor of the Department of Mathematics, Science and Research Branch, Islamic Azad University, Tehran,
Iran. His major research interests are operations research and data envelopment analysis.
Gholamreza Jahanshahloo is a Professor at the Department of Mathematics, Teacher Training Uni-versity, Tehran, Iran. He also published more than 100 papers in national and international journals. Approximately 60 PhD students have graduated under his supervision. His elds of research interest are operations research and data envelopment analysis. His publications have appeared in several journals, including European Journal of Operational Research, Computers Industrial Engineering, Journal of the Operational Research Society, Applied Mathematics and Computation, Applied Mathematical Modelling, Mathematical and Computer Modelling, and Journal of the Operational Research Society of Japan, among others.
Mahnaz Ahadzadeh Namin is an Assistant Professor at the Department of Mathematics, Shahr-e -Qods Branch, Islamic Azad University, Tehran, Iran. Her research interests include operations research and data envelopment analysis.