Distribution of Pulmonary Neuroendocrine Cells and Neuroendocrine
Bodies among Healthy and Asthmatic Adult Lung Subjects
By:
Caroline Minnick
Senior Honors Thesis
Biology
University of North Carolina at Chapel Hill
19 March 2019
TABLE OF CONTENTS
1. ABSTRACT ... 3
2. INTRODUCTION ... 5
3. METHODS ... 8
3.1. Lung Sample Donor Demographics ... 8
3.2. Tissue Preparation for Immunohistochemistry ... 8
3.3. Immunolabeling of Gastrin Releasing Peptide ... 9
3.4. Slide and Data Analysis ... 11
3.5. Quantitative PCR of GRP ... 11
4. RESULTS ... 13
4.1. Normal/Healthy Adult Subjects ... 14
4.2. Asthmatic Adult Subjects ... 17
5. DISCUSSION AND CONCLUSIONS ... 22
6. ACKNOWLEDGEMENTS ... 24
7. REFERENCES ... 25
LIST OF TABLES Table 1: Demographics of Subjects and Experimental Use ... 8
LIST OF FIGURES Figure 1: Representative Microscope Images of PNECs and NEBs in the Trachea and Distal Airways of Normal Subject ... 14
Figure 2: Density and Distribution of PNECs and NEBs in the Lungs of Normal Healthy Adult Subjects. ... 15
Figure 3: NEB Density in the Distal Airway of Normal Healthy Subjects ... 16
Figure 4: mRNA Expression of GRP in Normal Subjects ... 17
Figure 5: Density and Distribution of PNECs and NEBs in the Lungs of Asthmatic Subjects. ... 18
Figure 6: NEBs in the Distal Airway of Asthmatic Subjects ... 19
Figure 7: Density of NEBs in Terminal Bronchioles Normal and Asthmatic Subjects. ... 20
1.
ABSTRACT
2.
INTRODUCTION
Pulmonary neuroendocrine cells (PNECs) are a specialized cell type found in the epithelium of the lungs. They were first noted in scientific literature in the 1940s when Feyrter and Fröhlich discovered clear cells, which were soon thereafter named as neuroendocrine cells1. As research is still developing and solidifying in regards to the pulmonary neuroendocrine system, there have been many names and proposed roles for these cells throughout the years. During the 1990s, a fairly concrete consensus was reached among researchers, and the two major, yet distinct, functions of the pulmonary endocrine system were clarified2. The first role of the proposed dual role is, during early lung development, PNECs may function to monitor and modulate the growth and differentiation of the lung via their ability to secrete peptides, amines, and neurotransmitters. Due to this supposed role of the system, it is commonly found that the densities of PNECs and NEBs are higher in fetuses and very young, developing humans3. The second half of the dual role is, later in fetal life and postnatally, the cells may act as a system of chemoreceptors2. There is data that suggests that PNECs sense inhaled inputs (allergen, toxins, etc.) or states such as hypoxia and coordinate lung outputs to respond to the stimuli8,3. While the embryonal lung and neonatal lung have been large areas of investigation for researchers, the adult lung is a very active area for discovery and growth with respect to the understanding of the physiology and function of the pulmonary neuroendocrine system in both normal subjects and diseased subjects. Pulmonary neuroendocrine cells can exist independently of one another as solitary cells or in clusters as neuroendocrine bodies. These cell types are primarily localized at airway branch points throughout the lung where they can transmit signals to other nearby cells8.
body. The irregular cell shape is accompanied by secretory granules that contain amines and peptides for secretion and signaling, with the capability of eliciting an immune response8. There is a multitude of secretions that a neuroendocrine (NE) cell is capable of releasing. The most common human secretion is gastrin-releasing peptide (GRP), often called bombesin-like peptide3. GRP is thought to be responsible in part for the production of some cytokines which work to recruit immune cells8. In addition, PNECs appear to work through another of their products, GABA, to stimulate epithelial mucus production. Adding to their distinction, NEBs are typically more heavily innervated than PNECs, and it is presumed that solitary PNECs and NEBs occupy different roles within the lung epithelium3.
as a whole throughout development and into adulthood. Understanding the way these cells distribute themselves throughout the lung based on their two known structures could provide a basis for research into physiology and purpose. A distinct or opposing distribution pattern of PNECs and NEBs in healthy or diseased subjects could uncover nuances of the pulmonary neuroendocrine system that the community is still unfamiliar with. In an attempt to map the relative distributions of PNECs and neuroendocrine bodies (NEBs) in lungs of healthy adult subjects, I performed immunohistochemistry in various lung regions of twelve subjects (six healthy and six asthmatic). The immunohistochemistry results were confirmed through qPCR analysis of nine healthy subjects. In this study, we were able to examine the relationship between cell type and location in order to advance the understanding of the roles of pulmonary
3.
METHODS
3.1.
Lung Sample Donor Demographics
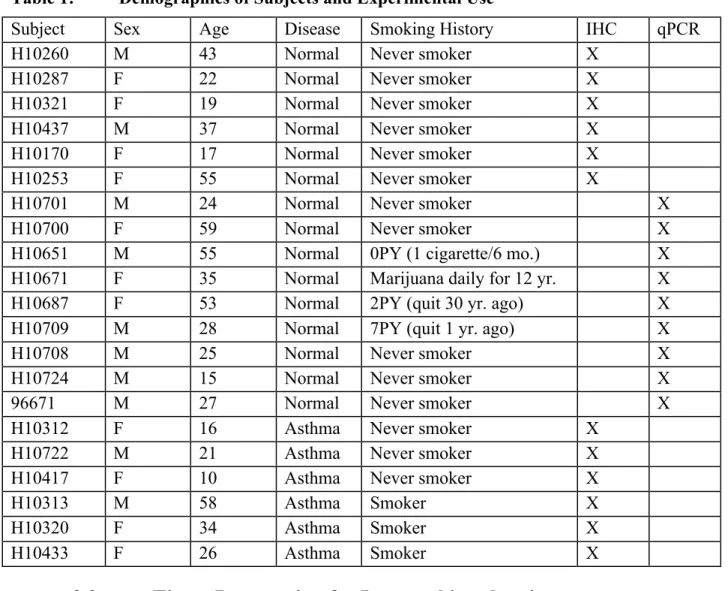
Lung tissue was taken from 16 donors. The demographics of the donors are provided in Table 1, along with information related to the types of experiments in which they were used.
Table 1: Demographics of Subjects and Experimental Use
Subject Sex Age Disease Smoking History IHC qPCR
H10260 M 43 Normal Never smoker X
H10287 F 22 Normal Never smoker X
H10321 F 19 Normal Never smoker X
H10437 M 37 Normal Never smoker X
H10170 F 17 Normal Never smoker X
H10253 F 55 Normal Never smoker X
H10701 M 24 Normal Never smoker X
H10700 F 59 Normal Never smoker X
H10651 M 55 Normal 0PY (1 cigarette/6 mo.) X
H10671 F 35 Normal Marijuana daily for 12 yr. X
H10687 F 53 Normal 2PY (quit 30 yr. ago) X
H10709 M 28 Normal 7PY (quit 1 yr. ago) X
H10708 M 25 Normal Never smoker X
H10724 M 15 Normal Never smoker X
96671 M 27 Normal Never smoker X
H10312 F 16 Asthma Never smoker X
H10722 M 21 Asthma Never smoker X
H10417 F 10 Asthma Never smoker X
H10313 M 58 Asthma Smoker X
H10320 F 34 Asthma Smoker X
H10433 F 26 Asthma Smoker X
3.2.
Tissue Preparation for Immunohistochemistry
10% neutral buffered formalin for 24-36 hours, embedded in paraffin, cut into 5µm thick sections, and placed on slides. Prior to beginning the steps of immunohistochemistry, the slides were baked in an oven at ~48ºC oven for 6-12 hours. The tissue samples were then
deparaffinized through a series of changes in enough xylene and ethanol to cover the sections. The first step of deparaffinization was three changes in xylene for ten minutes each. This was followed by two changes in 100% ethanol for five minutes each, then one change in 95% and 70% ethanol both for five minutes each. To rehydrate the slides, they soaked in phosphate buffered saline (PBS) pH 7.2 for five minutes in glass Coplin jars. To block endogenous
peroxidase activity, the slides were placed in Coplin jars containing a solution of 60mL methanol and 1mL hydrogen peroxide for 15 minutes. The slides were transferred to a Coplin jar
containing PBS for and gently shaken for five minutes.
3.3.
Immunolabeling of Gastrin Releasing Peptide
A solution of 4% donkey serum was prepared by combining a ratio of 1mL normal donkey serum (Jackson Immunoresearch Labs Inc.) to 24 mL of phosphate buffered saline with Tween (PBST). The solution was transferred to plastic Coplin jars (large enough for five slides) and the slides soaked for two hours at room temperature. After the slides blocked with donkey serum, the slides were placed in a slide tray with a very small pool of water to maintain humidity (not touching the slides).
The primary antibody used in this study was the mouse monoclonal antibody GRP E-11: sc-271045 kappa light chain (Santa Cruz Biotechnology Inc.). The primary antibody was combined with 4% donkey serum (reused from step before) at a ratio of 1:100. For primary antibody incubation, 500 µL of the solution was applied to all experimental slides, and they were
antibody (Santa Cruz Biotechnology Inc.) was used in place of the primary anti-GRP antibody. The incubating slides were kept at 4ºC overnight. The next day, the slides were rinsed with PBST three times for ten minutes each. The secondary antibody used in this study was biotinylated donkey anti-mouse IgG (Jackson ImmunoResearch Labs Inc.). The secondary antibody was prepared at a 1:200 dilution with 4% donkey serum in PBST. The same application technique used for the primary antibody (500 µL per slide with plastic cover slip) was applied to the secondary antibody.
Once the slides were finished incubating with Vector ABC, the slides were then stained in the following manner. To begin, the slides were soaked in 0.1M acetate buffer for one minute. Then the slides were transferred to the DAB solution (with hydrogen peroxide) for five minutes. The slides then soaked in 0.1M Tris saline for one minute and then Tris cobalt for four minutes. Afterwards, the slides were washed in DI water briefly and then transferred to fast red to soak for four minutes. Finally, the slides were washed with multiple rounds of DI water to remove excess fast red. To dehydrate and clear the slides, they were dipped 20 times in 70% ethanol, 95% ethanol, 100% ethanol and two changes of xylene. With the experimental steps complete, the slides were finished and covered using glass cover slips and mounting buffer.
3.4.
Slide and Data Analysis
The prepared slides were scanned and digitized using an Olympus VS120 light microscope with a 40X objective lens. Using ImageJ software, the basement membranes of all airways on each slide were measured. The number of PNECs and NEBs for each region of measured basement membrane was counted and recorded. These numbers were then converted to number of
cells/bodies per millimeter of basement membrane in order to determine a density. The average density was calculated for each airway section (trachea, middle, and distal) for each subject. The collection of airways that makes up the middle classification are primary and secondary bronchi. Distal airways are tertiary bronchi and bronchioles.
3.5.
Quantitative PCR of
GRP
4.
RESULTS
In order to identify and quantify the cells of interest in the lung samples, we performed IHC specific for GRP, the human marker protein for the pulmonary neuroendocrine system. Once stained and identifiable, the cells were counted and normalized to the length of the basement membrane in order to determine densities. In this quantification, PNECs and NEBs were
Figure 1: Representative Microscope Images of PNECs and NEBs in the Trachea and Distal Airways of Normal Subject
Microscope images showing isotope control sections and sections using the anti-GRP antibody after IHC. The presence of neuroendocrine cells (of any form) is only seen in experimental sections, as seen from the dark, specific staining.
4.1.
Normal/Healthy Adult Subjects
Initially, we performed IHC specific for GRP on the samples from normal subjects. We
measured the density of both solitary neuroendocrine cells and neuroendocrine bodies from three distinct lung sections (trachea, middle airway, and distal airway) in order to decipher any
trachea versus the distal airways (Welch’s t-test, p≤0.05) and a statistically significant increase in NEBs in distal airways versus in the trachea (Welch’s t-test, p≤0.01) (Figure 2).
Figure 2: Density and Distribution of PNECs and NEBs in the Lungs of Normal Healthy Adult Subjects.
Column Graph Displaying the Densities of PNECs (Left Panel) and NEBs (Right Panel) From Various Subjects, Organized by Lung Section. There is a significant difference between trachea and distal airways with both cell types (Welch’s t-test, p≤0.05 - left, p≤0.01 - right).
Based on the high density of pulmonary neuroendocrine bodies found in distal airways (shown in Figure 2 right panel), we decided to conduct specific distribution studies in only the distal
Figure 3: NEB Density in the Distal Airway of Normal Healthy Subjects
Non-T erm
inal
Term inal
0 2 4 6
NEB/mm
NEB in Non-Terminal/Terminal (Normal)
✱✱
** = p ≤0.01
Column graph comparing NEB density in normal subjects, organized by sub-classification of the distal airway. There is a significant difference between the two sub-classes (Welch’s t-test, p≤0.01).
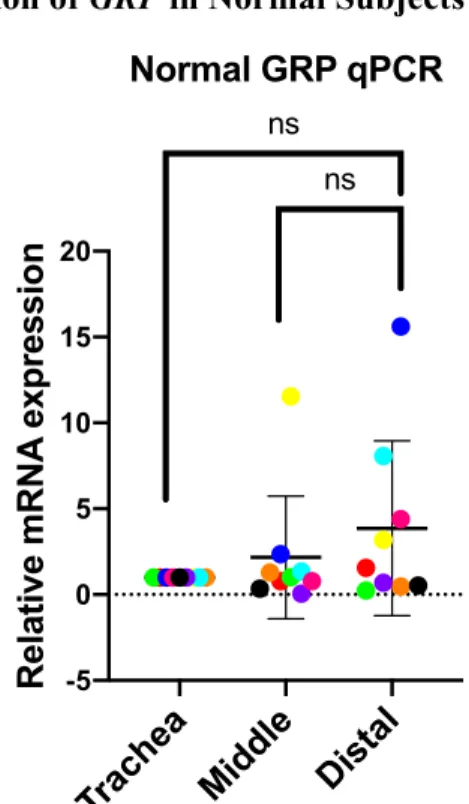
Figure 4: mRNA Expression of GRP in Normal Subjects
Trac hea
Midd le
Dista l -5
0 5 10 15 20
Normal GRP qPCR
Relative mRNA
expression
ns ns
Column graph demonstrating relative amounts of GRP mRNA expression from 9 normal subjects, organized by lung section. There are no significant findings in regards to trachea/middle airways versus distal (Welch’s t-test, p=0.1306).
4.2.
Asthmatic Adult Subjects
To expand the scope of our study, we conducted IHC on tissue samples from 6 asthmatic
Figure 5: Density and Distribution of PNECs and NEBs in the Lungs of Asthmatic Subjects.
Column graph depicting densities of PNECs and NEBs in asthmatic lung tissue, organized by lung section. No significant difference in cell density was found between any of the sections (Welch’s t-test, p=0.0596 and p=0.1095).
As with the normal subjects, we did more specific IHC analysis of the NEB densities within distal airways. Separating the distal classification into non-terminal and terminal bronchioles allowed us to break down the distribution of NEBs further for comparison (Figure 6). There was a significant difference in distribution of NEBs between non-terminal and terminal bronchioles, with a noted increased in terminal bronchioles (Welch’s t-test, p≤0.01).
Figure 6: NEBs in the Distal Airway of Asthmatic Subjects
Non-T erm
inal Term
inal
0.0 0.5 1.0 1.5 2.0 2.5
NEB/mm
NEB in Non-Terminal/Terminal (Asthma)
✱✱
** = p ≤0.01
Column graph demonstrating the respective densities of NEBs in asthmatic lung samples, organized by sub-class of the distal airway. There is a significant increase in NEB density as airways move from non-terminal to terminal (Welch’s t-test, p≤0.01).
Figure 7: Density of NEBs in Terminal Bronchioles Normal and Asthmatic Subjects.
Normal Asth ma 0
2 4 6
NEB
/mm
NEB in Terminal (Normal vs Asthma) ✱
* = p ≤ 0.05
Column graph showing the densities of NEBs in terminal bronchioles, organized by subject demographic (Normal versus Asthmatic). The average decrease in NEB density in asthmatic subjects in comparison to normal
physiology is statistically significant (Welch’s t-test, p≤0.05).
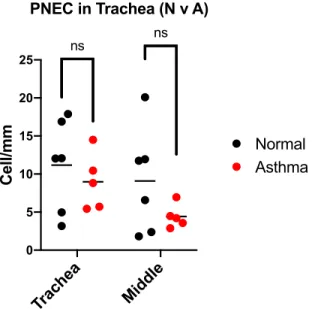
Figure 8: Density of PNECs in Trachea and Middle Airway Sections in Normal and Asthmatic Subjects
Trac hea
Midd le 0
5 10 15 20 25
Cell/mm
PNEC in Trachea (N v A)
Normal Asthma
ns ns
5.
DISCUSSION AND CONCLUSIONS
Throughout the course of this project, we were able to discern a few key details regarding the organization and distribution of the cells within the pulmonary neuroendocrine system that have yet to be stated in existing literature. The first of these was that in tissue samples from normal subjects, the density of PNECs in proximal airways is greater than in more distal airways. The trend is reversed for NEBs in normal subjects, with their highest densities in distal airways, especially terminal bronchioles. For asthmatic subjects, the findings are similar, but less
convincing given the weaker statistics. Potentially the most interesting finding is the significant decrease in the density of NEBs found in terminal bronchioles in asthmatic subjects when compared to healthy subjects. Taking all of these findings together, there are some apparent differences in distribution depending on cell structure and on subject pathology.
The opposing distribution pattern of PNECs and NEBs suggests distinct roles for the two cell forms. The regions in which these two cell forms are primarily located are distinct and have different roles in the respiratory system. While PNECs are located in the largest conducting airway of the respiratory system, NEBs are located most heavily in the smallest airways that are more involved with chemo-sensing and detoxification5. Terminal bronchioles represent the junction of the conduction zone and respiration zone of the lung, and there may be a correlation between this unique location and the nuanced roll of NEBs. Previous research has provided much evidence to support the claim that NEBs are key players in chemo-sensing and oxygen-sensing in the lungs, and the findings from our project coincide with the previous literature regarding this topic8.
are corroborated by the decrease in PNEC density in asthmatic subjects in both the trachea and the middle airways. Although the findings were not statistically significant, the data shows an overall decrease in neuroendocrine cells (of any form) in subjects with asthma. The presence of a difference between normal and asthmatic pathology yields many possibilities for exploration in regards to disease prevention, treatment, and therapy.
Given the nature of the study, which utilized human lung samples, there was little room for standardization beyond assessing smoking history and general lung health. The tissue samples used in the study were taken from lungs rejected for transplant due to having been on the ventilator for an extended period of time. Human subjects leave room for a vast quantity of confounding factors and inconsistencies in data, which cell culture can mostly eliminate. There is some chance that variability among the subjects yielded unexpected and unknown data
6.
ACKNOWLEDGEMENTS
7.
REFERENCES
1. Linnoila RI., et al. 1995. Pulmonary Endocrine Cells In Vivo and In Vitro. Neuropeptides in Respiratory Medicine [accessed 2018 Mar 20];
https://www.taylorfrancis.com/books/e/9781351428873
2. Van Lommel A., et al. 1999. The pulmonary neuroendocrine system: the past decade. J-Stage Archive of Histology and Cytology [accessed 2018 Mar 20]; 62.
https://www.jstage.jst.go.jp/article/aohc/62/1/62_1_1/_pdf/-char/en
3. Linnoila R. 2006. Functional facets of the pulmonary neuroendocrine system. Nature [accessed 2018 Mar 20]; https://www.nature.com/articles/3700412
4. Sui, P., et al. 2018. Pulmonary neuroendocrine cells amplify allergic asthma responses. Science [accessed 2019 Jan 24]; http://science.sciencemag.org/content/360/6393/eaan8546 5. Song H., et al. 2012. Functional characterization of pulmonary neuroendocrine cells in lung development, injury, and tumorigenesis. Proceedings of the National Academy of Sciences [accessed 2018 Apr 4]; https://www.ncbi.nlm.nih.gov/pmc/articles/PMC3491514/
6. Scanlon, S., et al. 2018. Finding a role for PNECs in asthma. Science [accessed 2019 Jan 24]; http://science.sciencemag.org/content/360/6393/1082.10
7. Okuda, K., et al. 2018. Localization of Secretory Mucins MUC5AC and MUC5B in
Normal/Healthy Human Airways. American Journal of Respiratory and Critical Care Medicine [accessed 2019 Feb 27]; https://www.ncbi.nlm.nih.gov/pubmed/30352166
8. Branchfield, K., et al. 2016. Pulmonary neuroendocrine cells function as airway sensors to control lung immune response. Science [accessed 2019 7 March];
https://www.ncbi.nlm.nih.gov/pmc/articles/PMC4860346/