Identifying Malnutrition in Older People
Living in the Community,
Buckinghamshire, UK
(Amersham, United Kingdom)
by
Lesley A. Rollins, CHES
A paper submitted to the faculty of the University of North Carolina at Chapel Hill in partial fulfillment of the requirements for the degree of Master
of Public Health in the Department of Nutrition
Chapel Hill, NC
December 5, 2014
Approved by:
2
Table of Contents
Background ... 3
Methods ... 10
Results ... 14
Discussion ... 27
Conclusion ... 40
References ... 42
Appendix A ... 45
Appendix B ... 46
Appendix C ... 47
Appendix D ... 48
Appendix E ... 49
Appendix F ... 50
3
Background
Older adults are a population at high risk of malnutrition and are the fastest growing
population throughout the United Kingdom (UK) and the world (Figure 1). The 2011
census data revealed the local Buckinghamshire, UK populations of people 60 years of age
and over and 80 years of age and over have increased by 23.8% and 27.7% since 2001
respectively. This is higher than the 16% national increase in people 60 years of age and
over in England and higher than the increase in people aged 70-89 years of age in the South
East region of England where Buckinghamshire county is located (Figure 2)
(Buckinghamshire County Council, 2012). With an aging population comes the potential for
an increase in the prevalence of malnutrition, as the risk of malnutrition increases as
people age. According to the series of annual Nutrition Screening Week surveys conducted
between 2007-2011 by the British Association of Parenteral and Enteral Nutrition
(BAPEN), 1.3 million of the 3 million (43.3%) people in the UK with malnutrition
(undernutrition) are over the age of 65 and 93% of those malnourished in the UK live in the
4
Figure 1. Bar graph showing a future projection of the percentage change in the world’s
population by age. From “Global Health and Aging,” by the World Health Organization, 2011, p. 8
Figure 2. Bar graph showing recent percentage change in the county of Buckinghamshire &
5
Malnutrition is costly to the individual as well as to the public healthcare system. It
puts a person at increased risk of falls, infection and pressure ulcers, hospital admissions,
fatigue, confusion, increased length of stay in hospital, decreased ability to fight infection
and heal wounds, and loss of mobility, muscle strength, independence, and quality of life. It
was calculated in 2007 by BAPEN that the UK national economic effects of malnutrition
summed £13.6 billion and 80% of it was acquired in England (BAPEN, 2009). Patients
suffering from malnutrition are often prescribed oral nutrition supplements (ONS), enteral
or parenteral nutrition formulas, which contributes to the costs associated with
malnutrition.
The National Health Service England’s (NHS England) expenditure of all nutrition
supplements increased by almost £10 million in one year between 2010 and 2011 (NPC,
2012). However, this increase may not have been due to an improvement in treating
malnourished patients. An audit of Buckinghamshire General Practitioner (GP) practice
ONS prescription practices performed by the Prescribing Support Dietitian at the Chiltern
Clinical Commissioning Group (CCG) and Aylesbury Vale CCG was conducted in 2013 and
revealed that only 24% of patients prescribed ONS were clearly at high risk of malnutrition
at the start of the prescription and only 2% prescribed ONS had a documented treatment
goal set in the GP notes (Smith, 2014b). Findings from this audit provide examples of how
the current cost of ONS prescriptions are not fully aimed at the intended population. This
overprescription of ONS contributes to NHS England’s expenditure on nutritional
supplements and could be reduced if ONS were prescribed with more precision and
accuracy. The National Prescribing Center (NPC) reports that the National Institute for
6
be saved through improved systematic screening, assessment, and treatment of
malnourished patients (NPC, 2012).
Currently in the United Kingdom (UK), there are national guidelines established by
the National Institute for Health and Care Excellence (NICE) including the National
Prescribing Centre (NPC) guiding principles for the identification and treatment of
malnutrition in hospital and the community in relation to nutrition support (NPC, 2012 &
NICE, 2012). NICE guidance on nutrition support for adults indicates presence of
malnutrition must be established prior to commencing prescription and prescription can
be considered if risk of malnutrition is established (NICE, 2006).
To establish the risk of malnutrition it must first be defined with supporting
indicators for identification. There is no universal definition of malnutrition, however it can
be defined as a deficiency or excess of nutrients necessary for proper body function. The
NICE guidelines and standards are concentrated on nutrient deficit or undernutrition
rather than nutrient excess or overnutrition. According to NICE, indicators of malnutrition
(undernutrition) include a BMI less than 18.5 kg/m2, unintentional weight loss greater than
10% within the last 3-6 months, or a BMI less than 20 kg/m2 and unintentional weight loss
greater than 5% within the last 3-6 months. Furthermore, risk of malnutrition can be
indicated if a person has “eaten little or nothing for more than 5 days and/or are likely to
eat little or nothing for the next 5 days or longer” or a person has “a poor absorptive
capacity, and/or have high nutrient losses and/or have increased nutritional needs from
causes such as catabolism” (BAPEN, 2011).
It is recommended by the Department of Health and National Patient Safety Agency
7
indicators of malnutrition. However, hospitals, care homes and primary care settings are
failing to screen patients for malnutrition (BAPEN, 2009). Some Clinical Commissioning
Groups (CCGs) in parts of England, including Buckinghamshire, have responded to this by
offering support and strongly recommending healthcare settings use the Malnutrition
Universal Screening Tool (MUST) developed by the Malnutrition Advisory Group (MAG) of
BAPEN to identify risk of malnutrition (see Appendix A for the ‘Malnutrition Universal
Screening Tool’ document). The tool scores an individual’s risk of malnutrition using BMI,
percent weight loss in the last six months, and an acute disease score which is added when
implemented in the hospital setting. Each indicator receives a score of zero, one, or two and
then the sum of these scores provides an overall risk score. A score of zero is low risk, one
is medium risk, and two or higher is high risk. A toolkit for MUST implementation can be
found on the BAPEN website
http://www.bapen.org.uk/screening-for-malnutrition/must/must-toolkit/the-must-itself.
The MUST is the screening tool most commonly used in the UK for identification of
malnutrition, as it is considered the best currently available validated tool for the adult
population by many public and private organizations, including the British Dietetic
Association (BDA), the Royal College of Nursing (RCN), the Royal College of Physicians
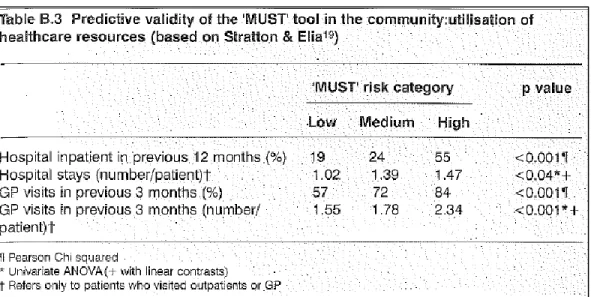
(RCP), and the Registered Nursing Home Association (RNHA) (BAPEN 2011). The ‘MUST’
Report (BAPEN, 2012b) substantiates the following validation types: content, face, internal,
correlation, and predictive validity – predicting rates of hospital admissions and GP visits of
the free-living population in the community and it indicates improvement in health
8
Figure 3. The ‘MUST’ predictive validity in the community setting. From “The ‘MUST’
Report,” by MAG subgroup of BAPEN, 2012, p.61.
The CCGs in Buckinghamshire also have strong recommendations for the treatment
of malnutrition, which includes the Food First approach. For those at medium risk of
malnutrition, this starts with adding an additional 500 calories per day using familiar
high-calorie, high-protein food items (e.g., cream, butter, peanut butter, yogurt, skimmed milk
powder, etc.). If an individual is at high risk of malnutrition an additional homemade
fortified drink such as a homemade fortified milkshake (i.e., whole milk, skimmed milk
powder, and vitamin fortified milkshake powder e.g., Nesquik or Tesco Milkshake Mix) is
added to provide a total of 1000 extra calories per day. The fortified milkshakes have an
equivalent nutrient analysis to EnsurePlus nutritional supplement, providing 300 calories,
17 grams (g) protein, 44g carbohydrate, and 7.5g fat in 220 milliliters (mL). This
recommendation is followed for one month before considering NHS prescription of ONS or
dietetic referral (see Appendix B for the ‘MUST Management Guidelines’ document).
Additional, supporting documents can be found on the Buckinghamshire Formulary
9
currently being trialed by South Essex Partnership University NHS Foundation Trust in
East England care homes to verify its effectiveness in this community setting. If proven
successful, there is potential that the NHS will consider using it to inform guidance for the
treatment of malnutrition across other regions of England. Resources from this project can
be found on the BAPEN website
http://www.bapen.org.uk/tackling-malnutrition/nutritional-advice-and-information/treating-malnutrition/food-first-project. To support current guidance and inform future guidance of malnutrition screening
recommendations from the Chiltern CCG and Aylesbury Vale CCG in Buckinghamshire, “The
MUST Screening Project” was implemented by the CCG’s Medicines Management team in
General Practitioner (GP) practices within Buckinghamshire county. To help ensure the
target population of patients was reached for this project, GP practice flu vaccination clinics
were used to implement the project, as greater than 70% of patients 65 years of age and
over were vaccinated during the 2013-2014 and 2012-2013 administration of the influenza
vaccine in England (Public Health England, 2014). This vaccine is provided in the UK by the
NHS to people 65 years of age and over, due to the age-specific risk for infection. Since
there is a high rate of attendance among this age group and there was limited staff to
implement “The MUST Screening Project,” the target population for this project was limited
to patients 80 years of age and over.
The project supports the NICE clinical guidance specifically for the Primary Care
setting, which states patients should be screened for malnutrition (undernutrition) if over
the age of 75 and during “other opportunities e.g. vaccinations” (NPC, 2012). Furthermore,
10
weight at each GP visit, which can be achieved in a short amount of time before the patient
is seen by the GP.
Methods
Three General Practitioner (GP) practices located in Aylesbury Vale and Chiltern
localities were recruited via e-mail and in-person conversations, and participated in “The
MUST Screening Project.” The recruitment of these practices were informed by practice
staffs’ stated interest and the practices’ history of implementing similar screenings during
past flu clinics. During the implementation of this project at flu vaccination clinics, nurses,
front desk staff, and project staff identified patients who were 80 years of age or over and
invited them to participate in the MUST screening after receiving their flu jab (i.e. flu shot).
Additionally, a poster was created after the first screening day to direct potential
participants in the direction of “The MUST Screening Project” location. This was to help
capture anyone who may have forgotten they were advised to come in or whom staff may
have missed recruiting. A project “Handout” was then offered to each identified patient,
which described the purpose of the screening and what was involved if they chose to
participate, and provided a list of Internet resources for further nutrition information (see
Appendix C for example of “Handout”). The Chiltern CCG & Aylesbury Vale CCG Medicines
Management Prescribing Support Dietitian and Interface Pharmacist approved the project
“Handout.”
GP practices were requested to initially provide a space for the implementation of
the MUST screening (interview room or reserved section of the waiting room), access to
11
Department of Health. After the first flu vaccination clinic, it was requested that GP
practices provide one stadiometer if possible. Project staff provided measuring tapes to
measure ulna length and mid-upper arm circumference (MUAC), an alternative measure
used to estimate height and weight, in the event that an alternative height and weight
measurement was indicated and to measure ulna length in a subsample of participants at
the last flu vaccination clinic where the project was implemented. Also, staff developed a
“Recording Chart” that was revised throughout the course of the project to better assist in
the quick collection of patient measurements during the screening process, and an
“Interview Script” to help assess weight loss (see Appendix D for a copy of the “Recording
Chart” and Appendix E for a copy of the “Interview Script”). Additionally, a follow up packet
for dissemination to patients identified at medium or high risk of malnutrition during this
project was approved by the Chiltern CCG & Aylesbury Vale CCG Medicines Management
Prescribing Support Dietitian, Interface Pharmacist and each GP practice project lead. It
included a “Follow up patient letter” and the Chiltern CCG & Aylesbury Vale CCG Medicines
Management Joint Executive Team (MM JET) approved “Food First Eating Well for Small
Appetites” patient education resource (see Appendix F for a copy of the “Follow-up Patient
Letter” and Appendix G for a copy of the “Food First Eating Well for Small Appetites”).
Patients who agreed to participate in “The MUST Screening Project” had their
weight measured using GP practice provided weight scales. They were asked to keep their
shoes on, but remove outerwear (e.g., jacket, coat, heavy sweater, jumper). Each participant
was asked to self-report their height, and at two GP practices patients were also asked to
remove their shoes if able, and heights were measured using a stadiometer. One practice
12
stadiometer. At one clinic a subsample of participating patients were measured for ulna
length – an approved alternative measurement to be used with MUST if self-reported or
recently documented height is not available – to investigate it’s accuracy in the population
of those 80 years of age and over (BAPEN, 2011).
Following this, patients were asked, “Have you lost any weight in the last 6 months
without trying to?” If patients answered yes, they were asked, “How much weight do you
think you have lost?” If the amount was unknown, a supplementary question included,
“Have you noticed whether your clothing has been fitting looser in the last six months?” All
project participants then stated their full name and date of birth (DOB), which project staff
used to record each patient’s medical record number on the project “Recording Chart.” The
medical record numbers were found using the Egton Medical Information Systems (EMIS)
since all participating GP practices use this system for electronic patient medical records.
Additionally, the most recent height and two most recent weights in each participant’s
medical record were recorded on the same chart.
After the screening, BMI and percentage weight loss were calculated by project staff.
BMI was calculated using the height and weight measurements that were measured during
the screening. If height was not measured during the screening, then the most recent height
from the medical record was used. If both forms of measurement records were not
available then self-reported height was used in calculations. Percentage weight loss was
calculated using the weight measured at the screening compared to the highest weight
recorded in the patient’s medical record in the last six months. If there was not a record of
weight in the last six months, weight recorded from one year ago was used and the
13
When no weight record was available in the last year, patient self-reported quantity of
weight loss was used to calculate percentage weight loss in the last six months.
All data collected and calculated was inputted at the CCG on “The MUST Screening
Project” excel spreadsheet with the exception of the participants’ full name and DOB. Data
on the spreadsheet included participating patients’ age, gender, self-reported or medical
record identified unintentional weight loss in the last six months, MUST weight loss score,
MUST BMI score, MUST overall score, risk of malnutrition, recommendation for follow up
with GP due to MUST overall score or clinical observation, and which participants were
sent the follow up packets.
After data was recorded in the project excel spreadsheet, project staff inputted
weight and MUST data into patient medical records at two GP practices, flagging “abnormal
value” for applicable MUST scores (medium, high risk scores), and added O/E General
Observation and a warning message with triggers of “load medical record” and “arrive
patient.” Heights measured at the screening were not recorded in medical records by
project staff. GP practice staff were requested to input these.
At the two GP practices where project staff inputted data in medical records, project
staff accessed the postal address in the patient’s medical record to address and post
follow-up packets to those identified at risk of malnutrition. Project staff personalized the
included “Follow-up Patient Letter” with the patient’s current weight and amount of weight
loss in the last six months. At the request of the third GP practice, project staff provided the
follow up packet materials to be used by the practice. Following this, project staff contacted
GP practices by e-mail to provide practice specific status of data entry and plans for future
14
At the end of the project, each GP practice was given their practice specific report.
This included a list of patients who participated, the percentage of participating patients
who were identified at risk of malnutrition, a list of patients recommended for follow-up, a
list of patients who have out-dated height and weight records, benefits of identification and
treatment of malnutrition, and location of CCG approved patient education resources and
GP nutrition support referral criteria for Dietetics. Additionally, there is a plan to provide
an executive summary of this project report to all GP practices in Buckinghamshire.
Results
The project was implemented at three GP practices in the county of
Buckinghamshire, UK at a total of five out of the eight scheduled flu vaccination clinics
(Table 1). Within each GP practice there is roughly an equal patient ratio of males to
females and the vast majority, greater than 97%, of patients 80 years of age and older are
not living in a nursing home. Additionally, “GP Practice 2” represents a population with a
deprivation prevalence of 22%, which is higher than England’s average level of 18.1%. Both
“GP Practice 1” and “GP Practice 2” in the Chiltern CCG locality had higher deprivation
(13% and 22%, respectively) than the locality’s average prevalence (11.3%). In the
Aylesbury Vale CCG locality, “GP Practice 3” had a prevalence of 10%, which is less than the
15 Table 1
Number (No.) of general practitioner (GP) flu vaccination clinics to implement “The MUST Screening Project”
GP Practice 1
No. (%) GP Practice 2 No. (%) GP Practice 3 No. (%) No. (%) Total
Total No. clinics 4 2 2 8
No. clinics used for project
implementation 2 (50) 1 (50) 2 (100) 5 (62.5)
Table 2
Patient demographics of participating general practitioner (GP) practices a
GP Practice 1
No. (%) GP Practice 2 No. (%) GP Practice 3 No. (%) No. (%) Total Total No. GP
registered patients 9954 9886 8620 28,460
No. GP registered patients in nursing
home 0 15 14 29
No. GP registered patients 80 years of
age and over 405 (4.1) 435 (4.4) 435 (5.0) 1275 (4.5)
Gender of GP
registered patients b n/a n/a n/a n/a
Income Deprivation Affecting Older People (IDAOP)
13%
(3rd less deprived decile, 8)
22%
(4th less deprived decile, 7) 10% (least deprived decile, 10) NHS England 18.1% Chiltern CCG 11.3% Aylesbury Vale CCG 10.5%
a GP Practice 1 & 3 data from practice staff’s audit on EMIS patient medical records; GP Practice 2 data derived from Public Health England, National General Practice Profiles, http://fingertips.phe.org.uk/profile/general-practice/data b Count not provided, but 2013 percent population by age and gender histograms indicated roughly a 1:1 ratio of males to females in each practice
“The MUST Screening Project” goal of screening 100 patients, 80 years of age and
16
The amount of participating patients in the target population equaled 149. Project staff
documented that there were 24 individuals in the target population who refused to
participate in the project, providing at least 173 eligible participants who attended the flu
vaccination clinic. The majority of project participants were 80-84 years of age (54.4%)
and 31.5% were 85-90 years of age with a higher prevalence of females (60.4%)
represented than males (39.6%) (Table 3).
Table 3
Demographics of participating patients within the target population of “The MUST Screening Project,” General Practitioner (GP) practice specific
Target Population
(80+ years of age) GP Practice 1 No. (%) GP Practice 2 No. (%) GP Practice 3 No. (%) No. (%) Total
80-84 yoa 38 (53.5) 15 (50) 28 (58.3) 81 (54.4)
85-89 yoa 22 (31.0) 10 (33.3) 15 (31.3) 47 (31.5)
90-94 yoa 10 (14.1) 5 (16.7) 4 (8.3) 19 (12.8)
95+ yoa 1 (1.4) 0 (0) 1 (2.1) 2 (1.3)
Total a
71/405 (17.5) 30/435 (6.9) 48/435 (11.0) 149/1275 (11.7)
No. female
patients 43 18 29 90 (60.4)
No. male patients 28 12 19 59 (39.6)
a Percent equals number of target population in “The MUST Screening Project” divided by total number of target population within each GP practice
It was anticipated by project staff that 10% of 100 screened participants in the
target population would be at medium or high risk of malnutrition. Actual results revealed
a higher prevalence with 20.3% of patients 80 years of age and over at medium risk
(14.7%) or high risk (5.6%) of malnutrition as indicated by their “Total MUST Score”. At
one practice the prevalence was even higher at 30.3% of participants in the target
population with a calculated “Total MUST Score” at medium or high risk of malnutrition
17
at medium or high risk of malnutrition (29 participants) had “BMI MUST Score” greater
than zero (41.4%) or “Weight Loss MUST Score” greater than zero (58.6%) (Table 5 &
Table 6). No one identified had both a “BMI MUST Score” greater than zero and a “Weight
Loss MUST Score” greater than zero. Of the 149 patients that participated, there were six
individuals who MUST scores were unable to be calculated. This was due to the lack of a
weight history in the patient medical record and patients self-reporting an unknown
previous weight and/or weight loss. These six participants were excluded from the
calculations that determined the prevalence of malnutrition risk, leaving a total of 143
participants with calculated MUST scores.
Table 4
Prevalence of “Total MUST Score” and risk of malnutrition for participating patients within the target population, GP practice specific a
Total MUST
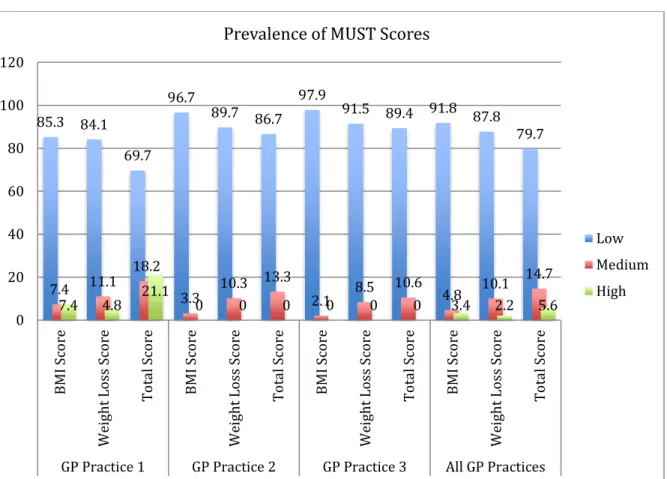
Score GP Practice 1 No. (%) GP Practice 2 No. (%) GP Practice 3 No. (%) No. (%) Total 0
(Low Risk) 46 (69.7) 26 (86.7) 42 (89.4) 114 (79.7)
1
(Medium Risk) 12 (18.2) 4 (13.3) 5 (10.6) 21 (14.7)
2+
(High Risk) 8 (12.1) 0 (0) 0 (0) 8 (5.6)
Total 66 (93.0) 30 (100) 47 (97.9) 143 (96.0)
18
Figure 4. Prevalence of MUST scores for participating patients within the target population,
GP practice specific
85.3 84.1
69.7 96.7
89.7 86.7 97.9 91.5 89.4 91.8 87.8 79.7
7.4 11.1 18.2
3.3 10.3 13.3 2.1 8.5 10.6 4.8 10.1
14.7
7.4 4.8 21.1 0 0 0 0 0 0 3.4 2.2 5.6
0 20 40 60 80 100 120 B M I S co re W ei ght L oss S co re To ta l Score B M I S co re W ei ght L oss S co re To ta l Score B M I S co re W ei ght L oss S co re To ta l Score B M I S co re W ei ght L oss S co re To ta l Score
GP Practice 1 GP Practice 2 GP Practice 3 All GP Practices
Prevalence of MUST Scores
19 Table 5
Prevalence of “BMI MUST Score” for participating patients within the target population, GP practice specific a
GP Practice 1 (n=71) No. (%)
GP Practice 2 (n=30) No. (%)
GP Practice 3 (n=48) No. (%)
Total (n=149)
No. (%) No. patients with
calculated score 68 (95.8) 30 (100) 48 (100) 146 (98.0)
No. patient unable to calculate score b
3 (4.2) 0 (0) 0 (0) 3 (2.0)
Score = 0
(≥ 20 kg/m2) 58 (85.3) 29 (96.7) 47 (97.9) 134 (91.8)
Score = 1
(< 20 kg/m2) 5 (7.4) 1 (3.3) 1 (2.1) 7 (4.8)
Score = 2
(< 18.5 kg/m2) 5 (7.4) 0 (0) 0 (0) 5 (3.4)
No. patients BMI
MUST score > 0 10 (14.7) 1 (3.3) 1 (2.1) 12 (8.2)
a Percentages calculated using “number of patients with a calculated score” as the denominator
20 Table 6
Prevalence of “Weight Loss MUST Score” for participating patients within the target population, GP practice specific a
GP Practice 1 (n=71) No. (%)
GP Practice 2 (n=30) No. (%)
GP Practice 3 (n=48) No. (%)
Total (n=149)
No. (%) No. patients with
calculated score 63 (88.7) 29 (96.7) 47 (97.9) 139 (93.3)
No. patient unable to calculate score b
8 (11.3) 1 (3.3) 1 (2.1) 10 (6.7)
Score = 0 (< 5% in last 6
months) 53 (84.1) 26 (89.7) 43 (91.5) 122 (87.8)
Score = 1
(5-10% in last 6
months) 7 (11.1) 3 (10.3) 4 (8.5) 14 (10.1)
Score = 2 (> 10% in last 6
months) 3 (4.8) 0 (0) 0 (0) 3 (2.2)
No. patients with weight loss MUST score > 0
10 (15.9) 3 (10.3) 4 (8.5) 17 (12.2)
a Percentages calculated using “number of patients with a calculated score” as the denominator
b Unable to calculate MUST score due to the lack of a weight history in patient medical record and patient self-reports an unknown previous weight and/or weight loss
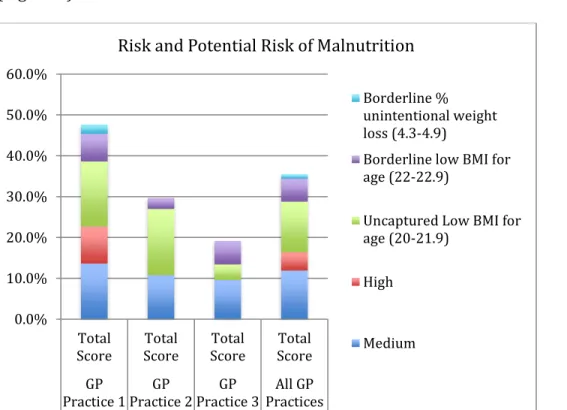
Moreover, 30.2% (45 participants) were identified with unintentional weight loss in
the past six months including patients in one clinic, which had a prevalence of 40 percent.
Of the 45 participants, two self-reported no unintentional weight loss even though weight
loss was indicated using the EMIS patient medical weight record, and 17 received a “Weight
Loss MUST Score” greater than zero. Furthermore, 42.3% of participants in the target
population at one clinic compared to 32.2% of all those 80 years of age and over in this
project were recommended for follow up due to their risk of malnutrition (medium or high
21
poor or decreasing appetite, borderline “Weight Loss MUST Score” or “BMI MUST Score”)
(Figure 5).
Figure 5. Prevalence of risk and potential risk of malnutrition for participants within the
target population with consideration of borderline indicators, GP practice specific
Among the participants in the target population, about the same prevalence of
malnutrition risk was seen in males compared to females (Table 7). Comparisons between
GP practices to correlate age to risk of malnutrition were not calculated, as the
participating sample was not large enough to represent each age band sufficiently for a
meaningful comparison. However, seven of the 29 participants at risk of malnutrition were
90 years of age and over, and two of the seven patients were between the ages of 94 and
100, comprising the oldest patients in this project. Both of these patients (100%) were at
risk of malnutrition, whereas only 28.6% of participants over the age of 90 were at risk of
malnutrition (Table 8). This is a higher percentage than the overall risk of malnutrition in
this project group, which is 20.3 percent.
0.0% 10.0% 20.0% 30.0% 40.0% 50.0% 60.0%
Total
Score ScoreTotal ScoreTotal ScoreTotal GP
Practice 1Practice 2GP Practice 3GP PracticesAll GP
Risk and Potential Risk of Malnutrition
Borderline % unintentional weight loss (4.3-4.9)
Borderline low BMI for age (22-22.9)
Uncaptured Low BMI for age (20-21.9)
High
22 Table 7
Prevalence of malnutrition risk by gender among participating patients within the target population, GP specific
GP Practice 1
No. GP Practice 2 No. GP Practice 3 No. No. (%) Total Low Risk
Male 18 11 16 45 (78.9)
Female 28 15 26 69 (80.2)
Medium Risk
Male 5 1 3 9 (15.8)
Female 7 3 2 12 (14)
High Risk
Male 3 0 0 3 (5.3)
Female 5 0 0 5 (5.8)
Table 8
Number at risk of malnutrition risk by age among participating patients within the target population
Total at Risk of Malnutrition
No. 29
80-89 yoa 22
90-94 yoa 5
94-100 yoa 2
100+ yoa 0
During the project, additional data was collected on the frequency of weight and
height records in the patient medical records and accuracy of patient reported height and
ulna length measurements in the population included in the project. Review of patient
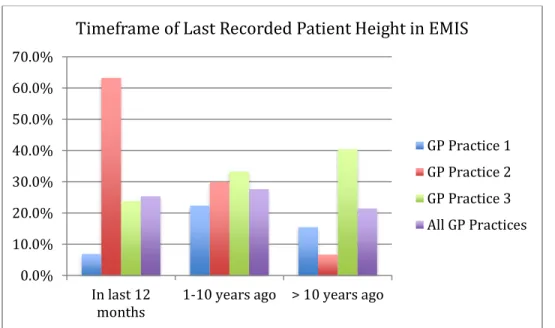
medical records across each GP practice revealed only 34% had height recorded within the
last 12 months and only 20.1% had weight recorded in last 6 months (36.0% in last 12
months). Frequent lack of height and weight measurements in the patient medical records
and a greater occurrence of outdated records (>1 year ago) were noted for the GP practice
23 Table 9
EMIS height record for participating patients within the target population, GP practice specific
GP Practice 1
No. (%) GP Practice 2 No. (%) GP Practice 3 No. (%) No. (%) Total Height record in EMIS
Yes, known timeframe 26 (36.6) 30 (100) 41 (85.4) 97 (65.1)
Yes, unknown timeframe 32 (45.1) 0 (0) 1 (2.1) 33 (22.1)
No 13 (18.3) 0 (0) 6 (12.5) 19 (12.8)
Total 71 30 48 149
Timeframe of height record in EMIS a
In the last 12 months 4 (15.4) 19 (63.3) 10 (24.4) 33 (34.0)
1-10 years ago 13 (50) 9 (30) 14 (34.1) 36 (37.1)
> 10 years ago 9 (34.6) 2b (6.7) 17c (41.5) 28 (28.9)
a Percentages calculated using number of patients with a height record in EMIS as the denominator b Of the 2 measurements, 1 is > 20 years ago
c Of the 17 measurements, 6 are > 20 years ago
Figure 6. Timeframe of last recorded height in EMIS patient medical chart for participating
patients within the target population, comparison of GP practices
Table 10 0.0% 10.0% 20.0% 30.0% 40.0% 50.0% 60.0% 70.0%
In last 12
months 1-10 years ago > 10 years ago
Timeframe of Last Recorded Patient Height in EMIS
24
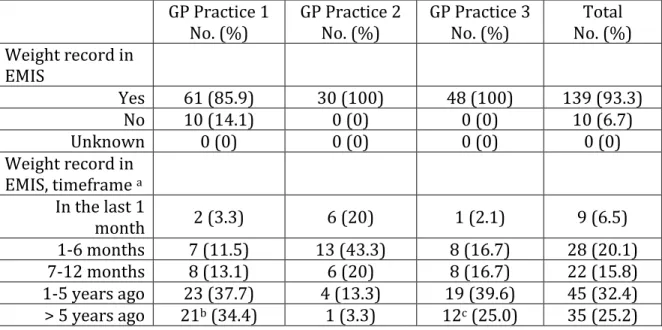
EMIS weight record for participating patients within the target population, GP practice specific
GP Practice 1
No. (%) GP Practice 2 No. (%) GP Practice 3 No. (%) No. (%) Total Weight record in
EMIS
Yes 61 (85.9) 30 (100) 48 (100) 139 (93.3)
No 10 (14.1) 0 (0) 0 (0) 10 (6.7)
Unknown 0 (0) 0 (0) 0 (0) 0 (0)
Weight record in EMIS, timeframe a
In the last 1
month 2 (3.3) 6 (20) 1 (2.1) 9 (6.5)
1-6 months 7 (11.5) 13 (43.3) 8 (16.7) 28 (20.1)
7-12 months 8 (13.1) 6 (20) 8 (16.7) 22 (15.8)
1-5 years ago 23 (37.7) 4 (13.3) 19 (39.6) 45 (32.4)
> 5 years ago 21b (34.4) 1 (3.3) 12c (25.0) 35 (25.2)
a Percentages calculated using number of patients with a height record in EMIS as the denominator b Of the 21 measurements, 11 are 10-20 years ago, and 2 are > 20 years ago
c Of the 12 measurements, 7 are 10-20 years ago, and 2 are > 20 years ago
Figure 7. Timeframe of last recorded weight in EMIS patient medical chart for participating
patients within the target population, comparison of GP practices (recalculate see above)
0.0% 5.0% 10.0% 15.0% 20.0% 25.0% 30.0% 35.0% 40.0% 45.0% 50.0%
In last 1
month 1-6 monthsago months ago7-12 1-5 yearsago > 5 yearsago
Timeframe of Last Recorded Patient Weight in EMIS
25
Moreover, 68 participants self-reported their height and had a height measurement
measured using a stadiometer during “The MUST Screening Project.” Only one of these
participants correctly reported their height. Of the 95.6% who incorrectly reported their
height, 97% overestimated height (reported taller height) and 3% underestimated height
(Table 11 & Figure 8). Some reported heights were as much as 4.75 inches taller than
measured height (Figure 9). Additionally, for a subsample of 12 people, ulna length was
also measured. Only one estimate of height from ulna length was the same as height
measured with a stadiometer during the MUST screening project and eight ulna lengths
estimated greater than measured height (Table 12).
Table 11
Patient self-reported height compared to measured height during “The MUST Project Screening”
GP Practice 1a
No. (%) GP Practice 2
b
No. (%) GP Practice 3
c
No. (%) No. (%) Total Height unknown
by patient 10 (32.3) 5 (16.7) 5 (10.4) 20 (18.3)
Same height 3 (9.7) 0 (0) 1 (2.1) 4 (3.7)
Taller height difference in self-reported height (overestimation)
16 (51.6) 25 (83.3) 40 (83.3) 81 (74.3)
0” to 1” 8 (50) 3 (12) 3 (7.5) 14 (17.3)
1” to 2” 3 (18.8) 11 (44) 16 (40) 30 (37.0)
> 2” 5 (31.3) 11 (44) 21 (52.5) 37d (45.7)
Shorter height difference in self-reported height (underestimation)
2 (6.4) 0 (0) 2 (4.2) 4 (3.7)
0” to 1” 1 (50) 0 (0) 2 (100) 3 (75)
1” to 2” 1 (50) 0 (0) 0 (0) 1 (25)
> 2” 0 (0) 0 (0) 0 (0) 0 (0)
a Self-reported height only collected at 1 of the 2 screenings, so only 31 patients are included. Also, self-report was compared to EMIS, as stadiometers were not available on day of screening.
b 5 reported shorter heights when compared to EMIS c 15 reported shorter heights when compared to EMIS
26
Figure 8. Difference in measured height versus patient self-reported height during “The
MUST Project Screening,” comparison of GP practices
Figure 9. Prevalence of patient self-reported height greater than 2 inches different from
clinical measurements of height during “The MUST Project Screening”
0% 10% 20% 30% 40% 50% 60% 70% 80% 90% 100% Ove re stim at ion Un de re st ima tion Ove re stim at ion Un de re st ima tion Ove re stim at ion Un de re st ima tion Ove re stim at ion Un de re st ima tion
GP Practice 1 GP Practice 2 GP Practice 3 All GP Practices
Difference Between Self-reported Height and Clinical Measurement of Height
>2" 1"-2" 0"-1" 16% 22% 38% 14% 5% 5%
Prevalence of Self-reported Heights Greater than 2" Different from Clincal Measurement of Height
27 Table 12
Patient ulna length estimates of height compared to measured height during “The MUST Project Screening”
n a =12
Same height 1 (8.3)
Taller height difference in ulna length
estimated height (overestimation) 8 (66.7)
0” to 1” 1 (12.5)
1” to 2” 2 (25)
> 2” 5 (62.5)
Shorter height difference in ulna length
estimated height (underestimation) 3 (25)
0” to 1” 1 (33.3)
1” to 2” 2 (66.7)
> 2” 0 (0)
a Sub sample measured during “GP Practice 3” second flu vaccination clinic
Discussion
The European Nutrition for Health Alliance’s (ENHA) policy report, Malnutrition
among Older People in the Community: Policy Recommendations for Change, states that
malnutrition affects more than 10% of people aged 65 or over living in the community. This
informed the project staff expectation that approximately 10% of project participants
would be at risk of malnutrition (ENHA, 2006). However, the prevalence of malnutrition in
older people living in the community is still not well documented, as another ENHA report
of a systematic review of research reports anywhere from 5.8% to 30% of older people
living in the community are at risk of malnutrition (ENHA, 2010). During this project, the
prevalence of malnutrition-risk identified exceeded the amount anticipated by program
staff. This suggests that a higher prevalence of unidentified malnutrition in people 80 years
of age and over may be occurring in the county of Buckinghamshire, UK than what is
28
care) is not implemented, malnutrition may go unrecognized and untreated for some time,
significantly affecting many older peoples health and quality of life.
Key indications of malnutrition such as low BMI and unintentional weight loss rely
on regular weight measurements and up-to-date weight records with preferably a
six-month weight history. By implementing the MUST screening at GP flu vaccination clinics,
this project was able to update weight records of all participants, of which only 26.6% had
weight recorded in the last six months and less than half had a weight recorded in the last
12 months. It is interesting to note that the practice with the least number of up-to-date
weight and height records was also the practice with the highest prevalence of patients at
risk of malnutrition, suggesting an association between maintaining current weight and
height records with patient care that may increase recognition and treatment of
malnutrition or reduce risk of developing it.
Additionally, the project aided the participating GP practices in beginning the
process of implementing screening for malnutrition using the MUST, so that the nutritional
status or risk of malnutrition of patients can be reviewed in the future. Prior to this project,
the participating GP practices did not have MUST scores calculated and recorded in patient
medical records, although NICE guidelines published in 2012 state that all people over the
age of 75 should receive regular screening for malnutrition in the primary care setting.
Unfortunately, this above evidence supports BAPEN’s statement that Primary Care is failing
to screen patients for malnutrition (NPC, 2012 & BAPEN, 2009).
The lack of screening could be due to several misconceptions. One assumption
expressed by some healthcare providers and patients during this project is that weight loss
29
a high BMI in older adults can disguise undernutrition and reduction in muscle mass, which
contributes to the emerging condition of ‘sarcopenic obesity’ in the aging population
(Thibault & Pichard, 2012). Sarcopenia has been suggested by some as the number one
reason for weight loss among older adults (Morley, 2007). This can be further disguised by
the misconception that the physical appearance of an older person will be thin. The
perception and expectation that an older person will have a lower body weight and appear
frail may influence a healthcare providers subjective observation of whether someone
should receive screening for malnutrition, as lower weight in the older person may be seen
as ‘normal’ when really it is not. Some studies have already suggested that healthcare
providers may not recognize risk factors of malnutrition sufficiently in the hospital setting
(Adams et al., 2008). This should also be considered and explored in the primary care
setting, as the majority of malnutrition is in the community (BAPEN, 2009).
Research on aging has identified reduction in muscle mass as one of the most
noticeable biological changes with increasing age (Kamel, 2003). However, it should not be
assumed that any weight loss, whether a reduction in muscle mass or otherwise, is an
inevitable part of ‘normal’ aging. Kamel’s paper explores links to physical condition as
people age and considers that these changes are not only genetics, but also to environment
and lifestyle choice, including the links between inadequate food intake, malnutrition,
sarcopenia and weight loss (Kamel, 2003). Furthermore, the assumption that weight loss is
always positive for overweight older people ignores the findings that it can be beneficial for
an older person to have an overweight BMI (> 25 kg/m2). The International Dietetics and
Nutrition Terminology Reference Manual defines underweight in persons 65 years of age
30
research suggests that mortality is increased in older people who have a BMI less than 22
kg/m2, there is no increase in mortality for older adults with a BMI greater than 30 kg/m2
and that a BMI between 25-29 kg/m2 is the healthiest range, depending on gender, for
people 70 years of age and older (Cook et al., 2005).
The findings of this project support this, as the majority of study participants
identified at risk of malnutrition did not have low BMI. A higher percentage of participants
were identified at risk for malnutrition due to unintentional weight loss in the last six
months (58.6%) rather than low BMI (41.4%), and of those with unintentional weight loss,
none had a low BMI according to the MUST. Maintaining a history of weight records and
reviewing these for unintentional change would benefit the majority of patients in this
project who did not have their weight reviewed until participating in “The MUST Screening
Project.” For two participants in this project, weight loss in the last 6 months went
unnoticed by the patient, but when compared to the weight measured at the screening the
weight record in the patient’s medical notes demonstrated a weight loss score greater than
zero. Another participant had lost four kilograms (over 7% weight loss) in less than four
months and was unaware that this had even occurred until she was weighed at this
screening. A third patient identified at the screening was noticed to be wearing trousers at
least three sizes too large for him (he used suspenders to hold his trousers up), had no
weight or height record in his medical chart and when he was asked about weight loss
stated he had not lost any weight. When he was then prompted about his loose fitting
trousers, he told project staff that his trousers have been getting looser and last fitted him
18 months ago. According to an article in the Canadian Medical Association Journal, this is
31
may not complain about losing weight or, less commonly, may mistakenly attribute weight
loss to successful diet or lifestyle modifications” (Alibhai et al., 2005). By regular weighing
and measuring height, together with a few quick questions about unintentional weight loss,
elderly people at risk of malnutrition can be better identified and treated for this condition.
It is not safe to assume one can gauge a person’s potential risk for malnutrition based on a
subjective observation alone since research shows high prevalence of malnutrition in the
aging population, particularly among those with a BMI of greater than 20 kg/m2. Guidance
is in place to screen older people for malnutrition for good reason.
When following guidance on screening for malnutrition, it is then important to
ensure the measurements taken are conducted accurately. Ideally a person’s weight should
be measured using the same scale each time, and the weight scale should meet the legal
requirement set by Schedule 3 of the Non-Automatic Weighing Instrument (NAWI)
Regulations 2000. This requirement states that scales should only display metric units and
scales that have dual readings should be replaced (Secretary of State, 2000). Two out of the
three practices participating in “The MUST Screening Project” provided appropriate scales.
The other practice provided a dual reading scale that measured and displayed both stones
(14 lbs.) and kilograms.
Alternative measures of weight used in this project included self-reported weight.
This project did not look at the accuracy of these alternative measurements in our
participant group, as all participants were able to stand on the weight scales and the
majority of participants (over 70%) did not have a recent medical weight record for project
staff to use in verification of these alternative measures. Self-reported weight loss versus
32
considering implementation of the MUST. This research could address the accuracy of
these methods for capturing weight loss, specifically fat free mass loss (muscle mass) in the
older adult population living in the community.
With regards to height measurements, it should be measured using a stadiometer
and with shoes removed (BAPEN, 2011). Alternative measures of height recommended by
BAPEN include self-report, ulna length, demispan, and knee height. This project measured
patient height during the screening and also recorded patient self-reported height and
most recent height recorded in their medical record. At one clinic a subsample of
participating patients also had ulna length measured to investigate it’s accuracy in the
population of those 80 years of age and over. Ulna length is an approved alternative
measurement to be used with MUST if self-reported or recently documented height is not
available (BAPEN, 2011). Data from this project suggests that most patients do
overestimate their current height and the majority of ulna length height measurements
also overestimate height when compared to stadiometer-measured heights on the day of
the screening. Most of the estimated or reported heights were taller than measured height,
encompassing differences as great as 4.75 inches (self-reported height) and 6.75 inches
(ulna length estimate). Many of the male project participants referred to their height when
in National Service, which was at least 60 years ago and a few even argued with project
staff that their current measured height was incorrect.
It should be noted that some of the overestimates of height recorded might be due
to a limitation of this project as project participants with curvature of the spine were still
measured using a stadiometer. Best practice would have been for patients identified with
33
alternative measurements have been shown to provide a more accurate height
measurement than with a stadiometer (Collins, 2000). However, this does not deny that
loss of height, (by as much as one to three inches), during the process of aging is well
documented and overwhelmingly supported by the amount of inaccurate self-reported
heights identified during this project (MedlinePlus, 2014).
Since height loss occurs as part of the aging process, it should be considered when
calculating BMI. By using alternative estimates of height the chance of overestimating low
BMI increases and more people may be falsely identified as at risk of malnutrition using the
MUST. However, the MUST scores low BMI using cut off points for the average adult (BMI <
20 kg/m2), which is lower than that recommended for older people (BMI < 22 kg/m2)
(Cook, et al., 2005). This could suggest that when using the MUST to capture risk of
malnutrition in older people, overestimating low BMI (BMI < 20 kg/m2) using taller
self-reported heights is beneficial since it would capture those who actually have a BMI of
greater than 20 kg/m2 but which is still considered low for age. However, this suggestion
should not replace the fact that maintaining and using accurate measurements are best
practices in accurately identifying risk of malnutrition.
Future research on use of the MUST in reporting accurate scores for people aged 80
years of age and over would be beneficial, as the original validation of MUST reports
several measures studied in hospital settings in those aged 60 years of age and over, but
neither this age group in the community nor those aged 80 years of age and over were
included (BAPEN, 2012b). Moreover, this project revealed that the participants at risk of
malnutrition would approximately increase from one-fifth to one-fourth of participants if
34
increased to over one-third of participants if all the uncaptured low BMI for age (BMI
20-22) were included (Figure 10). Future research to consider whether individuals with
borderline measurements in the old age population are at similar risk of developing
malnutrition to those with at risk scores could be beneficial. This is especially pertinent
since one main indicator, BMI, is reliant on height and weight measures and may not
sufficiently consider changes in body composition in the older adult population.
Figure 10. Prevalence of risk and potential risk of malnutrition for participating patients
within the target population with consideration of BMI for age and borderline indicators
In addition to using appropriate methods and equipment for collecting
measurements, identifying accurate risk of malnutrition includes ensuring that staff who
implement the MUST have received appropriate training. The MUST is considered a simple
tool, however it’s only simple when the person implementing it understands the tool and
how to use the relevant equipment. Some errors in the MUST implementation include
misunderstanding of percent weight loss calculation. An error that is frequently seen is
66% 12%
4% 12%
6%
Risk or Potential Risk of Malnutrition Considering BMI for Age
Low
Medium
High
Uncaptured Low BMI for age (20-21.9)
35
comparison of a person’s current weight to their weight only one month ago versus
comparing it to the highest weight recorded within the last six months. This leads to
underreporting of weight loss, and significant weight loss over a period of time may be
missed. It has been observed and reported in one article that even when MUST is
completed it is frequently inaccurate and ongoing training is necessary for improved
completion of this and any screening tool (Smith, 2014a).
Once the MUST is understood it can be quick to implement. During this project, it is
estimated that for each participant MUST screening took a maximum of 2-3 minutes. The
short amount of time it takes to implement this tool can nonetheless lead to significant
benefits in terms of prevention and treatment of malnutrition. Demonstrating this for GP
practices could lend support to the suggestion that recording height and weight should
form part of standard practices for older adults at all GP practices. The measurements do
not have to be undertaken by GPs and could be completed before patients meet with their
doctor by nursing staff, healthcare assistants, or other identified staff who are trained in
the use of relevant equipment and the MUST. To support the training needs for the MUST
and monitoring of MUST implementation within the community, additional staffing within
local commissioning groups would be beneficial.
Implications for the future include the need to strongly recommend and monitor GP
practices for appropriate implementation of the MUST specifically for those aged 75 years
of age and over, according to NICE guidelines so that height, weight and unintentional
weight loss are recorded at each GP appointment and any action required is taken.
Barriers to implementation of the MUST in primary care may include the perception
36
unrecognized and untreated in the community the long-term will be an increase in
frequency of GP visits and acute admissions to hospitals. This ultimately takes up more
healthcare time and resources and could be avoided by detection of malnutrition using the
MUST followed by appropriate treatment (BAPEN, 2011). Possibly, the MUST may gain
acceptance from GPs if it is utilized with a smaller group of patients at higher risk of
malnutrition. This allows staff more time to become comfortable with the tool. During “The
MUST Screening Project,” some participants, who reported unintentional weight loss when
asked, provided their explanation of why it may have occurred. Several reported recent
acute illness or time in hospital or weight loss as a result of being bereaved. Patients with
these situations may be members of the smaller group selected by GPs for administering
the MUST.
Additionally, all healthcare professionals at the GP practice need to be in support of
the screening or there is potential for patients to see the screening as unimportant. The
experience of this project indicated that the screening that had limited promotion from
healthcare professionals had a higher patient refusal rate. During the implementation of
this project, 24 patients in the target population were noted to refuse participation. After
the first screening it was realized that some healthcare providers were not promoting the
screening whereas others were advising their patients to come to the screening location. In
response to this, the project staff created a poster after the first screening day to direct
potential participants in the direction of “The MUST Screening Project” location and reduce
the number of potential participants missed by inadequate promotion of the screening by
healthcare professionals. Many patients commented on their age when they read the sign,
37
It was interesting to note the GP practice with the highest refusal rate (five at first
clinic and 12 at the second), “GP Practice 3,” also had the lowest prevalence of malnutrition
risk and represented the least deprived practice population in this project. The higher
refusal rate may have led to potentially at risk patients being missed. Furthermore, there
may have been a higher refusal rate because more patients reported their weight was being
tracked by the practice such as within diabetes clinics. This project was not able to check
the medical records of those that refused to be screened so their risk of malnutrition is
unknown. This would be a recommended area to explore with future research concerning
GP practices in Buckinghamshire.
Also, even with the use of a poster, the level of refusal at the second clinic at “GP
Practice 3” was more than double that of the first clinic there, which was not the case at “GP
Practice 1” where the project was also implemented at two flu vaccination clinics. At “GP
Practice 1” the number of refusals was about the same (three at first clinic and four at
second clinic). The main observed difference between the two screening days at “GP
Practice 3” was the level of promotion by healthcare professionals of “The MUST Screening
Project” on the day of the screening. This was noted by observing the limited use of project
handouts and conversation with patients by healthcare professionals to promote and direct
the appropriate age group to the screening location as patients were leaving after the flu
jab (i.e. flu shot). This may indicate the need to increase awareness among healthcare
professionals of the importance of the screening for patients. Some research suggests
patients who receive advice from physicians are more motivated to attempt lifestyle
behavior changes including dietary and physical activity habits (Thomas, et al., 2002 &
38
healthcare professionals, these patients may be more willing to take part in preventative
health screenings. By implementing malnutrition screening and promoting its importance
to patients, the prevalence of malnutrition and its detrimental effects on the individual and
the health economy can be reduced.
In addition to implementing malnutrition screening and promoting its importance
to patients, it is necessary to then take action in implementing a care plan to help reduce
the prevalence of malnutrition and detrimental effects it can have for the individual.
Additionally, there may be reduced impact on the economic state of the medical system.
This project did not explore the implementation of treatment once patients were identified
at risk of malnutrition. This would be a good area for future research, as the Food First
approach recommended by some of the Buckinghamshire CCGs requires physicians to
implement the intervention during a regular 10-minute appointment slot and then send
patients home to implement the changes for one month before being reevaluated. The
recommendation may work in a care home such as a nursing home setting, as there are
healthcare providers looking after residents and catering staff available to prepare and
offer meals during the one-month period. However, when translating this to the free-living
older person population in the community one month may be too long when it is possible
they are not successfully implementing changes and continuing to loose weight and
increase their risk for falls, infection, and possibly hospital admission.
While this approach does not provide patients direct contact with a dietitian who is
specially trained in individualized nutrition counseling and support, it does involve
dietitians in the development of guidelines given to GPs who in-turn provide these
39
stretched thin. By supporting GPs and other providers in identifying and treating risk of
malnutrition with a first line option of Food First intervention, reduction in unnecessary
dietetic referrals may result from the better triaging of which patients respond to Food
First and which are more severe and certainly could benefit from a dietetic referral.
Although there is good reason for better triaging of patient referrals to dietitians,
the guidance to GPs does not offer detailed support on patient counseling techniques for
the implementation of the Food First approach. Many physical and social factors influence
an individual’s ability to obtain, prepare, and consume food. A dietetic referral would
include a detailed social history including who does the shopping, driving, preparing and
cooking of foods, as well as support in goal setting to find personalized methods for
increasing calories through motivational interviewing and offering relevant suggestions.
Patient compliance with Food First approach using written handouts and a quick to-do-list
from their GP may not provide high compliance rates when compared to what it could be
with a dietetic referral.
While there are draw backs to the recommendation of the Food First pathway in GP
practices, it is better than the current situation in Buckinghamshire GP practices in relation
to malnutrition screening and treatment. Currently there are no structured processes
apparent in the GP practice and audits are revealing over prescription of nutritional
supplements (ONS) leading to increased expense to the NHS. Implementing this pathway
will help to aim malnutrition treatment intervention to the correct patients, save
prescription of ONS to those who physically are not able to prepare the extra foods or
40
that can not be addressed by a physician or written guidance provided to GPs from
dietitians.
Continual quality improvements can occur with this initial malnutrition screening
and Food First pathway. This could include an additional social history component when
conducting the malnutrition screening and considering treatment. Also, identifying and
documenting in GP notes one to two practical ways of increasing calories each day that the
patient agrees will work for their lifestyle would be useful. Lastly, the future of dietetics
may include a heavier role in advising of other healthcare professionals in providing
first-line nutrition counseling and support, so it will be important for dietitians to consider what
is acceptable for other professionals to provide and what the best practice should be for a
dietetic referral related to malnutrition.
Conclusion
The implementation of this project supported the implementation of the MUST in
the primary care setting. Its successful implementation and the identification of a higher
prevalence of malnutrition risk than anticipated demonstrates the importance of
malnutrition screening in the community, as an increasing number of people aged 80 years
of age and over are living in the community and may be experiencing elements of
malnutrition, which can then lead to increased frequency of GP visits and acute admissions
to hospitals. By raising GPs’ awareness of the improved patient care and cost savings that
can ensue from regular screening, identification and early treatment of malnutrition,
acceptance of implementing the NICE quality standard for the screening of malnutrition in
41
Recommended future research includes focusing on identifying the best methods of
measuring height (specifically self-reported measures and ulna length height estimates)
and which healthcare professionals are best placed to measure height and weight for
people 80 years of age and over. Research exploring the use of an age-adjusted BMI range
for older people or measures of fat free mass loss versus overall weight loss when
implementing the MUST in this age population may also be beneficial. Additional benefit
could come from working with GP practices to identify cost benefit analysis for regular
implementation of the NICE guidance on malnutrition screening and treatment in primary
care. Lastly, it is not enough to just identify malnutrition risk, as identification must then
lead to action. Studying the action GP practices take after identifying patients at risk of
malnutrition and how well the intervention strategies and pathways, specifically Food
First, are promoted and implemented by GPs and patients would be valuable to
successfully treating and reducing prevalence of malnutrition in the county of
42
References
Adams, N. E., Bowie, A. J., Simmance, N., Murray, M. and Crowe, T. C. (2008). Recognition by medical and nursing professionals of malnutrition and risk of malnutrition in elderly hospitalised patients. Nutrition & Dietetics, 65, 144–150. doi:
10.1111/j.1747-0080.2008.00226.x Retrieved from
http://onlinelibrary.wiley.com/doi/10.1111/j.1747-0080.2008.00226.x/abstract?deniedAccessCustomisedMessage=&userIsAuthenticate d=false
Alibhai, S.M.H., Greenwood, C., Payette H. (2005). An approach to the management of unintentional weight loss in elderly people. Canadian Medical Association Journal, 172(6), 773-80. doi:10.1503/cmaj.1031527
American Dietetic Association. (2009). Pocket Guide for International Dietetics and Nutrition Terminology Reference Manual: Standardized Language for the Nutrition Care Process. 2nd ed. Chicago, IL.
BAPEN, Advisory Group on Malnutrition. (2009). Combating Malnutrition: Recommendations for Action. Redditch, Worchestershire, UK.
BAPEN, Malnutrition Advisory Group. (2011). THE ‘MUST’ EXPLANATORY BOOKLET A Guide to the ‘Malnutrition Universal Screening Tool’ (‘MUST’) for Adults. Redditch,
Worchestershire, UK: Malnutrition Action Group.ISBN 978-1-899467-71-6
BAPEN. (2012a). NUTRITION SCREENING SURVEY IN THE UK AND REPUBLIC OF IRELAND IN 2011: HOSPITALS, CARE HOMES, AND MENTAL HEALTH UNITS. Redditch,
Worcestershire, UK: Russell, C.A., Elia, M.
BAPEN, Malnutrition Advisory Group. (2012b). The ‘MUST’ Report. Redditch, Worcestershire, UK. ISBN 1 899467 701 X
BAPEN, Malnutrition Advisory Group. (2012c). The ‘MUST’ Report Executive Summary.
Redditch, Worcestershire, UK. Retrieved from
http://www.bapen.org.uk/screening-for-malnutrition/must/must-report/the-must-report-executive-summary
Buckinghamshire County Council, Research Team. (2012). 2011 Census Results for
Buckinghamshire: Age structure of Buckinghamshire county and districts. Bucks, UK. Retrieved from http://www.chiltern.gov.uk/article/2290/Population-Statistics
43
Collins, S., Duffield, A., Myatt, M. (2000). Assessment of Nutritional Status in Emergency-Affected Populations – Adults. Issued by the UN ACC/Sub-Committee on Nutrition. Retrieved from
http://www.unsystem.org/scn/archives/adults/ch05.htm#Body%20Mass%20Index
ENHA. (2006). Malnutrition among Older People in the Community: Policy Recommendations for Change. London, UK
ENHA. (2010). Report Tackling Malnutrition: Oral nutritional supplements as an integrated part of patient and disease management in hospital and in the community: A
summary of the evidence base.
Kamel, H.K. (2003). Sarcopenia and Aging. Nutrition Reviews, 61(5), 157-167.
Secretary of State. (2000). Schedule 3 of the Non-Automatic Weighing Instrument (NAWI) Regulations 2000 No. 3236. Stationary Office. Norwich, UK.
Morley, J. (2007). Weight-loss in older persons: new therapeutic approaches. Current
Pharmaceutical Design, 13(35), 3637-3647.
NICE. (2006). Nutrition support in adults: Oral nutrition support, enteral tube feeding and parental nutrition. UK: Retrieved from
https://www.nice.org.uk/guidance/cg32/chapter/1-guidance
NICE. (2012). Quality standards for nutrition support in adults. UK: Retrieved from
http://www.nice.org.uk/guidance/qs24/chapter/introduction-and-overview
NPC, NICE. (2012). Prescribing of adult Oral Nutritional Supplements (ONS): Guiding principles for improving the systems and processes for ONS use. UK.
Phillips, E.M., Schneider, J.C., Mercer, G.R. (2004). Motivating elders to initiate exercise. Arch
Phys Med Rehabil, 85(Suppl 3), S52-7.
Public Health England, Respiratory Diseases Department, CIDSC, Colindale. (2014).
Surveillance of influenza and other respiratory viruses in the United Kingdom: Winter 2013/14. London, UK. PHE gateway number: 2014110
Smith, A. (2014a). Potential barrier to effective MUST implementation. British Journal of
Clinical Nursing, Nutrition, October 2014, S28-31.
Smith, A., (2014b). Sip feeds audit – background. Amersham, UK: Aylesbury Vale CCG and Chiltern CCG.
44
Thomas, R.J., Kottke, T.E., Brekke, M.J., et al. (2002). Attempts at changing dietary and exercise habits to reduce risk for cardiovascular disease: who’s doing what in the community?. Preventive Cardiology, 5, 102-8.
MedlinePlus, US National Library of Medicine, National Institute of Health. (2014). Aging changes in body shape. Retrieved on November 16, 2014 from
http://www.nlm.nih.gov/medlineplus/ency/article/003998.htm
45
Appendix A
“‘Malnutrition Universal Screening Tool’”
46
Appendix B
“MUST management guidelines”
47
Appendix C
“Handout”
48
Appendix D
“Recording Chart Version 1”
“Recording Chart Version 2”
49
Appendix E
“Interview Script”
50
Appendix F
“Follow-up Patient Letter”
51
Appendix G
“Patient/carer information: Food First – Eating well for small appetites”