TABLE OF CONTENTS
No. of Pages
Section 1
Preliminary Experiments ... 21
Section 2
Selected Methods for Functional Group Analysis
.of FuiVic Acid ... 12
Section 3
Microdetermlnation of Carboxyl Groups in
Fulvic Acid and Related Polycarboxylates ... 13
Section 4
Binding Properties of Fulvic Acid ... 43
LIST OF FIGURES
Page no. Section 1
1-4 Figure 1 I.R. Spectrum, Aldrich Fulvic Acid
1-4 Figure 2 I.R. Spectrum, Singletary Lake Fulvic Acid
1-6 Figure 3 I.R. Spectrum, Aldrich Fulvic Acid
(dialysis-in)1-7 Figure 4 I.R. Spectrum, Aldrich Fulvic Acid
(dialysis-out)1-9 Figure 5 I.R. Spectrum, Diazomethane Methylation of
Fulvic Acid (SL104,1-9 Figure 6 I.R. Spectrum, BF3 /MeOH Methylation of
Fulvic Acid (SL104)
1-11 Figure 7 HPLC Chromatogram
1-13 Figure a 13 C NMR
1-14 Figure 9 Proton NMR
1-16 Figure 10 I.R. Spectrum, Sodium Bicarbonate
Section 3
3-12 Figure l Proton NMR Spectroscopy of Native and Djo
Exchanged Benzene Pentacarboxylate
LIST OF TABLES
Page no.
SECTION 1
1-10 TABLE 1 HPLC RUN CONDITIONS
1-12 TABLE 2 NMR RUN CONDIT IONS,METHYLATED FULVIC ACID
1-17 TABLE 3 ASH CONTENT
SECTION 2
2-10 TABLE 1 RESULTS OBTAINED FOR FUNCTIONAL GROUP DETERMINATION OF
AQUATIC FULVIC ACID FROM LAKE SINGLETARY, N.C.
SECTION 3
3-11 TABLE 1 COMPARISON OF CARBOXYL CONTENT OF VARIOUS SAMPLES OF
FULVIC ACID
3-11 TABLE 2 COMPARISON, BY TWO INDEPENDENT METHODS OF CARBOXYL CONTENT
OF ONE FULVIC ACID SAMPLE SECTION 4
4-19 TABLE 4.3.1 DPM RESULTS OF "BINDING OF DMP TO FULVIC ACID
SEP-PAK, PROCEDURE I)."
4-22 TABLE 4.3.2 BINDING OF DMP TO FULVIC ACID
(SEP-PAK, PROCEDURE II).4-23 TABLE 4.3.3 BINDING RESULTS OF DIETHYL HEXYL PHTHALATE TO
FULVIC ACID; SEP-PAK PROCEDURE.
4-26 TABLE 4.3.4 ABSORBANCE VALUES AND RESPECTIVE PERCENTAGES OF
ORGANIC CARBON IN DIFFERENT ELUTIONS (WATER AND METHANOL) OF
FULVIC ACID THROUGH CIS SEP-PAK CARTRIDGES.
4-28 TABLE 4.3.5 ABSORBANCE VALUES AND RESPECTIVE PERCENTAGES OF ORGANIC
CARBON IN DIFFERENT ELUTIONS (WATER AND METHANOL) OF FULVIC ACID
THROUGH HAND-PACKED XAD-2 RESIN CARTRIDGES
4-29 TABLE 4.3.6 RESULTS OF 14C LABELED DEHP BINDING TO
FULVIC ACID; XAD-2 RESIN PROCEDURE
4-29 TABLE 4.3.6.1 AVERAGES OF WATER FRACTIONS; AND WATER, THF AND XAD-2
RESIN FRACTIONS ADDED TOGETHER. DPM AVERAGES ARE SHOWN FOR EACH
SAMPLE; WATER, FULVIC ACID (SL104), AND ALDRICH FULVIC ACID.
4-31 TABLE 4.3.7.1 PEAK HEIGHTS OF ORGANiCS EXTRACTED FROM
2.5 MG OF FULVIC ACID (SL104). INTERNAL STANDARD,
25 ug OF DI-N-OCTYL PHTHALATE.
4-31 TABLE 4.3.7.2 PEAK HEIGHTS FROM GC OF ORGAN I OS EXTRACTED
FROM A BLANK CONTROL. INTERNAL STANDARD, 25 uG OF
DI-N-OCTYL PHTHALATE.
4-32 TABLE 4.3.7.1.1 QUANTITATION OF ORGAN I OS EXTRACTED FROM
25 MG OF FULVIC ACID (SL104). INTERNAL STANDARD, 25 ug
OF DI-N-OCTYL-PHTHALATE.
4-32 TABLE 4.3.7.1.2 QUANTITATION OF ORGAN ICS EXTRACTED FROM A BLANK CONTROL. INTERNAL STANDARD.25 ug
OF DI-N-OCTYL PHTHALATE.
4-34 TABLE 4.3.8 RESULTS OF EXTRACTABILITY OF DEHP FROM FULVIC ACID
(SL104)4-35 TABLE 4.3.9 RESULTS OF THE DEHP PURITY EXPERIMENT USING THIN LAYER CHROMATOGRAPHY (TLC) AND 14C LABELED DEHP
4-36 TABLE 4.3.10 RESULTS OF 2,3,7,8 - TCDD BINDING
TO FULVIC ACID (SL104).4-38 TABLE 4.3.11.1 BINDING OF NON-POLAR ORGANICS TO
CLAY (KAOLINITE) 14C DEHP RESULTS
4-38 TABLE 4.3.11.2 BINDING OF NON-POLAR ORGANICS TO
CLAY(KAOLINITE), 14C 2,3,7,8 - TCDD RESULTS.
4-40 TABLE 4.3.12 RESULTS OF THE PROMETONE BINDING EXPERIMENT
4-42 TABLE 4.3.13 RESULTS OF DDT BINDING EXPERIMENT
PREFACE
Aquatic fulvic acid, the soluble organic material of natural
waters that is not extractable into organic solvents and that
remains dissolved on acidification with mineral acid (ref.1), is
believed to be a complex mixture of natural products, and to be
responsible for the binding and transport of many non-polar organic
pollutants (ref.2). My research objective Is to better understand
the composition of fulvlc acid, be able to Identify differences and
similarities between fulvic acids obtained from different sources,
as well as to Identify chemical properties believed responsible for
the binding of organic pollutants.
During the time spent doing res«arch I found that there were
four separate and distinct phases associated with my work . For
this reason I have chosen to divide my report into four sections.
Section 1 is an introduction as well as a description of prelimin¬
ary experiments chosen to help determine the direction my research
should take. Section 2 presents methods of functional group analy¬
ses chosen to characterize fulvic acid. Section 3 Is an expanded
version of one specific method for micro determination of carboxyl
groups in fulvic acid. (Sections 2 and 3 are research papers
submitted for publication and are included In my report.) The
final section, section 4, Is work related to binding studies
associated with fulvlc acid. I have also presented a summary of my
work in hopes of helping the reader to understand the relationship
existing between each section.
Institute of Environmental Health Sciences. All work was done In
the laboratory of Dr. Phillip Albro, who also served as my research
advisor. The fulvic acid used for part of my research was provided
by the Humlcs Group at the University of North Carolina at Chapel
Hill, headed by Dr. Russell F. Christman and Dr. J. Donald Johnson
who both served In an advisory capacity on my committee. With the
assistance of these people as well as help from the aforementioned
institutions I was able to successfully accomplish my research
SECTION I
1.1 INTRODUCTION
The background Information 1 obtained Indicated there is much
to be learned concerning methods of functional group characterizat¬
ion for fulvic acid. The nature of such a complex material is not
well known and different research groups report different Informat¬
ion concerning the characterization of fulvic acid. This Is
probably due to the various sources from which the fulvic acid Is
obtained as well as the variety of methods used.I began my research by purchasing Aldrlch Humic Acid (Aldrlch
Chemical; Milwaukee, Wl.) from which I extracted fulvic acid with a
modification of Thurman and Malcolm's separation method (ref.1,3).
i did this because of the difficulty of obtaining a natural aquatic
fulvic acid (eg. Singietary Lake) at this point In time. Once
extracted, some of the more commonly-used types of analyses were
performed. Many of these methods turned out to give misleading
results and will be discussed briefly in my experimental section.
Some of these techniques however proved to be valuable for further
research.I originally Intended to functionally Identify a large portion
of the fulvic acid structure. ( Lake Singietary fulvic acid was
subsequently obtained and the use of Aldrlch material discontin¬
ued.) I was also Interested In functional groups unique enough to
enable one to easily quantify trace quantities of fulvic acid. The
usefulness of being able to quantify trace amounts of fulvic add
whether a portion of the fulvic acid remains on an HPLC column
after the separation is believed to be complete. If one could quantify fulvic by a simple yet sensitive method determining
accurately the ratio of the functional group of interest to the total weight of fulvic acid, the percentage of fulvic acid
recovered from an HPLC column could be determined. This would be
valuable for determining any small quantity of fulvic acid too
small to be accurately weighed. The first section of my report
will examine preliminary steps taken towards these types of analyses while sections 2 and 3 expound on actual functional group identification methods used.
1.2 PRELIMINARY EXPERIMENTS
1.2.1 Extraction of FuIvIc Acid from Aldrich Humic Acid Sod 1um Salt
One gram of AldrIch Humic acid sodium salt (Aldrich Chemical) was dissolved in a one liter graduated cylinder filled with
de-Ion Ized/d 1st I 1 led water. While stirring constantly HCL was added
to bring the pH of the solution to 1 (approximately 50 ml HCL ).
The cylinder was capped and refrigerated (approximately 4 C ) allowing the precipitate to settle overnight. The following day the supernatant fraction was carefully vacuum filtered through Whatman filter paper #1 and the remaining slurry poured Into
centrifuge tubes and spun at 3000 rpm for 20 minutes in a refriger¬
ated centrifuge at 4 C. The supernatant in these tubes was poured through the filtering apparatus used previously and added to the supernatant previously collected. The precipitate was discarded.
column and eluted with 0.1N NaOH solution. Five mi I IiIiter fractions were collected from the column and fraction collection was discon¬
tinued when no more color was detectable in the elution. The brownish-yellow fractions were combined, neutralized with 0.1N HCL and freeze-drled overnight.
The following day the freeze-drled material was dissolved in as little de-ionized/dlstiI led water as possible and put through an
Ion-retardation column (AG-11, A8, 50-100 mesh, Bio-Rad, Richmond, Ca.), eluted with water collecting 2.5 mL fractions until no more distinguishable color was observed. Starting with the fractions collected last, working bacl<wards, towards the first fractions
collected, a few drops of concentrated Silver Nitrate solution
(saturated AgNO_, Aldrich Chemical, In de-lonized/dlstIiled water )
was added to each tube to detect the presence of free chloride ion
by forming a white silver-chloride precipitate. I expected the chloride ion to be detected In the almost colorless fractions with
a decreasing concentration detected as the more yellowish colored
fractions were tested. At some point prior to testing the
yellowish-brown fractions, 1 predicted the chloride ion would be non-detectable. I discovered however the chloride ion was not adequately separated from the fulvlc acid the first time through the column. I therefore combined all the non-tested
yellowish-brown fractions, freeze-drled them, and eluted them through the
AG-11 column as before. Usually this second elution proved more
successful for separation of excess chloride ion from fulvlc acid.
After a final freeze-drying process the fulvic acid was ready for analysis.
Figure 1 (top). I.R. Spectrum,Aldrich Fulvic Acid
An infrared (IR) spectrum of the fuivic acid (fig.1) was run by
making a KBr (Perkin-Elmer) pellet and using a Perkin Elmer 3,000
infrared spectrophotometer. I later compared this spectrum with a
similar spectrum of SIngletary Lake Fuivic Acid (fig.2).
Further purification was accomplished by dialysis. A portion
of the fuivic acid was dissolved in de-ionlzed/dist1 I led water and
put in a dialysis bag with a molecular weight cut-off of
6,000-8,000 (spectrapore 1, Fisher Scientific ). This was allowed to
dialyze against water for a period of 72 hours. The fraction
remaining Inside the bag (dialysis-in) was removed, freeze-drled
and an IR spectrum (fig.3) was run in a similar manner to the
un-dialyzed fuivic acid The fraction outside the bag (dialysis-out)
was also freeze-drled, an IR spectrum also run and compared to the
dialysis-in fraction (fig.4).
1.2.2 A£h Content
In anticipation of being able to characterize a major percent¬
age of fuivic acid into specific functional groups I concluded it
would be desirable to quantify the non-ox Idizable portion as well.
For each fraction, dialysis-out and non-dlalyzed Aldrich fuivic
acid and Singletary Lake fuivic acid, I carefully weighed about 10
mg Into a dry crucible (previously weighed) and recorded the weight
of each sample to the nearest 0.1 mg. I placed the crucible with
fuivic acid over a bunsen burner for about 3-5 minutes being sure
all oxldlzable material had dissipated. The crucible was then
placed In a desiccator and weighed when cool. The ash content was
computed as follows:
wt. of non-oxidized fuivic acid
Figure 3. I.R. Spectrum, Aldrlch Fulvic Acid (dialysis-in)
I^I^IWI'^P^Wi^^liV
Figure 4. I.R. Spectrum, Aldrich Fulvic Acid (dialysis-out)
1.2.3 MethvlatIon
Two separate procedures were used for methylation of fulvic
acid. The first Involved diazomethane generation using
N-methyl-N-nItroso-N'-nltroguanldlne (Aldrlch Chemical) (ref.4). Once
generated the diazomethane In ether was added and allowed to react
with the fulvic acid. Several different ratios of diazomethane in
ether and fulvic acid were tried and it was soon discovered that it
required about 1 mL diazomethane/ether (concentration below) added
to approximately 1 mg fulvic acid and a reaction time of 1 hour for
complete methylation. After which the fulvic acid was blown dry N
at 45 C and an IR spectrum run (KBr pellet) to show complete
methylation had taken place (refer to fig. 5).
Diazomethane/ether Is generated by placing 1 mmole of
N-methyl-N-nitroso-N'-nitroguanldlne Inside the inner tube of an
apparatus that will capture the diazomethane gas in an ether col¬
lection tube. To the N-methyl-N-nltroso-N'-nitroguanldlne 0.5 ml.
of de-ionlzed/distI I led water Is added. The Is tube capped with a
rubber septum, and placed inside the outer tube containing 3 mL of
ethyl ether. The apparatus is clamped shut and placed In an ice
bath to cool the reaction. Using a syringe 0.6 ml of chilled 5M
NaOH solution is added to the N-methyl-N-nltroso-N'-nitroguanldlne
In water. This is done under a protective hood using caution
because if gas formation Is too rapid the apparatus could explode.
The reaction is allowed to proceed for 45 minutes after which the
diazomethane/ether is removed and ready for use. If stored the
solution, now a dark yellow, should be capped securely and kept
refrigerated. This process should yield about 0.8 mmole
(top) Figure 5. I.R. Spectrum, Diazomethane Methylation of Fulvic Acid (SL104)
(bottom) Figure 6. I.R. Spectrum, BF3/MeOH Methylation of Fulvic Acid (SL104)
MI«»>V»*
methane In 3 ml ether (ref.4).
The second methyl at ion procedure used 14% BF in Methanol
(Aldrich Chemical). Approximately 2 mg of fulvic acid was added to
4 ml of 14% BF^ / Methanol in a teflon-lined screw cap test tube.
The tube was capped, vortexed, and heated to 95 C + or - 5 C for
five minutes. The reaction mixture was cooled and the "methylated
fulvic acid" extracted by adding 60 mL of HO, pouring the soiution
into a separatory funnel and extracting three times with 60 mL
fractions of ethyl ether. The ether extract was dried over anhy¬
drous sodium sulfate, filtered through glass wool and
roto-evapor-ated to dryness. An IR spectrum of this methylroto-evapor-ated fulvic acid was
also taken (fig.6).
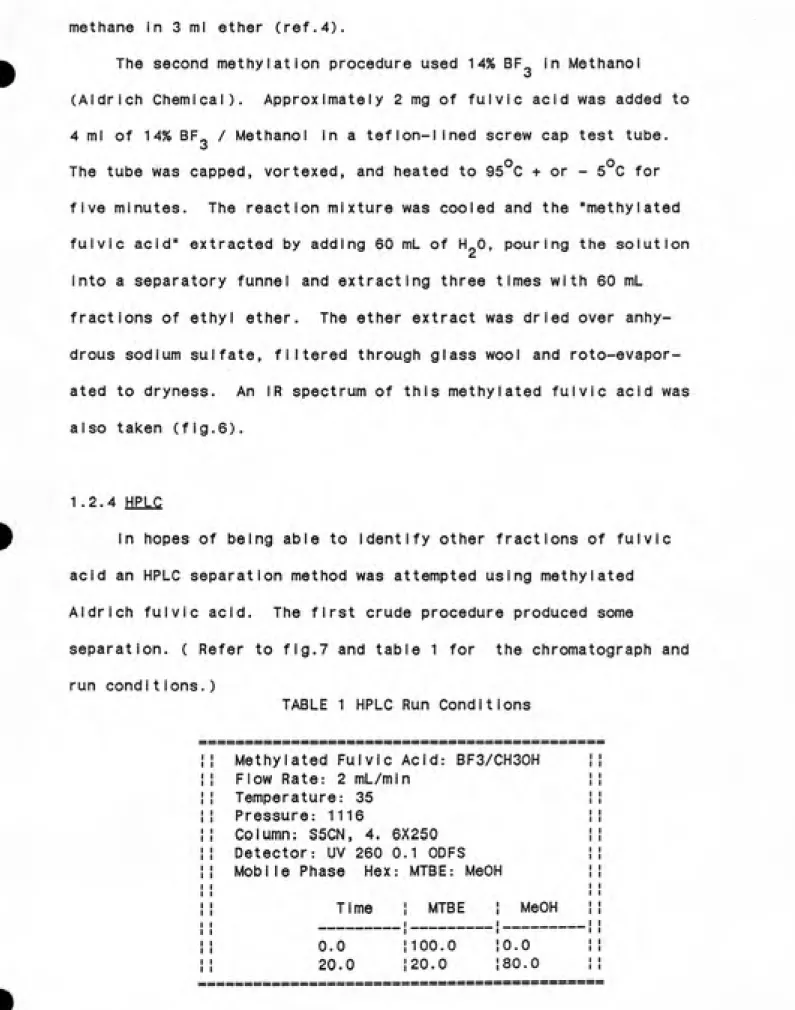
1.2.4 HPLC
In hopes of being able to Identify other fractions of fulvic
acid an HPLC separation method was attempted using methylated
Aldrich fulvic acid. The first crude procedure produced some
separation. ( Refer to fig.7 and table 1 for the chromatograph and
run condi t ions.)TABLE 1 HPLC Run Conditions
Methylated Fulvic Acid: BF3/CH30H
Flow Rate: 2 mL/minTemperature: 35 Pressure: 1116
Column: S5CN, 4. 6X250
Detector: UV 260 0.1 ODFS
Mobile Phase Hex: MTBE: MeOH Time
0.0
20.0
MTBE 100.0
20.0 80.0
1.2.5 um.
Nuclear Magnetic Resonance (NMR) spectroscopy was also per¬
formed with methylated fu|vic acid obtained from the humics group
13
at UNC , batch SL104, and methylated with diazomethane. A C NMR
spectrum was run as well as a proton NMR spectrum. Figures 8 and 9
show the spectra and table 2 presents run conditions.
TABLE 2 NMR Run Conditions
Methylated Fulvic Acid
Proton 13C 1
ͣ
Pulse Width 3.00 usec 15.00 usec ! 39 Degrees 76 Degrees |
ACQ. T i me 1.36 sec 229.38 msec ',
Recyle Time 8.15 sec 9.83 sec 1
No. of ACQS. 120 202,700 !
Data Size 16384 -8192 !
Line Broadening 1 0.50 H:'. 1 0.50 Hz 11
Spin Rate 14 RPS 12 RPS 1
Frequency 300.151850 MHz 75.480819 MHz 1
Spec Width 6024 Hz 17857 Hz 1
Plot Scale
From 5.79 222.71 1
To -0.80 PPM -13.8 PPM 1
1.3 RESULTS AND DISCUSSION
1.3.1 Extraction gf. Fulvic Acid from AldrIch Humic Acid Sodium Salt
The IR spectra of the three collected Aldrlch fulvic acid
fractions (the non-diaiyzed, dialysls-in and dialysis-out fract¬
ions; figures 1, 3 and 4 respectively) were compared to an IR
spectrum of a SIngletary Lake fulvic acid fraction (SL104) obtained
from the Humics Group at the University of North Carolina (fig.2).
These spectra show no distinguishable difference between the
en O
CJ1 o
o
o
o
.o
-o
CD o
o
en o
~\ o
%
oen O
o
o
to _ o
00 o 13 tJ
Figure 9. Proton NMR
'''^**^"^*H^i*i«'V»*WV*^^^
%v
r •' ' ' 1
iiiii|iiii|iiiiiiiii|iiii|iiii|iiii|iiii|iiii|iriiiit<i'|'iiil|''|''i'|'i''|'i''|'''''|''''|''''|''''|''''l'
dialyzed and diaiysis-in fractions of Aldrich fulvic acid. Any
differences seen between these two fractions and the Singletary
Lalce fulvic acid tells us nothing of structural differences between
the complexes. While Aldrich fulvic acid is obtained from a soil
source and Singletary Lalce fulvic acid is obtained from an aquatic
source, and it is believed there are major structural differences
between the two (ref.5), the IR spectra are of little use In
dls-t inguishing dls-these di fferences.
Figure 4, the dialysis-out fraction, is an unusual spectrum
for any previously examined fulvic acid spectra (ref.6). It shows
very distinct peaks and was found to be very reproducible each
time Aldrich fulvic acid was dialyzed. At first it was believed to
be promising evidence for positively identifying a specific fract¬
ion of fulvic acid. However, by chance, this exact IR spectrum was
discovered to be simply a spectrum of sodium bicarbonate (fig.10).
Evidently sodium bicarbonate was artificially produced, presumably
in the neutralization step following elution from the XAD-2 resin
column. (Refer to the experimental section, 1.2.1.) in fact separ¬
ation by dialysis showed that a majority (approximately 80%) of
what was thought to be fulvic acid was simply sodium bicarbonate.
However this spectrum gives evidence that fulvic acid will not
dialyze through a dialysis bag with a molecular weight cutoff of
6,000-8,000. The IR spectrum of the dialysis-out fraction shows no
indication of anything but sodium bicarbonate. (Compare figs. 4 and
10.)
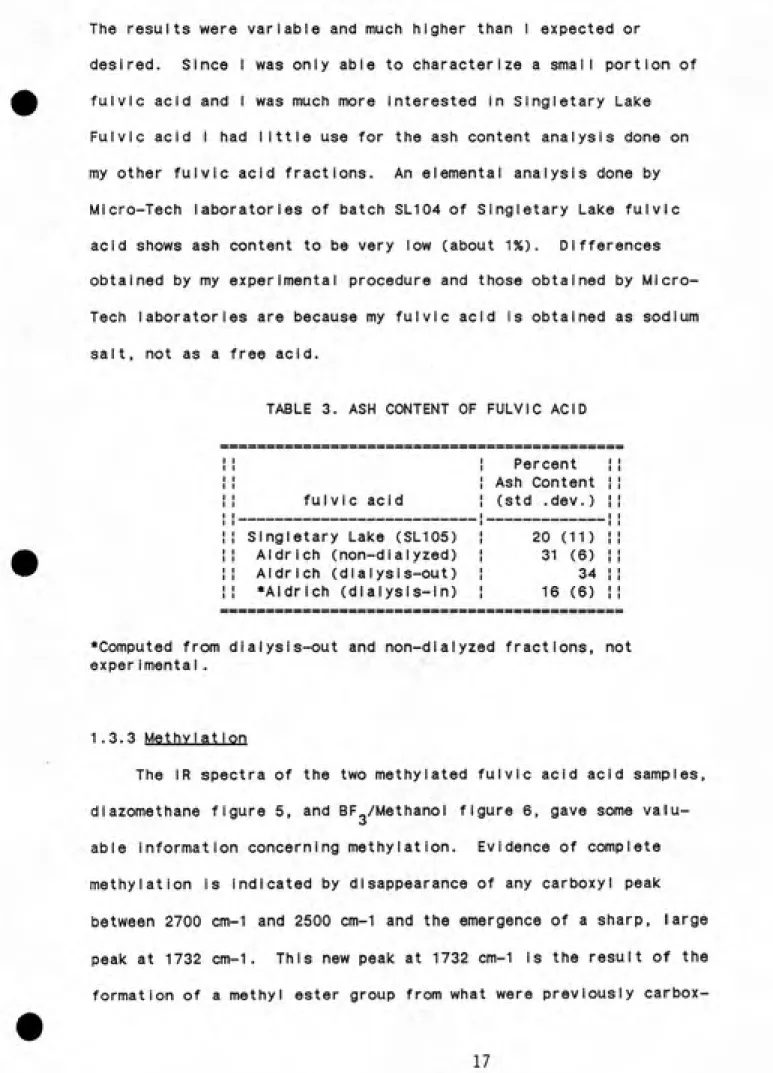
1.3.2 Ash Content
The results of the ash content analysis are shown in Table 3.
Figure 10. I.R. Spectrum , Sodium Bicarbonate
The results were variable and much higher than I expected or
desired. Since I was only able to characterize a small portion of fulvlc acid and I was much more Interested in Slngletary Lake
Fulvic acid I had little use for the ash content analysis done on
my other fulvic acid fractions. An elemental analysis done by Micro-Tech laboratories of batch SL104 of Slngletary Lake fulvic acid shows ash content to be very low (about 1%). Differences obtained by my experimental procedure and those obtained by Micro-Tech laboratories are because my fulvic acid is obtained as sodium
salt, not as a free acid.
TABLE 3. ASH CONTENT OF FULVIC ACID
fulvi c acid
Percent
Ash Content
(std .dev.) Slngletary Lake (SL105)
Aldrich (non-dialyzed) Aldrlch (dialysls-out) *Aidrlch (dialysis-in)
20 (11) 31 (6)
34
16 (6)
Computed from dialysis-out and non-dialyzed fractions, not experImental.
1 .3.3 Methvlatlon
The IR spectra of the two methylated fulvlc acid acid samples,
diazomethane figure 5, and BF /Methanol figure 6, gave some valu¬ able information concerning methyl at ion. Evidence of complete methyl at I on is indicated by disappearance of any carboxyl peak between 2700 cm-1 and 2500 cm-1 and the emergence of a sharp, large
peak at 1732 cm-1. This new peak at 1732 cm-1 is the result of the
formation of a methyl ester group from what were previously
yl groups. Both the diazomethane (ref.4) and BF /Methanol methyl-
oation procedures have been shown to be carboxyl specific with
interferences from phenol not found in our sample.
While the BF /Methanol IR spectrum indicated incomplete
methylation (fig. 6) the diazomethane methylatlon appeared complete
when using the free acid form of fulvlc acid (fig. 5). If any of
the fulvic acid is in the salt form, methylatlon will not be com¬
plete since the mechanism for methylatlon requires the free-acid
configuration (ref.4). The diazomethane methylation procedure also
required a large excess of diazomethane/ether because of the
in-solubilty of fulvic acid in ether. ( Proportions used were stated
in the previous paragraph. ) This was used as the procedure of
choice for future methylatlon.
1.3.4 HPLC
Methylated fulvlc acid, run on HPLC, showed promising separation
(fig.7). Table 1 shows run condition and peak areas recorded. I
did not however continue with this Investigation and chose another
path for my research. 1 have Included the chromatogram as an
indication that HPLC separation may lead to a better characterizat¬
ion of fulvlc acid. My research was directed toward functional
group characterization and binding properties associated with
aquatic fulvic acid and did not explore further separation by HPLC.
1.3.5 NMR
Nuclear Magnetic Resonance (NMR) Spectroscopy was valuable in
developing a method for mIcro-quant1 tat Ion of carboxyl groups In
fulvic acid (see section 3). Preliminary research with NMR indi¬ cated what could and could not be accompiI shed using fulvic acid.
Dissolution of fulvic acid (SIngletary Lake fraction) in DO
13
showed no peaks of interest In either C or proton NMR. The NMR
operators were never successful in decoupling the water peak which appeared at full scale causing all other peaks to be insignificant. This water was not removable by freeze-drying, and from the IR
spectra appeared to be either water of crystallization or some other
tightly associated bound form of water. However, NMR spectra of methylated fulvic acid dissolved in a mixture of CDCI_ /DMSO showed
1 3
some interesting results in C and proton NMR (figs.8 and 9
respectively). These spectra may be of further interest to those using NMR for characterization of fulvic acid. My purpose was to explore the possibility of NMR characterization of fulvic acid and present my findings. Interpretation of these spectra is left to
the reader.
1.4 CONCLUSIONS
While my research branched Into different directions I found
these preliminary studies to be of use in gaining a better under¬
standing of the material I was working with. These studies helped
to define a direction from which my research could proceed. With
so little known about fulvic acid and so much yet to be learned
these attempts of defining possible research directions seemed
appropriate. This however may be a somewhat confusing presentation
and leave many questions yet to be answered. I included this
information because I felt It may be useful to future research and
because I found some of it to be beneficial to my other studies.
I realize this work represents incomplete experimentation and
is not intended to constitute a research report. The rest of my
report represents work in the development of specific procedures used in characterizing ful vi c add as wel I as some Interesting
results concerning binding properties. The three following
sections deal with three separate and more complete phases of study.
REFERENCES
1) E.M. Thurman and R.L. Malcolm, Environ. Sci. Techno!. 15,
463-466 (1981).2) G. Ogner and M. Schnitzer, Science, 170, 317-318 (1970).
3) R.F. Christman, W.T. Llao, D.S. Millington, J.D. Johnson;
"Oxidative Degradation of Aquatic Humic Material" in L.H.
Kei th, ed., Advances in the I dent!fI cat ion and Analysis of Organic Pollutants in Water. Vol. 2. Chapt. 49, Ann Arbor Sci. Pub., (1981)
pp. 979-999.
4) McKay, J. Am. Chem. Soc, 70, 1974 (1948).
5) E.T. Gjessing, Physical and Chemical Character ist ics of AauatIc Humus. Ann Arbor Sci. Pub., (1976) pp. 15-85.
6) K.M. Goh and F.J. Stevenson, Soil Sci., 112, 392-400 (1971).
SELECTED METHODS FOR FUNCTIONAL GROUP ANALYSIS OF FULVIC ACID
by
Joseph Evans and Phillip W. Albro
National Institute of Environmental Health Sciences
Laboratory of Molecular Biophysics
PO Box 12233
fSTRACT
Methods were evaluated for quantification of various functional groups in
fulvic acid. These functional groups included aliphatic hydroxyls, phenolic
hydroxy!s, quinones, primary amines and bound carbohydrates. AIT tests per¬
formed required 1 mg or less of fulvic acid and yielded statistically reprodu¬
cible results. Most functional groups were evaluated by two independent methods
of differing specificities. Separate collections of fulvic acid were used for
0ITRODUCTION
Fulvic acids are those organic compounds of natural waters that are not
extractable into organic solvents and which do not precipitate at pH 1, Thurman
and Malcolm (1981). Characterization of fulvic acid usually includes quan¬
titative functional group analyses of the complex mixture of organic compounds
present. Characterization of functional groups in fulvic acid preparations is
useful in elucidating their composition and structure as well as determining
differences between fulvic acids from various sources. While some investigators
have used more traditional functional group determination procedures requiring
large quantities of material, Schnitzer and Gupta (1964, 1965), Dubach and Menta
(1963), others have used infrared spectroscopy,(Eltantaway and Bauctez (1978),
Gjessing (1976), Goh and Stivanson (1971), Mathur (1972), Sipes and Sipos
^1979), Wagner and Stevenson (1965)) which can often be qualitatively misleading
and usually does not permit quantitation. Nuclear magnetic resonance (NMR)
spectra can also be quantitatively misleading since most of the protons in
fulvic acid are exchangeable. Hence various procedures have shown
incom-parability of results.
We therefore have selected what we believe to be some simple, functional
group tests not previously used in fulvic acid studies. None of the methods
presented are new, but are variations of previously published techniques used
for other complex materials (e.g. proteins). Our presented methods require only
small amounts of fulvic acid for accurate deto-minations\ This would allow one
to easily quantify functional groups from various fulvic acid samples. We have
evaluated procedures for the following functional groups; total hydroxyls,
>id we used was collected from Singletary Lake, N.C. by the Humics Group at the
University of North Carolina at Chapel Hill, and extracted by a method similar
to that of Thurman and Malcolm (1981).
EXPERIMENTAL
A) Total Hydroxyls
Weigh out approximately 1 mg of fulvic acid into a 15 ml screw top test tube
with a teflon lined cap. Dissolve in 3 ml of redistilled, dry pyridine (Fisher,
A.C.S.; Fair Lawn, N.J.) and add 1 ml of redistilled acetic anhydride (Baker
Chemical; Phillipsburg, N.J.). Cap, and shake gently for 24 hours at room tem¬
perature. As reported by Petersen et al. (1973), this procedure will acylate all
primary and secondary hydroxyl groups; even those that are Sterically hindered.
^ After 24 hours the pyridine and excess acetic anhydride are blown off under
N2 at 60°C. A blank containing only acetic anhydride and pyridine is run as a
control to check for complete evaporation of the acetic anhydride. Even small
traces will interfere with the next step of the procedure.
The acylated fulvic acid is dissolved in 0.1 ml of 95% ethanoi and the
ferric hydroxamate procedure outlined by Rapport and Alonzo (1955) for
spectrophotometric acyl ester determination is followed. A control experiment
using non-acylated fulvic acid and following the procedure above is also done and
a standard curve using amyl acetate (Fisher) is prepared. Finally a
non-acylated fulvic acid sample is dissolved in 95% ethanoi but not treated with the
hydroxylamine or ferric perchlorate reagents. This is done since there is some
absorbance by fulvic acid at a wavelength of 530 nm as used in the Rapport and
^lonzo method. The concentration of this control should be similar to the
^^'droxyl determination is extrapolated using the amyl acetate curve converting
equivalents of acyl ester to equivalents of hydroxyl. A net O.D. for the sample
is computed by subtracting the O.D. of the fulvic acid in ethanol only and the
O.D. of the processed, non-acylated fulvic acid control from the O.D. of the
acylated fulvic acid sample.
B) Phenolic Hydroxyls and Quinones
A similar detection method was used to determine both phenolic hydroxyls and
quinones. For phenolic determination, the most specific method of those tested
was that of Chrastil (1975) using 1 ml of a 1 mg/ml solution of fulvic acid in
water. These results were compared to those obtained using the Folin and Denis
phenol method. It was necessary to use a fulvic acid control of similar con¬
centration without the (NH^)^ Ce(N03)g added (Chrastil procedure) or the Folin
phenol reagent added (Folin method) read against a reagent blank, and
subtracting the 0.0. of this control from that of the sample to obtain a net
O.D. The results were extrapolated from a standard curve made using
(p-hydroxyphenyl) propionic acid (Allied Chemical).
For quinones the fulvic acid was first reduced by adding 1 ml of a 10 mg/ml
solution of NaBH, in 95% ethanol (Fisher Scientific Co.) to 1 ml of a 1 mg/ml
solution of fulvic acid, allowing to react for 30 min., then adding a few drops
of glacial acetic acid (Mallinckrodt; Paris, Ky.) to decompose any excess MaBH^.
Use the Chrastil Method for phenolic determination, computing a net O.D. as
before with a reduced fulvic acid control with no (NH^)2 Ce(N02)2 added, extra¬
polating from the same standard curve of (p-hydroxyphenyl) propionic acid and
converting phenolic hydroxyl equivalents to quinone equivalents. '
ͣ
This value is
Corrected by subtracting any phenolic hydroxyl found prior to reduction with
Primary Amines
Two independent methods were used for comparison. The first uses
fluoresca-mine (Roche Diagnostics; Nutley, M.J., ). Three mg of fluorescafluoresca-mine is
dissolved in 10 ml of acetone. A 0.05 M phosphate buffer is made at a pH of
8.0. Ethanolamine (Mew England Nuclear; Boston, MA) is used as a standard, 40
nm/ml.
To duplicate standards and samples (fulvic acid 0.1 mg/ml) of 0.5 ml add 1.0
ml of the phosphate buffer. While vortexing add 0.5 ml of the fluorescamine
solution. Let stand 30 minutes and read fluorescence in a fluorometer
(Perkin-Elmer MPF-361 with 5 nm slits, a 390 nm excitation wavelength and a 475
nm emmission wavelength. The fluorometer should be standardized with a quinine
solution and zeroed with the phosphate buffer. Fluorescence should be corrected
|ing a fluorescamine blank; however, no fulvic acid control is needed.
The other method described by Mokrasch (1967), uses 2,4,5-trinitro benzene
SLs"'fonic acid (Eastman; Rochester, N.Y.). Use 0.5 ml of a 1 mg/ml fulvic acid
solution following the aforementioned procedure. However, quench with ice-cold
88% formic acid (Baker Analysed rgt.) instead of methanol, reading against a
reagent blank at 366 nm. Mo standard is needed; instead use an extinction coef¬
ficient of 1.2 X 10 M~ cm" ' Mokrasch (1967). We checked this figure with an
Ethanolamine standard and calculated identical results. A fulvic acid control
is needed, using a similar fulvic acid concentration, without adding the
tri-nitrobenzene sulfonic acid. This is also read against a reagent blank and the
O.D. of the control is subtracted from that of the sample to obtain a net O.D.
Beer's Law (A = Ecb) is used [where A = absorbance (O.D),E= extinction
coef-J|icient, c = molar concentration, b = length of cell] to calculate the molar
VW Carbohydrates
For calculating bound carbohydrates two independent procedures were used.
The first is an Anthrone reaction by Shields and Burnett (1960) using 1 ml of a
1 mg/ml. Fulvic acid solution. Net O.D. is computed, subtracting from the
sample a fulvic acid control of similar concentration (no Anthrone rgt. added).
This net O.D. is converted to percent bound carbohydrate using a standard curve.
The second method using a-naphthol as described by Oische (1955), was com¬
pared to the first. It required 0.5 ml of a 1 mg/ml fulvic acid solution. An
appropriate curve was generated using a sucrose standard and net 0.0. of the
fulvic acid was once again corrected for with a fulvic acid control, of similar
8
;ULTS AND DISCUSSION
Table 1 shows the results for the various functional groups obtained from
the same fulvic acid sample. These results can be compared to results reported
for other fulvic and humic acids, see Gjessing (1976).
We believe one of the more interesting results obtained in our experimen¬
tation was the indetectably low level of phenolic -OH in our fulvic
acid sample using the Chrastil (1975) method. This differs from the
Folin-phenol reagent results, which were positive for Folin-phenolic hydroxyls. However it
is likely there are compounds in our fulvic acid sample which give a false posi¬
tive with the Folin-phenol reagent. Several potentially interfering compounds
are listed in papers by Folin and Denis, and Gutner and Holm. We believe
ben-zaldehydes are possible in our fulvic acid which could cause interference as
suggested by Folin and Denis. The procedure by Chrastil reportedly is much less
subject to false positives from interfering compounds. Furthermore our sample
showed positive results for quinones, which were reduced to phenolic hydroxyls,
when the Chrastil procedure was used. The addition of unreduced fulvic acid to
solutions of p-hydroxyphenyl propionic acid had no effect on the O.D. in the
Chrastil procedure.
The amine results showed excellent correlation between the two independent
methods used. This positive result for amines is helpful because fulvic acid
can now be easily "tagged" with radioactive or fluorescent functionalities.
Fluorescamine, for example, can be used for those purposes and is promising for
HPLC work.
The results for total hydroxyls was comparable to results obtained by
iwthods used. All our tests were designed so comparisons could be made readily
on different batches of fulvic acid without using much sample. This will
perhaps help those who are interested in batch to batch comparisons of various
10
'able 1. Results obtained for functional group determination of aquatic fulvic
acid from Singletary Lake, N.C.
Functional group
meq/gm fulvic acid
weight %
primary & secondary hydroxyls
phenolic hydroxyls
(Folin phenol rgt.)
phenolic hydroxyls (Chrastil)
quinones
primary amines (Fluorescamine)
primary amines
(2,4,6-trinitrobenzene sulfonate)
bound carbohydrate (Anthrone method)
bound carbohydrate (Oische)
2.75 ± 0.55 4.7 ± 0.9
0.9 1.5
negative
negative
(<5 X 10"^ eq./gm)
0.196 ± .004
-0.097 ± .006 0.16 ± 0.01
0.094 ± .005 0.15 ± 0.01
- 5.5 ± 0.7
11
" REFERENCES'
Butler J.H.A. and Ladd J.N. (1969) Eff<»ct of extractant and molecular size on
the optical and chemical properties of soil humic acid. Aust. J. Soil Res.
1_, 224-277.
Chrastil J. (1975) Colorimetric estimation of phenols and tyrosine. Anal. Chem.
47_ (13), 2293-2296.
Oische Z. (1955) New Color Reactions for Determination of Sugars, in
Polysaccharides, in Methods of Biochemical Analysis, Vol. II, D. Glick (Ed.),
Interscience, N.Y., pp. 313-358.
Dubach P. and Mehta N.C. (1963) The chemistry of soil humic substances. Soils
and Fertilizers 25, 293-300.
^Itantawy I.M. and Bauctez M. (1978) Structural study of humic acids by x-ray,
electron spin resonance, and infrared spectroscopy. Soil Sci. Soc. Amer. J.
42, 903-905.
Folin 0. and Denis W. (1912) On phosphotangstic-phosphomolybdic compounds as
color reagents. J. Biol. Chem. 7_ (2), 239-243.
Gjessing E.T. (1975) Physical and chemical characteristics of aquatic humus.
Ann Arbor Science, Inc., pp. 15-85.
Goh K.M. and Stivanson F.J. (1971) Comparison of infrared spectra of synthetic
and natural humic and fulvic acids. Soil Sci. 112, 392-400.
Gortner R.A. and Holm G.E. (1920) The colorimetric estimation of tyrosine by the
method of Folin and Denis. J. Biol. Chem. 40_, 1678-1692.
Haworth R.D. (1971) The chemical nature of humic acids. Soil Sci. HI. 71-79.
Jathur S.P. (1972) Infrared evidence of quinones in soil humus. Soil Sci. 113,
136-139.
coesti-12
fPlations of amines, amino acids and proteins in mixtures. Anal. Biochem 18,
64-71.
Petersen J.W., Hedberg K.W. and Christensen B.E. (1943) Microdetermination of
hydroxy 1 content of organic compounds. Ind. Eng. Chem. 15^, 225-226.
Rapport M.M. and Alonzo N. (1955) Photometric determination of fatty acids ester
groups in phospholipids. J. Biol. Chem. 217, 193-198.
Schnitzer M. and Gupta V.C. (1964) Some chemical characteristics of the organic
matter extracted from the 0 and BZ horizons of a gray wooded woil. Soil Sci.
Soc. Amer. Proc. 28, 374-377.
Schnitzer M. and Gupta V.C. (1965) Determination of acidity in soil organic
matter. Soil Sci. Soc. Amer. Proc. 29, 274-277.
Shields R. and Burnett W. (1960) Detrmination of protein bound carbohydrate in
^jserum by a modified an throne method. Anal. Chem. 32^ (7), 885-886.
Sipos S. and Sipos E. (1979) Infrared spectroscopic examination of humic acids.
Acta Physica Chemica 25, 187-193.
Thurman E.M. and Malcolm R.L. (1981) Preparative isolation of aquatic humic
substances. Environ. Sci. Techno!. 15 (4), 463-466.
Wagner G.H. and Stpvenson F.J. (1965) Structural arrangements of functional
groups in soil humic acid as revealed by infrared analysis. Soil Sci. Soc.
MICRODETERMINATION OF CARBOXYL GROUPS IN FULVIC ACID
AND RELATED POLYCARBOXYLATESby
Joseph Evans and Phillip W. Albro*
Laboratory of Molecular Biophysics
National Institute of Environmental Health Sciences
PO Box 12233Research Triangle Park, NC 27709
ABSTRACT
A radiochemical procedure was used to quantify carboxyl content of fulvic
acid. Tritium from tritiated water exchanged with carboxyl protons in fulvic
acid and were then locked into the fulvic acid structure by diazomethane
methy-lation. Liquid scintillation counting of the exchanged methylated fulvic acid
yielded quantifiable results using 100 microgram quantities of fulvic acid.
Values obtained were comparable within 2% to those-obtained a Ca(0Ac)2 titration
procedure for carboxyl determination requiring 50 milligrams of polycarboxylate.
IMTRQOUCTION
Humic and fulvic acids are defined as those organic components of natural
waters that are not extractable into organic solvents; the former precipitates
at pH 1 while the latter does not (1). During studies of the binding properties
of fulvic acid from different sources we found it necessary to compare small
batches as to carboxyl group content. Standard methods for this determination
exist (2,3), but require relatively large amounts of material (on the order of
50 mg, ref. 3). As the purification of even mg amounts of fulvic acid is time
consuming and tedious (1), we needed a method for carboxyl group determination
applicable to submilligram quantities of polycarboxylates. Since analyses for
phenolic hydroxyl groups (6) had indicated that our preparations of fulvic acid
were extremely low in this functionality, we decided to take advantage of the
characteristics of the diazomethane esterification reaction as a means of
radiochemical determination of carboxyl groups.
Diazomethane has been shown to introduce -CH-- groups into cyclic structures
of humic or fulvic acid (4). For this reason we could not use radiolabeled
diazomethane for carboxyl group determination. Preliminary experiments
involving proton nuclear magnetic resonance spectroscopy in D^O revealed that
essentially all of the protons in fulvic acid that were capable of exchanging
did so very rapidly, exchange being complete in less than 90 seconds. This
being the case, radioactivity could be introduced and "fixed" as described
MATERIALS AND METHODS
Fulvic acid used in our experiments was collected from Singletary Lake and
Black Lake, NC. It was isolated by the humics group at the University of North
Carolina, Chapel Hill. The isolation procedure used was as described by Thumian
and Malcolm (1).
a) Exchange; Esterification; Re-exchange
Start with duplicate samples containing 100 uQ of fulvic acid in 100 yl of
deionized water aliquoted into 0.5 dram glass vials. Benzene pentacarboxcylic
acid (Pfaltz and Bauer; Stanford, Conn.) was used as a separate reference stan¬
dard in each set of samples to correct for variations in dilution of ^h 0 by
moisture in the diethyl ftther as well as humidity in the air. The samples and
standards are placed in a vaccum desiccator over Drierite (CaSO., Hammond
Co.; Xenia, Ohio) and NaOH pellets (Allied Chemical; Morristown, NJ) until dry
(usually 24 hours).
To each of the dry samples and standards add 20 yl of ^H-O (activity used
2.49 x 10⁸ oPM/g, obtained from New England Nuclear, Boston, MA) and vortex.
Allow 2 minutes to assure complete exchange of tritium with hydrogen in the
samples and then add 1 ml of diazomethane in ether previously generated as
described by Fales et al. (5) using N-Methyl-N-nitro-N-nitrosoguanidine
(Aldrich; Milwaukee, WI). The vials are securely capped with a teflon lined
screw cap, and placed on a shaker for 1 hour.
Pure parafin (Gulfwax), 1 mg, is then added, only to the vials containing
benzene pentacarboxylic acid to prevent formation of a dry dust. The samples
and standards are dried at ZS^Z under a stream of N^ for 10-20 minutes. To the
vials vortexed, and standards as well as samples are put back in the vacuum
desiccator overnight. This step is repeated the following day.
b) Radioassay Procedure
To the dried samples and standards were added a few drops of methanol or
acetonitrile-methanol (1:1, v/v) to dissolve the solid residue. Each small vial
was then crushed, using a pair of pliers, inside a larger scintillation vial.
To these were added 15 ml of Riaflour (New England Nuclear; Boston, MA) and the
incorporated (non-exchangeable) tritium radioassayed using a liquid scin¬
tillation counter (Packard, Tri Carb 4530).
c) Calculation of Results
(1) The benzene pentacarboxcylic acid is used to determine the effective
specific activity of the tritiated water by the following method:
effective specific activity = equiv. C00CH2 3H counted
equiv. COOH originally present
eoulv COOCH ^H - ^^^'^ observed (benzene pentacarboxcylic acid)
DPM/g (Activity of 3h 0 used) x 18g/equiv. SH^O x Vl
*The specific activity per ^h is 1^^ that of 3h o hence the 1/2 used above.
rnnu - --,11 » 4. 9^^- bcnzenc pentacarboxcylic acid
equiv. COOH originally present =_______________________________________ x 5
298
*5 equiv. COOH per mol benzene pentacarboxcylic acid
**298 = F.W. of benzene pentacarboxcylic acid
(2) Equivalents of carboxyl in the fulvic acid samples is computed as
equiv. COOCH22H (counted in methylated fulvic acid)
effective specific activity
eauiv C00CH93H - ^^^ observed (methylated fulvic acid)
(counted in methylated DPM/g (Activity of ^h^O used) x 18g/ea. ^HJ) x V2.
fulvic acid)
(3) Equivalents of carboxyl per gram of fulvic acid is then computed.
equiv. COOH in sample
gm. of fulvic acid
(3a) To obtain a weight percent of carboxyl in fulvic acid
weight percent = (equiv. COOH/gm. of fulvic acid) x 45 x 100
*45 = F.W. of COOH
d) Control Experiments
To test the exchange of carboxyl protons with water we put a few milligrams
of benzene pentacarboxcylic acid into two separate MMR tubes and to one added
d^-DMSO (Merck, Sharp & Dohme; Kirkland, Que. Canada) and to the other 100% O2O
(Aldrich; Milwaukee, WI). Noting the time when we dissolved our standard in D„0
would allow us to determine how much time is required for a complete exchange of
hydrogen with deuterium by comparing the NMR spectra of both solutions. The NMR
spectrum of benzene pentacarboxcylic acid in dg DMSO would show no exchange with
deuterium while the D2O NMR spectrum examined at several different time points
^^ would show exchange with respect to time. Used for all NMR spectra was a
As indicated previously it is necessary to run a benzene pentacarboxcylic
acid standard with each set of samples to determine an effective specific acti¬
vity. To better understand why this varies from run to run we ran an experiment
using benzene pentacarboxcylic acid. We exchanged the protons with D2O instead
of ^H^O, methylated our standard, dried it, and dissolved it in dg-DMSO. By
comparing the NMR spectrum of this sample with a benzene pentacarboxcylic acid
sample that was methylated but not exchanged with D2O we could determine what
percentage of our methyl groups were -CH2D and if any -CH^ groups still
remained.
To evaluate the percentage esterification by our diazomethane methylation
procedure we methylated, as previously described, benzene pentacarboxcylic acid
samples and fulvic acid samples. These were dried, pressed into pellets with
KBr (Perkin Elmer; Norwalk Conn.) and infrared spectra were run on a Perkin
Elmer 1320 infrared spectrophotometer. These IR spectra were compared to those
of non-methylated benzene pentacarboxcylic acid and fulvic acid samples.
Fulvic acid contains exchangeable protons other than carboxyl. This is why
the re-exchange of tritium with hydrogen after methylation is necessary. To
test for complete re-exchange of protons with groups other than carboxyl we used
an hippuric acid (Fig. 2) standard which has an exchangeable proton attached to
a nitrogen, not subject to methylation under these conditions, as well as having
an exchangeable carboxyl proton. It was exchanged, methylated and re-exchanged
as described for fulvic acid and radioassayed with a standard benzene
pentacar-boxcylic acid sample for comparison.
Finally to compare our method of carboxyl determination with a more standard
^method we chose to run one sample of fulvic acid both by the present method and
RESULTS
The results of carboxyl determination by the tritium exchange procedure are
shown for different samples of fulvic acid in table 1. The comparison of the
results obtained for one sample of fulvic acid by the tritium exchange method
versus the Ca(0Ac)2 method (2) is shown in table 2. As shown in the table the
two separate methods gave similar results confirming the validity of our tritium
exchange procedure. The CaCOAc)^, method required 50 mg of fulvic acid. The
different samples of fulvic acid in table 1 were collected separately at various
times during the year and show some batch to batch variation.
When we examined the proton NMR spectra of the two samples of benzene
pen-tacarboxcylic acid dissolved in d^-DMSO and D„0 respectively, our sample in DMSO
showed two peaks as expected. The peak at 8.6 PPM (tetramethyl si lane
reference), reflected the single hydrogen on the benzene ring, and the other, a
rather broad peak at 13.7 PPM, represented the collection of the 5 hydrogens on
the carboxyl groups. The sample in O2O showed the peak at 8.6 PPM but no peak
at 13.7 PPM after only 11/2 minutes, indicating complete exchange of hydrogen by
deuterium on all 5 carboxyls. This confirmed the exchange was both rapid and
complete.
The NMR spectrum of the benzene pentacarboxcylic acid exchanged with 0^0 and
then methylated, compared with the spectrum of methylated, non-exchanged benzene
pentacarboxcylic acid clearly demonstrated the need to determine the "effective"
specific activity of the tritiated water for each batch of samples processed.
We knew from our previous results exchange is 100%; however as shown in Figure
1, since there is a slightly different shift for a -CH^D group from a
-CH- group, 78% of our exchanged standard was -CH^D while the remaining fraction
methylation. Evidently there is a variable dilution effect from run to run pro¬
bably dependent upon the humidity in the lab air or trace amounts of water in
the ether. This is why it is necessary to include a standard of known COOH com¬
position with each sample run.
Complete esterification of our fulvic acid and benzene pentacarboxcylic acid
was verified by infrared spectroscopy. The absence of any peak from 2650 to
2000 cm-^ (COOH region) in our methylated samples,-as was previously present in
our non-methylated samples, and the emergence of a large sharp peak at 1730 cm-^
(methyl ester carbonyl) in our methylated sample confirmed complete esterifica¬
tion in both the fulvic acid and benzene pentacarboxcylic acid (within the
limits of detection of infrared spectroscopy, roughly 3% -COOH detectable).
Finally, our control experiment using hippuric acid to test for the complete
re-exchange of tritium, other than carboxyl, gave results that correlated preci¬
sely with those recorded for benzene pentacarboxcylic acid. The effective fixa¬
tion of 3h in the methylated hippuric acid was 85.7% ± 1.7% and for benzene
pentacarboxcylic acid 84.2% ±2.5%. This confirmed the re-exchange procedure
was complete.
*Note due to limited space IR and NMR spectra are not included. They are
10
DISCUSSION
In performing this assay it is important to use quantities similar to those
stated. We found new problems occured when we scaled down or up from the pre¬
sented quantities. For example, 100% methylation of the fulvic acid is
achievable only when the diazomethane is available in excess, possibly because
of competing side reactions. Incomplete methylation was easily observable in
infrared spectra of samples containing too little diazomethane. The same
problem can occur if too much tritiated water is used, causing two phases, ether
and water. When this happens the fulvic acid remains in the water phase and the
diazomethane in the ether phase, hence incomplete methylation. Reaction time
and continuous shaking are also important to assure 100% methylation.
11
Table 1
COMPARISON OF CARBONYL CONTENT OF VARIOUS SAMPLES OF FULVIC ACID
Sample^
1 2 3 4mequiv COOfl
5.78 3.65 - 3.65gm. Fulvic Acid
±0.46 ±.16 4.00 ± .25 ±0.11
weight % 26 .0 ± 2. 1 15 .4 ± 0.7 18.0 ± 1.1 16.4 ± 0.5
Samples 1, 2 and 4 from Lake Singietary, sample 3 from Black Lake.
Table 2
COMPARISON, BY TWO INDEPENDENT METHODS OF CARBOXYL CONTENT
OF ONE FULVIC ACID SAMPLEFulvic Acid Sample 1
Method Tritium exchange
meguiv COOH 5.78 ±0.46
gm Fulvic Acid
weight % 26.0 ± 2.1 23.4 ± 0.6
Ca(0Ac)2
(4)
12
Figure 1: Proton NMR Spectroscopy of Native and D^O-exchanged Benzene
Pentacarboxylate. The peak area ratios indicated a 78% trapping of
2H in the methyl groups for this sample.
O
II
X-C-O-CH3
x, , Xg 3.88 ppm
X2 , X4 3.83 ppm
X3 3.81 ppm
O
I!
y-C-0
CH2D
y, , Vg 3.86 ppm
Comparison of IMMR peak areas at 3.86 ppm to 3.88 ppm showed
13
References
1. E.M. Thurman and R.L. Malcolm, Environ. Sci. Technol. 15, 463-466 (1981). .
2. M. Schnitzer and V.C. Gupta, Soil Sci. Soc. Amer. Proc. 39, 274-277 (1965).
3. L. Blom, L. Eddhauser and D.W. van Kreuelen, Feul 36, 135-153 (1957).
4. M. Schnitzer, Soil Sci. 117, 94-102 (1974).
5. H.M. Fales, T.M. Jaouni and J.F. Babashak, Anal. Chem. 45, 2302-2303 (1973)
4.0 BINDING OF NON-POLAR ORGANIC POLLUTANTS TO FULVIC ACID
4.1 INTRODUCTION
Presented In the final section of this report are experiments
Involving interactions of non-polar organic pollutants with Aldrich
and aquatic fulvlc acid. The pollutants which were used are
dimethyl phthalate (DMP), diethyl hexyl phthalate (DEHP),
2,3.7,8-TCDD (dioxin), DDT, and the herbicides, Amytryne and Prometone.
These organics were chosen because there was evidence indicating
that ail but one, Dioxin, could bind to fulvic acid (ref.1-5).
The original objective of this section was to determine binding
constants for some of these organics and determine the number of
possible binding sites on fulvic acid. For most of these compounds
little is known about the nature of the binding mechanism and
little evidence even exists to support binding to fulvic acid.
One report shows binding of phthalates to fulvic acid to be as
high as four moles of phthalate to one mole of fulvic acid (ref.2).
The binding mechanism was believed to be a combination of hydropho¬
bic interactions and H-bonds. The herbicides Ametryne and Prome¬
tone have also been shown to bind to fulvic acid (ref. 3). The
evidence showing binding of herbicides is greater than that for
phthalates and the mechanism (ion-exchange) is better known. Other
reports have also shown evidence of DDT binding (ref.4). To date no
DI ox in could bind also.
The binding studies previously sited have led to a general belief that fulvic acid can transport many non-polar organics
through the environment. This report however will question much of the evidence supporting binding or interactions of these compounds
with fulvic acid. Each experiment was done In a progressive order so more could be learned about binding and about the mechanisms
involved. DMP was used first because of Its reportedly high bind¬
ing affinity (ref.2) and because of Its water solubilIty. If a binding constant could be determined, at different concentrations of
pollutant and different concentrations of fulvic acid, more could be
learned about the mechanisms involved, if DMP binding proved successful, DEHP would be used in the same manor, helping to gain further insight into hydrophobic or H-bond binding mechanisms. As will be seen In section 4.3 neither of these compounds were found
to significantly bind to fulvic acid. DI ox in also showed no evi¬ dence of being able to bind.
The herbicides Ametryne and Prometone were used because more
was known about their binding properties and because neither
phthaiates nor DIoxin could be shown to bind to fulvic acid. The
results of herbicide binding proved to be Inconclusive because of the difficulty In detecting bound pollutant. This led to the use
of DDT as still another possible compound that could be used to
test the validity of the experimental method used to separate bound
and free pollutant (see section 4.2). These results left the
researcher with still more questions on the binding of certain
raises new questions on whether or not non-polar organic compounds can bind to fuivic acid and suggests that the medium used for transport of these pollutants in the environment may be something other than humic material,
4.2 MATERIALS AND METHODS
This section Includes the experimental conditions relating to various experiments on the binding of fuivic acid to non-polar organic pollutants. It Is divided into 13 sub-sections and each sub-section has a matching section in the results and discussion.
The experiments proceed in the order they were performed indicating
a logical sequence of events as new and often surprising evidence was gained at the conclusion of each experiment.
4.2.1 Binding af Dimethyl Phthalate fDMP) is Fuivic Acid;
Seo-Pal<. Procedure 1
Dimethyl phthalate (DMP) was used because of its water solubil¬
ity and because previous evidence indicated binding to fuivic acid
(ref.1,2). The solubility of DMP In water is very good for a
non-polar organic compound (approximately 4mg/mL) and previous research
had suggested the binding of DMP to fuivic acid to be as high as
four moles DMP to one mole fuivic acid (ref.2). It was thought
that if DMP binding could be quantitated, binding affinity could be 14
determined for fuivic acid. C labeled DMP (0.5 uCi/umol) was
diluted with unlabeled DMP (Aldrlch Chemical) to a concentration of approximately 3,500 DPMs/uL. This was done so an adequate amount of
Five glass test tubes were prepared as follows:
-Tubes 1,2,and 3 contained 2.9 mL deionized/dlstiI Ied water. Added
to each of these tubes was 1.8 uL DMP (2.14 mg or 11 umol) and the
tubes were then capped. The DMP was allowed to solubllize over a period of 48 hours of constant shal<lng.
-Next was added 0.1 mL of SIngletary Lal<e fulvlc acid (SL104)
obtained from the humics group at UNC-CH. ( Its concentration in
water was 5.1 mg/mL ). If DMP was to bind to fulvlc acid at an approximate ratio of 4 to 1 molar and if an average molecular
weight for fulvlc acid is assumed to be 1000 (ref.2) then approxim¬
ately 20% of the DMP added should bind to the fulvlc acid.
-This mixture was allowed to equilibrate for 24 hours.
Note: The 24 hour period stated for equilibrium In each experiment Is not always 24 hours. It can actually mean 24 to 72 hours.
There appeared to be no difference whether these equilibrations
were allowed to proceed for 24 or 72 hours therefore no distinction was made In the written experimental procedures.
-Tubes 4 and 5 were run along with tubes 1,2 and 3 as blank
controls. They were prepared similar to the other tubes however
they contained no fulvlc acid.
-Following equilibration NaHCO (0.01M) was used to pH each solut¬
ion to neutral (pH 7 to 8). At a neutral pH fulvlc acid had less
affinity for a C18 sep-pak cartridge. Further experimentation showed elutlon of fulvlc acid to be Incomplete and will be
discussed in later sections.
Note: The blank solutions were not pH'd.
-Five C18 sep-pak cartridges (Waters) were pre-wetted, per
mendation of the manufacturer, using 2 mL of methanol followed by 5
mL of de-ionized/distilled water. This step proved to be veryImportant.
-The solutions containing the 3 fulvic add samples and 2 blank
controls, were poured into 5 separate 5cc syringes which had been
previously attached to 5 respective sep-pak cartridges, labeled 1
through 5. The solutions were eluted at an approximate rate of 10
mL/min through the cartridges into 5 separate scintillation vials
also labeled 1 through 5. An additional 1 mL of
de-ionized/distilled water was passed through each sep-pak cartridge
Into the numbered scintillation vials. These were the water frac¬
tions of the respective solutions, (ref.5).
-Following this fraction were elutions of 3 mL of methanol followed
by ImL of methanol into 5 new scintillation vials. These elutions
were labeled as the organic fractions of the respective solutions. -Each sep-pak cartridge was broken open. Its contents dumped into 5 separate scintillation vials, and labeled as the sep-pak fractions
of solutions 1 through 5.
-There were In total 15 scintillation vials, to which 15 mL of Atomllght was added, shaken, and counted on a Packard liquid
scintillation counter three times for five minutes. Each five
minute count was then averaged and recorded as disintegrations per
minute (DPMs).4.2.2 Binding al Dimethyl Phthalate t^ Fulvic Acid
(Sep-Pak. Procedure I I)
To test whether varying the elution flow rate through the
fulvic acid, tliree different flow rates were tested while the
14
experimental conditions remained constant. C labeled DMP at a
concentration of approximately 28,000 DPM/uL was used adding only 1
uL (5.8 umoi) DMP per tube. The DMP concentration to fulvic acid
concentration was approximately 11 to 1 molar. If binding of DMP
to fulvic acid Is 4 to 1 molar, than 36% of the DMP (10,200 DPMs) ,
would theoretically bind to the 0.5 umoi of fulvic acid. (The DPM
concentration was increased to allow for easier detection.)Experimental conditions, except flow rate, were the same as section 4.2.1 and a total of 12 tubes were run. Six samples with fulvic acid (SL104), two tubes per flow rate tested (30mL/min, 10mL/min,and 1 mL/min), tubes 1,2; 3,4; and 5,6 respectively. Six blank tubes (no fulvic acid), were also run, tubes 7,8; 9,10; and
11,12 (30mL/min, 10ml/min, and ImL/min, respectively). Following
equilibration, pH, elution of the two fractions (water and
organic); the three fractions (water, organic and sep-pak
cartridge) were counted by liquid scintillation counting as in
section 4.2.1.
4.2.3 Binding q± Diethyl hexvl phthalate fPEHP) ia FuIvIc Acid. Sep-Pak Procedure
This experiment was intended to test binding affinity of DEHP
14
to fulvic acid. C labeled DEHP (10.7 uCi/umol) was diluted in
hexane and used at an approximate concentration of 17,000 DPMs/uL.
-Nine tubes were prepared. Tubes 1-3 were blank controls, tubes
4-6 were Singletary Lake fulvic acid (SL104) and tubes 7-9 were
Aldrich fulvic acid.)
-Each tube received 9 uL DEHP In hexane (4.87 umol DEHP) and was
then dried under N at 60 C to evaporate the organic solvent.
-After evaporation, 2.9 mL of de-ionized /distilled water were added
and the DEHP was allowed a few hours to solublllze. (DEHP is very insoluble in water and therefore only a small fraction wasexpected to dissolve.)
-Tubes 4 through 6 received 0.1 mL of fulvic acid (SL104) in water.
(0.46 mg fulvic acid with an average molecular weight of 1,000 is
0.46 umol)
-Tubes 7 through 9 received 0.1 ml of Aldrlch fulvic acid In water
(0.51 mg fulvic acid or 0.51 umol).
Note: The molar ratio of DEHP to fulvic add for tubes 4 through 9
was approximately 10 to 1, Binding was expected to be as high as 4
to 1 molar (ref.2), however, even if binding were only 1 to 1
molar, than 10% of the total DEHP added (15,000 DPMs) would bind to
fulvic acid. If a detection limit of a few hundred DPMs Is assumed
any significant binding could be detectable.
-All tubes were capped and allowed to equilibrate with gentle
agitation for 24 hours.-Tubes 4 through 9 were then pH'd to neutral with 0.01M NaCO . -All tubes were centrifuged for 15 minutes.
-After centrifugatIon the contents of each tube was pipetted, one
by one. Into a 5cc syringe and passed through a pre-wetted CI8
sep-pak cartridge. This first elution was followed by 1 ml
de-ionized/distI I led water. These two elutions were combined and labeled as the water fraction.