High-frequency hearing loss is by far the most common audiometric configuration found in individuals fitted with hearing instruments (Nyffeler, 2008), and high-frequency amplification plays an important role in speech understanding (Glista & McDermott, 2008). However, speech comprehension is not the only ability adversely affected by high-frequency hearing loss. Music and lyrics can be difficult to detect or identify as well (Glista & McDermott, 2008), which is problematic as music enhances one’s quality of life. While enjoyment is certainly one of its main purposes, music also serves as a medium that models social structures, facilitates the acquisition of social competence by young people, and provides human interaction (Cross, 2006).
Some people may not know that they have cochlear dead regions, and perceive high-frequency amplification as distorted or noise-like in quality (Munro, 2007; Vestergaard, 2003). Frequency-discrimination measurements also suggest that frequency tones falling in a dead region do not evoke a clear pitch or may have an abnormal timbre (McDermott & Dean, 2000). Individuals with a cochlear dead region may therefore have different frequency-gain requirements from those without a dead region. Diagnosis of the presence and extent of a dead region may have important clinical implications for candidature for and benefit from amplification (Cairns, Frith, Munro & Moore, 2007), counselling and hearing instrument selection (Munro, 2007).
Many researchers have suggested the possibility of frequency lowering as a means of making speech sounds audible for patients with dead regions (Moore, 2009; Bagatto, Scollie, Glista, Parsa & Seewald, 2008; Moore & Alcantara, 2001). Various research projects have therefore been conducted with frequency-lowering hearing instruments that focused on improved speech perception (Kuk, Keenan, Korhonen & Lau, 2009; Stuermann, 2009; Bagatto et al., 2008; Robinson, Baer & Moore, 2007; Simpson, Hersbach & McDermott, 2006; Simpson, Hersbach & McDermott, 2005; Turner & Hurtig, 1999). An integral
part of people’s daily lives consists of listening to music and other non-speech sounds, and currently there are no studies to indicate what the
influence of frequency lowering on music perception is (Bagatto et al.,
2008).
The majority of people wearing hearing instruments complain of the reduced sound quality of music heard through them (Chasin, 2003). This may be due to the fact that most hearing instruments are designed with the focus on hearing speech and not music, which is problematic
as there are several main differences between music and speech.1
Furthermore, more and more people with hearing loss are expressing an equal need for their hearing instruments to be fitted optimally for listening to music (Chasin, 2004), and concern about the fidelity of music processed by hearing instruments has emerged. The escalating interest in musical perception accuracy and enjoyment is also reflected in publications of a variety of investigations utilising different experiments to assess performance on musical tasks (Cooper, Tobey & Loizou, 2008; Fujita & Ito, 1999; Gfeller, Olszewski, Rychener, Sena, Knutson, Witt & Macpherson, 2005; Gfeller, Turner, Mehr, Woodworth, Fearn, Knutson, Witt & Stordahl, 2002; Gfeller, Woodworth, Robin, Witt & Knutson, 1997; Gfeller & Lansing, 1991; Looi, McDermott, McKay & Hickson, 2008; Nimmons et al., 2008; Spitzer, Mancuso & Cheng, 2008).2
Almost all of the abovementioned research focuses on music perception in persons with cochlear implants. This began by adapting the Primary Measures of Music Audition test and developing the Musical Excerpt 1 The differences between music and speech are described in detail by Chasin (2010), as well as Chasin and Russo (2004).
2 Reasons why these tests were not used in the current study include: most of them were developed for assessment of music perception in cochlear implantees, only addressed limited areas of musical perception, stimuli included melodies familiar to the American, Australian, Asian or European cultures, they were lengthy tests that require trained musical personnel to code the responses, or they were computerised, which can be problematic for everyday use in the South African context because of limited resources and facilities.
Development of a music perception test for adult hearing-aid
users
Marinda Uys
Department of Communication Pathology, University of Pretoria Catherine van Dijk
Department of Communication Pathology, University of Pretoria; Ear Institute, Queenswood, Pretoria Correspondence to: M Uys (marinda.uys@gmail.com)
ABSTRACT
The purpose of this research was twofold: firstly, to develop a music perception test (MPT) for hearing-aid users, and secondly, to evaluate the influence of non-linear frequency compression (NFC) on music perception with the use of the self-compiled test. This article focuses on the description of the development and validation of the MPT. To date, the main direction in frequency-lowering hearing-aid studies has been in relation to speech perception abilities. As hearing-aid technology has improved, interest has grown in musical perception as a dimension that could improve hearing-aid users’ quality of life. The MPT was designed to evaluate different aspects of rhythm, timbre, pitch and melody. The development of the MPT could be described as design-based. Phase 1 of the study included test development and recording, while phase
2 entailed presentation of stimuli to normal hearing listeners (n=15) and hearing-aid users (n=4). Based on the findings of phase 2, item
analysis was performed to eliminate or change stimuli that resulted in high error rates. During phase 3 the adapted version of the test was
performed on a smaller group of normal hearing listeners (n=4) and 20 hearing-aid users. Results proved that adults with normal hearing as
well as adults using hearing aids were able to complete all the sub-tests of the MPT, although hearing-aid users scored lower on the various sub-tests than normal hearing listeners. For the rhythm section of the MPT normal hearing listeners scored on average 93.8% versus 75.5% of hearing-aid users; for the timbre section the scores were 83% versus 62.3% respectively. Normal hearing listeners obtained an average score of 86.3% for the pitch section and 88.2% for the melody section, compared with the 70.8% and 61.9% respectively obtained by hearing-aid users. This implies that the MPT can be used successfully for assessment of music perception in hearing-aid users within the South African context and may therefore result in more effective hearing-aid fittings taking place. The test can be used as a counselling tool to assist audiologists and patients in understanding the problems they experience regarding music perception, and might be used for future musical training in areas where participants experience problems in customising individual fittings.
Recognition test (Gfeller et al., 2005; Gfeller et al., 1997; Gfeller & Lansing, 1991). Many other groups have also assembled in-house tests to evaluate cochlear implant strategies and designs developed by their laboratories (Kong, Stickney & Zeng, 2005). The instruments used in these studies were designed to address specific research questions regarding perception of different structural features of music. The methods used were often similar, but they were not intended to be standardised tests and it is therefore not possible to directly compare
results across laboratories (Nimmons et al., 2008). Furthermore, most
of these tests were developed to examine the music perception skills of persons with cochlear implants and were therefore not applicable to the evaluation of persons using hearing aids. Not only is the technology for music as input to hearing aids still in its infancy, but the research and clinical knowledge of what music lovers need to hear is also still in its early stages of understanding; more research is required in this area (Chasin & Russo, 2004).
Music is highly complex (Leal et al., 2003) and therefore music
perception by persons wearing hearing aids is difficult to assess. A basic observation of music psychology is that listening to music may give rise to a large variety of experiences that are based on highly interrelated emotional and cognitive processes in the brain (Kreutz, Schubert & Mitchell, 2008; Iakovides, Iliadou, Bizeli, Kaprinis, Fountoulakis & Kaprinis, 2004). For example, one individual’s deepest appreciation may be based on the structural features of a musical work, whereas for another the emotional content of a piece of music may elicit strong experiences. The possibility arises that music processing depends on cognitive styles that vary between individuals, as well as numerous participative factors that influence enjoyment, including personal preferences for musical genres and the situational context, such as the listening environment and the listener’s mood (Kreutz et al., 2008;
Nimmons et al., 2008). The effect of temporal context in music – what
was played before and what is about to be played – influences a listener’s experience. An identical physical stimulus may be perceived differently, depending on the context; therefore, music perception is a dynamic, time-dependent process. These participative factors mentioned above may all greatly affect music perception and thereby render it difficult to measure.
Furthermore, no standard test of music perception exists (Wessel, Fitz, Battenberg, Schmeder & Edwards, 2007) and the few music perception tests that are available on the market are advanced and designed to examine the skills of individuals with formal musical training (Don, Schellenberg & Rourke, 1999). Previous studies (Gfeller et al., 2005; Gfeller et al., 2002; Gfeller et al., 1997; Gfeller & Lansing, 1991) confirmed the difficulty of assessing musical perception and highlighted the need for a clinically relevant measure of musical recognition and performance (Spitzer et al., 2008). Therefore, in order to determine the music perception of hearing-aid users, the MPT for the assessment of music perception in adult hearing-aid users was compiled.
Method
Aims
The main aim of the study was to determine the test performance of adults presenting with normal hearing and those presenting with a moderate to severe hearing loss, wearing hearing instruments on the self-compiled MPT.
This aim was accomplished by means of the following secondary aims in order to ensure that the MPT is suitable for assessment of music perception in hearing-aid users:
• to evaluate the performance of adults presenting with normal
hearing on the pilot (phase 2) and revised (phase 3) versions of the MPT
• to evaluate the performance of adults presenting with a moderate
to severe hearing loss who are wearing hearing aids on the pilot and revised versions of the MPT
• to compare the results obtained from adults with normal hearing
with those of adults wearing hearing aids.
Study design
To develop a measurement tool for music perception of hearing aid users, three study phases were planned. In phase 1, test developing and recording of the MPT took place and can be described as design-based. Although this paradigm is mostly applied to educational contexts (Barab & Squire, 2004), it provides a suitable framework for this phase, which involved the design of a test. The principles of this approach were applied by using theoretical knowledge and literature to compile test material potentially suitable for the assessment of music perception in South African adults with hearing loss. Phases 2 and 3 can be described as quantitative with a quasi-experimental design. During phase 2, trials with normal hearing participants and a small group of hearing-aid users were performed, followed by item analysis to eliminate or change items that had high error rates. In phase 3, the adapted version of the MPT was administered to a smaller group of participants with normal hearing and 20 hearing-aid users for final analysis of test items. This was done in order to improve the validity and reliability of the test.
Ethical aspects
Ethical clearance for this study was obtained from the institutions involved. As the underlying foundation of ethical research is to preserve and protect the human dignity and rights of all the participants participating in a research study (Jenkins, Price & Starker, 2003), the ethical principles of autonomy, beneficence and justice were adhered to (Leedy & Ormrod, 2005).
Participants
The researcher made use of a purposive convenient sampling method where participants were chosen on the basis of accessibility and because they articulated with the aims of the study (Babbie, 2005). The 15 normal hearing adults who participated in phase 2 and the 4 normal hearing adults who participated in phase 3 met the following criteria:
• bilateral hearing thresholds for octave frequencies between 125 Hz
and 8000 Hz at 20 dB HL or better (Van Deun et al., 2009)
• English language proficiency and literacy
• South African citizens
• no minimal musical background or experience level was required.
Participants were however asked to indicate if they had any formal musical training.
The mean age of the normal hearing persons who participated in phases 2 and 3 was 39.5 years (range 22 to 64 years). Only 4 of the adults included in phase 2 had formal musical training, while 1 adult included in phase 3 indicated this. The length of musical training received by these adults ranged between 2 and 7 years (phase 2: 4 years, 2 years, 3 years and 2 years; phase 3: 7 years).
It was important to verify the music test initially with a group of normal hearing listeners to ensure that the test was appropriate for administration with participants with hearing loss (Looi et al., 2008). To demonstrate the feasibility of this test for clinical application, persons with hearing instruments were recruited for phase 2 and phase 3. The hearing-aid users who participated in phase 2 (n=4) and phase 3 (n=20) met the following criteria:
• bilateral, moderate to severe sensory neural hearing loss, with a
pure tone average of 41 - 90 dB at the frequencies 500 Hz, 1000 Hz and 2000 Hz (Plante & Beeson, 1999)
• current digital hearing instrument use. Hearing instruments were
verified electro-acoustically to ensure that they were working properly and real-ear measurements were done to ensure that hearing instruments were optimised to reflect the current best practice (Auriemmo et al., 2009)
• English language proficiency and literacy
• South African citizens
• no minimal musical background or experience level was required.
Participants were, however, asked to indicate if they had any formal musical training.
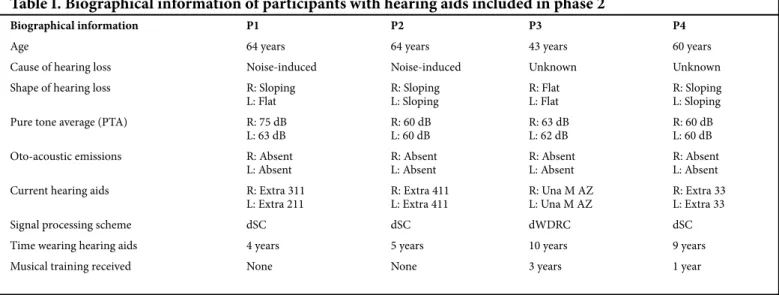
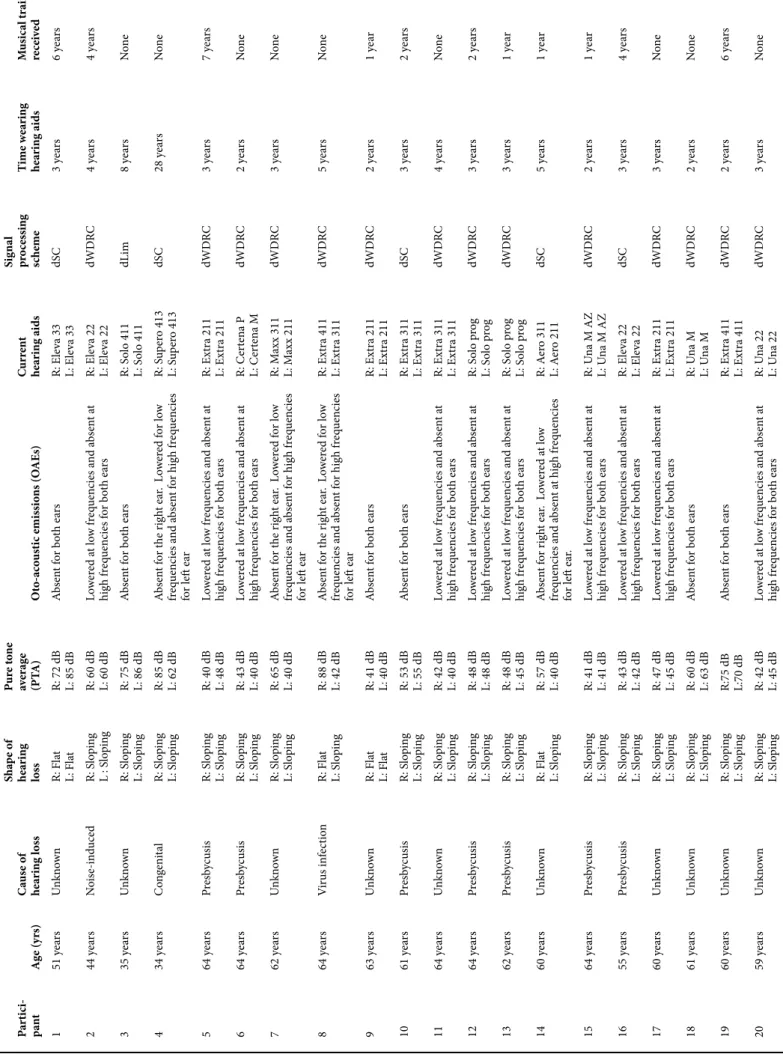
Tables I and II provide the biographical information on hearing-aid users in phases 2 and 3, respectively.
The average age for hearing-aid users in phase 2 was 57.8 years (range 43 - 64 years) and for participants in phase 3 57.5 years (range 34 - 64 years). All participants had a post-lingual onset of hearing loss and were evaluated with their current hearing aids on an omnidirectional microphone setting with the noise-cancellers inactive.
Procedures
The following sections provide detail about the test development and procedures followed.
Test development: phase 1
As several subjective factors3 can affect music perception, the MPT
was designed to focus on the objective characteristics of music, which can be described in terms of physical parameters of the acoustic signal (Nimmons et al., 2008). Therefore, structural features of music (rhythm, timbre, pitch and melody) were included. The researcher, in consultation with sound engineers and musicians, generated a list of musical stimuli for the different categories of the test. Specific components were selected based on existing literature (Gfeller et al., 2005; Gfeller et al., 2002; Gfeller et al., 1997; Gfeller & Lansing, 1991) as well as consensus between the audiologist, sound engineers and musicians. In order to optimise the reliability and validity of the MPT, the following aspects were implemented during development of the test:
• A thorough study of previous music perception tests and
experiments described in the literature was conducted.
• The MPT recordings were of a high quality, as the test was
recorded in a professional music studio by professional musicians and sound engineers.
• Wherever possible, the stimuli have been recorded to give a range
from gross differences to very subtle changes. This is important, as differences in musical stimuli can be so subtle that many normal hearing listeners might be stretched to recognise them (Medel Medical Electronics, 2006).
• Piano tones were used where applicable for stimuli, as piano tones
are more commonly available in music. Because of their ecological validity, they are typically used in music perception tasks (Cooper
et al., 2008).
• A calibration tone was inserted at the beginning of the recording,
and an alerting phrase, ‘Are you ready?’ was inserted prior to each sub-test. Recognising that music is highly variable in intensity, effort was made to maintain a minimum intensity level within 10 dB of the calibration tone.
• Recordings were consistent in terms of characteristics. If the
duration of a given excerpt is long, it is likely that its timbral and spatial characteristics will vary in time and listeners might find it difficult to ‘average’ the quality over time and some random errors 3 Including aspects such as personal preferences for musical genres, the listening environment and the listener’s mood (Kreutz et al., 2008, p. 57).
may occur (Zielinski, Rumsey & Bech, 2008). Short and consistent stimuli were therefore used in the MPT.
• The issue of familiarity with test stimuli was taken into
account. Careful attention must be given to this aspect, as a person’s unfamiliarity with test items can be the cause of poor performance. This aspect was addressed in the current study by including melodies that are heard by people in everyday life, and are therefore familiar to persons who have had little or no musical training. Furthermore, participants were given the opportunity to indicate their familiarity with all the melodies included in the test before the actual testing took place. Items with which participants were unfamiliar were not included in the analysis of results.
Categories
The following categories were included in the MPT:
Section A: Rhythm
Rhythm identification (sub-test 1). Five groups (1 second 768 milliseconds (ms) in length each) consisting of five pulse tones (43 ms in length), spaced 369 ms apart from one another, except for two pulses which are grouped together with a space of 32 ms in between, were included. Pulse tones did not differ in frequency. Five different group patterns were used, each differentiated by the position of the short inter-pulse interval. The first group of rhythmical patterns started with close spacing of the tones at the beginning of the group. In the second group, two of the tones were closely spaced at the second pulse tone and the same pattern was followed for the remaining groups. Figure 1 shows the visual presentation of the short interpulse interval at position four. Participants received a visual representation of the different patterns on the answer sheet. Only ONE of the five groups was randomly played for each test item, and participants were asked to identify which group they heard. To register their response, they marked an x beneath the visual representation similar to the item heard.
Rhythm discrimination (sub-test 2). This sub-test determined participants’ ability to distinguish temporal rhythms and evaluate changes in duration of notes by presenting twelve pairs of short rhythmic pulse patterns separated by 5 seconds of silence. All pulses were presented at the same frequency (B6 (+4 cents)/3 959.8 Hz and the patterns were spaced 1.5 seconds apart. The short pulses ranged from 130 ms to 167 ms, the medium-length pulses from 252 ms to 457 ms and the long pulses from 500 ms to 752 ms. The amplitude for the loud pulses was -25.4 dB and for the soft pulses -30.4 dB. After listening to each pair in turn, participants had to indicate on the answer sheet whether a pair of rhythm patterns was the same or different by marking ‘yes’ if they were the same or ‘no’ if they were different.
Rhythm recognition (sub-test 3). Participants were presented with twelve melodies in various key signatures, which were rhythmically
Table I. Biographical information of participants with hearing aids included in phase 2
Biographical information P1 P2 P 3 P 4
Age 64 years 64 years 43 years 60 years Cause of hearing loss Noise-induced Noise-induced Unknown Unknown Shape of hearing loss R: Sloping
L: Flat R: SlopingL: Sloping R: FlatL: Flat R: SlopingL: Sloping Pure tone average (PTA) R: 75 dB
L: 63 dB R: 60 dBL: 60 dB R: 63 dBL: 62 dB R: 60 dBL: 60 dB Oto-acoustic emissions R: Absent
L: Absent R: AbsentL: Absent R: AbsentL: Absent R: AbsentL: Absent Current hearing aids R: Extra 311
L: Extra 211 R: Extra 411L: Extra 411 R: Una M AZL: Una M AZ R: Extra 33L: Extra 33 Signal processing scheme dSC dSC dWDRC dSC Time wearing hearing aids 4 years 5 years 10 years 9 years Musical training received None None 3 years 1 year
Table II. Biographical information of the hearing-aid users who participated in phase 3
Par tic i-pa nt A ge (y rs) Ca us e o f he arin g l oss Sha pe o f he arin g loss Pur e t one av er age (PT A) O to-ac ous tic e miss io ns (O AE s) Cu rre nt he arin g a ids Sig na l pr oc ess in g sche me Time w ea rin g he arin g a ids M us ic al t ra inin g rec ei ved 1 51 y ea rs Un kn ow n R: Fl at L: Fl atR: 72 dB L: 85 dB
Abs en t f or b ot h e ar s R: E le va 33 L: E le va 33 dSC 3 y ea rs 6 y ea rs 2 44 y ea rs N oi se-in duce d R: S lo pin g
L : S
lo
pin
g
R: 60 dB L: 60 dB
Lo w er ed a t lo w f re quen cies a nd a bs en t a t hig h f re quen cies f or b ot h e ar s R: E le va 22 L: E le va 22 dWD RC 4 y ea rs 4 y ea rs 3 35 y ea rs Un kn ow n R: S lo pin g L: S lo pin g
R: 75 dB L: 86 dB
Abs en t f or b ot h e ar s R: S olo 411 L: S olo 411 dL im 8 y ea rs No ne 4 34 y ea rs C on ge nit al R: S lo pin g L: S lo pin g
R: 85 dB L: 62 dB
Abs en t f or t he r ig ht e ar
. L
ow er ed f or lo w fre quen cies a nd a bs en t f or hig h f re quen cies fo
r left e
ar R: S up er o 413 L: S up er o 413 dSC 28 y ea rs No ne 5 64 y ea rs Pr esb yc usi s R: S lo pin g L: S lo pin g
R: 40 dB L: 48 dB
Lo w er ed a t lo w f re quen cies a nd a bs en t a t hig h f re quen cies f or b ot h e ar s R: E xt ra 211 L: E xt ra 211 dWD RC 3 y ea rs 7 y ea rs 6 64 y ea rs Pr esb yc usi s R: S lo pin g L: S lo pin g
R: 43 dB L: 40 dB
Lo w er ed a t lo w f re quen cies a nd a bs en t a t hig h f re quen cies f or b ot h e ar s R: C er ten a P L: C er ten a M dWD RC 2 y ea rs No ne 7 62 y ea rs Un kn ow n R: S lo pin g L: S lo pin g
R: 65 dB L: 40 dB
Abs en t f or t he r ig ht e ar
. L
ow er ed f or lo w fre quen cies a nd a bs en t f or hig h f re quen cies fo
r left e
ar R: M axx 311 L: M axx 211 dWD RC 3 y ea rs No ne 8 64 y ea rs Vir us inf ec tio n R: Fl at L: S lo pin g
R: 88 dB L: 42 dB
Abs en t f or t he r ig ht e ar
. L
ow er ed f or lo w fre quen cies a nd a bs en t f or hig h f re quen cies fo
r left e
ar R: E xt ra 411 L: E xt ra 311 dWD RC 5 y ea rs No ne 9 63 y ea rs Un kn ow n R: Fl at L: Fl at
R: 41 dB L: 40 dB
Abs en t f or b ot h e ar s R: E xt ra 211 L: E xt ra 211 dWD RC 2 y ea rs 1 y ea r 10 61 y ea rs Pr esb yc usi s R: S lo pin g L: S lo pin g
R: 53 dB L: 55 dB
Abs en t f or b ot h e ar s R: E xt ra 311 L: E xt ra 311 dSC 3 y ea rs 2 y ea rs 11 64 y ea rs Un kn ow n R: S lo pin g L: S lo pin g
R: 42 dB L: 40 dB
Lo w er ed a t lo w f re quen cies a nd a bs en t a t hig h f re quen cies f or b ot h e ar s R: E xt ra 311 L: E xt ra 311 dWD RC 4 y ea rs No ne 12 64 y ea rs Pr esb yc usi s R: S lo pin g L: S lo pin g
R: 48 dB L: 48 dB
Lo w er ed a t lo w f re quen cies a nd a bs en t a t hig h f re quen cies f or b ot h e ar s R: S olo p rog L: S olo p rog dWD RC 3 y ea rs 2 y ea rs 13 62 y ea rs Pr esb yc usi s R: S lo pin g L: S lo pin g
R: 48 dB L: 45 dB
Lo w er ed a t lo w f re quen cies a nd a bs en t a t hig h f re quen cies f or b ot h e ar s R: S olo p rog L: S olo p rog dWD RC 3 y ea rs 1 y ea r 14 60 y ea rs Un kn ow n R: Fl at L: S lo pin g
R: 57 dB L: 40 dB
Abs en t f or r ig ht e ar
. L
ow er ed a t lo w fre quen cies a nd a bs en t a t hig h f re quen cies fo
r left e
ar . R: A er o 311 L: A er o 211 dSC 5 y ea rs 1 y ea r 15 64 y ea rs Pr esb yc usi s R: S lo pin g L: S lo pin g
R: 41 dB L: 41 dB
Lo w er ed a t lo w f re quen cies a nd a bs en t a t hig h f re quen cies f or b ot h e ar s R: U
na M AZ
L: U
na M AZ
dWD RC 2 y ea rs 1 y ea r 16 55 y ea rs Pr esb yc usi s R: S lo pin g L: S lo pin g
R: 43 dB L: 42 dB
Lo w er ed a t lo w f re quen cies a nd a bs en t a t hig h f re quen cies f or b ot h e ar s R: E le va 22 L: E le va 22 dSC 3 y ea rs 4 y ea rs 17 60 y ea rs Un kn ow n R: S lo pin g L: S lo pin g
R: 47 dB L: 45 dB
Lo w er ed a t lo w f re quen cies a nd a bs en t a t hig h f re quen cies f or b ot h e ar s R: E xt ra 211 L: E xt ra 211 dWD RC 3 y ea rs No ne 18 61 y ea rs Un kn ow n R: S lo pin g L: S lo pin g
R: 60 dB L: 63 dB
Abs en t f or b ot h e ar s R: U na M L: U na M dWD RC 2 y ea rs No ne 19 60 y ea rs Un kn ow n R: S lo pin g L: S lo pin g
R:75 dB L:70 dB
Abs en t f or b ot h e ar s R: E xt ra 411 L: E xt ra 411 dWD RC 2 y ea rs 6 y ea rs 20 59 y ea rs Un kn ow n R: S lo pin g L: S lo pin g
R: 42 dB L: 45 dB
Lo w er ed a t lo w f re quen cies a nd a bs en t a t hig h f re quen cies f or b ot h e ar s R: U na 22 L: U na 22 dWD RC 3 y ea rs No ne
structured as either a waltz (melodic pattern in triple meter) or a march (melodic pattern in duple meter). Melodies used in this sub-test were specifically composed for this test and had sufficient complexity to guarantee processing as a meaningful structure rather than as a simple sequence of notes. Rhythmical patterns were varied across melodies and the tempos used varied across 100, 120, 150, 180 and 200 beats per minute. The melodies consisted of between 8 and 14 notes and were played on a piano between D4/293.7 Hz and A6/1760 Hz. A second track with rhythmical chords played on an electric piano was added to assist with the indication of the time signature (4/4 or 3/4). There was 5 seconds of silence after each melody. Participants had to indicate whether the item they heard was rhythmically structured as a waltz or a march by marking an x next to the applicable answer on the answer sheet.
Rhythm perception (sub-test 4). Participants were presented with twelve pairs of melodic sequences. In each pair, either the first or the second melody was played rhythmically out of time, i.e. was not musically rhythmical. Melodies were played on a piano with a frequency range of C5/523.3 Hz - G#6/1661 Hz. Both 4/4 and 3/4 time signatures were used and melodies were in various key signatures. The tempo range for the melodies was between 100 and 150 beats per minute. The melodies in each pair were spaced 1.5 seconds apart, with 5 seconds of silence after each pair. Participants were required to indicate which melodic sequence was played rhythmically in time by selecting ‘First’, ‘Second’ or ‘Both’ on the answer sheet.
Section B: Timbre
The timbral stimuli used in sub-test 5 (parts 1 and 2) included eight different musical instruments that are commonly known to non-musicians, represent different fundamental frequency ranges and represent different instrumental families based on the principles of sound production (Gfeller, Witt, Adamek, Mehr, Rogers, Stordahl & Ringgenberg, 2002).
The trumpet (medium) and trombone (low) represented the brass
family and the piccolo flute (high), clarinet (medium), and saxophone (low) represented the woodwind family. The string instruments were represented by the violin (high) and cello (low). Pitched percussion
was represented by the piano, which was played in two different frequency ranges (medium and high). Both of these ranges are equally characteristic for the piano (Gfeller et al., 2002). The melodic pattern played by each instrument was composed specifically for use in this test. It consisted of a short melodic piece played by each instrument in C major at a tempo of 100 beats per minute. The melody consisted of seven quarter-notes, each of equal duration.
To ensure that identification abilities were being assessed, and not musical knowledge, each participant’s familiarity with the instruments was verified before testing (Looi et al., 2008). Participants were given a picture of each instrument accompanied by the instrument’s name. They were instructed to mark all the instruments they know by sound before the onset of the test. Although instruments were chosen that were considered well known to the general public, musical training and experiences differ considerably across the general population (Gfeller et
al., 2002). It is therefore possible that a person may be unfamiliar with one of the instruments included in the test. Those instruments that were not known by an individual, as determined during this preliminary step, were accounted for in the analysis of the data.
Timbre identification – part 1 (sub-test 5). A melodic pattern was played by each instrument mentioned above. Each of the instruments was presented twice in its characteristic frequency range. The only exception was the piano, which was presented once in the medium- and once in the high-frequency range. After completion of the practice items, instruments were played in random order for identification. Sufficient time was given for the individual to name the instrument that he/she thought produced the sound just heard. Test results were reported as percentages correct of those instruments known by sound as indicated in the preliminary step.
Timbre identification – part 2 (sub-test 5): This task extended the investigation of timbre perception beyond the single instrument identification task. The additional instruments present in this sub-test added to the complexity of the sound. This sub-sub-test consisted of 16 ensembles, where different combinations of the same instruments as in the previous sub-test played the same melodic piece in unison. Participants were asked to identify which of these instruments were playing together in each item. They had to rely on the timbre qualities of each instrument to identify them in the ensemble. Instruments were panned to various positions (from left to right) in the stereo field to help the participants in identifying them. A maximum of three and a minimum of two instruments played together. To minimise any unwanted effects of loudness cues, the levels of the four extracts of each instrument or ensemble were randomised over a 6 dB range below the participant-determined comfortable loudness level. Test results were again reported as percentage correct of those instruments known by sound as indicated in the preliminary step.
Number of instruments (sub-test 6). This sub-test determined how many different instruments participants could distinguish in a short piece of music. Participants were presented with five different instruments (cello, piccolo flute, snare drum, trumpet and xylophone) selected to have timbres as different as possible. They heard a short solo excerpt from a musical piece composed specifically for this test, played by each instrument before the onset of the actual test. Eight variations of the full piece of music (17.5 seconds in duration) played by a selection of the instruments were presented to the participants. They were asked to identify how many instruments were playing together by relying on the timbre quality and character of each instrument. Participants were required to write down the number of instruments they thought played together for each item on the answer sheet provided.
Section C: Pitch
Pitch identification (sub-test 7). This task included discrimination of complex pitch direction change. Participants were presented with pairs of two tones each, generated by a combined SawSquare wave which had been shaped by a filter to produce a synthetic tone close to that of a piano. The tones had identical spectral envelopes derived from a recorded piano note at middle C and uniform synthetic temporal
envelopes to eliminate any temporal envelope cues that might be present. Each tone had a duration of 934 ms. Each pair consisted of a base tone of F#4/370 Hz, C3/130.8 Hz, E3/164.8 Hz or G3/196 Hz. A second tone ranging between D4/293.7 Hz and G5/784 Hz, followed after 1.5 seconds of silence and was either higher or lower than the base tone, in a range of one semitone to 12 semitones. On each presentation, a tone at the reference frequency and a higher/lower-pitched tone were played in random order. Participants had to identify whether the second tone was higher or lower than the base tone. Each pair was separated by 5 seconds of silence.
Pitch discrimination (sub-test 8). This sub-test determined participants’ ability to distinguish differences between pitch. Participants were presented with 12 pairs of short melodic sequences (2 - 5 notes). The melodies were played on a piano in a range of C5/523.3 Hz - A7/3520 Hz at a tempo of 80 beats per minute. The item pairs have equivalent rhythmic patterns; however, those item pairs that are ‘different’ varied on one or more notes in frequency. The differences within the pairs varied from gross differences to extremely subtle differences where only a single note was flattened. The melodies in each pair were separated by 2.5 seconds of silence. Each pair was separated by 5 seconds of silence. Participants were asked to indicate whether the melodic sequences in each pair were the same or different by selecting ‘Yes’ if they were the same or ‘No’ if they were different.
Section D: Melody
Musicality perception (sub-test 9). Participants were presented with 12 pairs of short melodic sequences (2 - 4 bars long). The melodies were played on a piano in a range of C#5/554.4 Hz - B6/1976 Hz at tempos ranging from 90 to 160 beats per minute. Melodies were played in various key and time signatures (4/4 and 3/4) to make the test more interesting. Some of the melodies in the pairs were random notes, making no musical sense, while others were musical pieces with a clear melodic structure. Participants had to indicate which of the melodic sequences were musical – first, second, both or none. The sequences were separated by 1.5 seconds, and each pair was separated by 5 seconds.
Melody identification (sub-test 10). To ensure that identification abilities were being assessed and not musical knowledge, each participant’s
familiarity with the melodies was verified before testing (Looi et al.,
2008). The melodies were selected for their general familiarity from discussions among hearing and music professionals, and from earlier studies in which recognition tests demonstrated that the melodies were familiar to persons with normal hearing and cochlear implantees (Kong
et al., 2005; Looi et al., 2003). To maximise cross-cultural recognition, input was also solicited from individuals of different cultural backgrounds. Ten melodies that were familiar to the South African population were included and represented a variety of melodic features, thus giving a more realistic representation of how persons with hearing aids may function across a range of items.
The melodies were played on a piano in a range of A5/880 Hz - C8/4186 Hz. The stimulus set contained two presentations of each of the 10 melodies. Each melody was first presented with its rhythmical structure intact, and then with each note having a duration of 400 milliseconds, leaving the structure of the melody intact with only pitch as a cue for melody identification (meaning that there was no rhythmical structure). The playing of the melodies was randomised, but each melody was played twice, once rhythmically intact and once not. After two practice items, participants were asked to identify the melody on both occasions from a closed set. Participants responded by writing the number corresponding to the melody title they heard on the answer sheet. Participants were allowed to request that the melodies be repeated, to a maximum of three times. The final score was reported as a percentage of correct response on the melodies with which the listener was familiar. Those items missed on the test were cross-checked with the list completed beforehand. If an item was missed, and it was not listed as familiar, that item was eliminated from the analysis. The familiarity factor is difficult to control but to limit this effect, extremely common melodies were chosen as demonstrated in Table III.
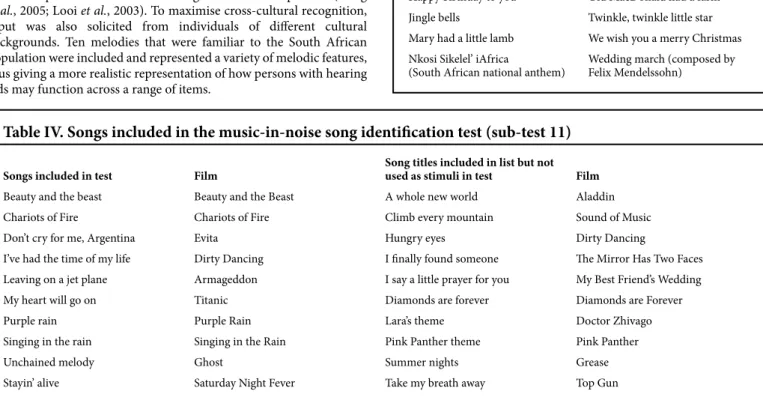
Music-in-noise song identification (sub-test 11). This sub-test aimed at providing evaluation material that is representative of real-life experiences. Well-known movie soundtracks were used. There are thousands of compositions from musical tracks used in movies from which to choose test excerpts. Because musical experiences vary considerably from one person to the next, and because recognition requires familiarity, a systematic process of selecting items that were likely to be familiar to many South Africans was used. Briefly, compositions were selected using published ranking of exposure and popularity, which offered quantifiable evidence of item exposure and familiarity to a relatively large segment of the adult South African population. Some of the included melodies have been found to be familiar by Spitzer et al. (2008), although they targeted the USA population. Table IV displays the soundtracks included.
Table III. Songs included in the familiar melody
identification task (sub-test 10)
‘7de Laan’ theme song (theme song of a popular TV ‘soap’ in South Africa)
Nokia ring tone (popular cell phone ring tone in South Africa) Happy birthday to you Old MacDonald had a farm Jingle bells Twinkle, twinkle little star Mary had a little lamb We wish you a merry Christmas Nkosi Sikelel’ iAfrica
(South African national anthem) Wedding march (composed by Felix Mendelssohn)
Table IV. Songs included in the music-in-noise song identification test (sub-test 11)
Songs included in test Film Song titles included in list but not used as stimuli in test FilmBeauty and the beast Beauty and the Beast A whole new world Aladdin Chariots of Fire Chariots of Fire Climb every mountain Sound of Music Don’t cry for me, Argentina Evita Hungry eyes Dirty Dancing
I’ve had the time of my life Dirty Dancing I finally found someone The Mirror Has Two Faces Leaving on a jet plane Armageddon I say a little prayer for you My Best Friend’s Wedding My heart will go on Titanic Diamonds are forever Diamonds are Forever Purple rain Purple Rain Lara’s theme Doctor Zhivago Singing in the rain Singing in the Rain Pink Panther theme Pink Panther Unchained melody Ghost Summer nights Grease Stayin’ alive Saturday Night Fever Take my breath away Top Gun
Because musical training and experience are unevenly distributed among the general population, it is possible that an individual may have no prior exposure to, and thus familiarity with, a specific item in the test, despite the fact that the excerpt is well known to the general public (Gfeller et al., 2005). Therefore, to rule out lack of prior familiarity as a factor in item recognition, an alphabetised list of melodies was included to identify the songs known by the participants. This list included 20 well-known movie soundtracks of which only 10 were included as test stimuli.
Subsequently, a simulated noisy environment, that of the interior of a car driving in traffic, was used to mask 10 of the songs. A difference of 6.2 dB and 10.2 dB was determined between the peak loudness of the music and the peak loudness of the noise which peaks at 0 dB. Only a well-known section (20 seconds, with 4-second fade in and 4-second fade out) of each song was played. The songs were separated by 10 seconds of interior car noise only. Participants were asked to identify the soundtracks presented to them by writing the corresponding number on the answer sheets. The final score was reported as a percentage of correct responses on the melodies with which the listener was familiar.
General procedures
A full-item list of the first version of the test is available in Appendix A. Most stimuli were designed specifically for this test, while stimuli for the last section were taken from commercially produced music compact discs. Each sub-test had two examples prior to the onset of the test stimuli. The following procedures were followed for all participants:
• Separate appointments were made with participants to undergo a
hearing evaluation to ensure candidacy.
• The aim and procedures of the study were explained to them.
Participants were also asked to provide comments regarding unclear or unnecessary procedures and questions, and to comment on the time needed to complete the MPT.
• Prior to the hearing evaluation, each participant’s current hearing
instruments were verified electro-acoustically to ensure that they were working properly and real-ear measurements were done to ensure that they were optimised to reflect the current best practice (Auriemmo et al., 2009).
• After the hearing evaluation had been performed, the music
perception testing took place on participants who met the selection criteria. Participants were seated in an audiometric test booth, facing the speaker at 45 degrees, at a distance of approximately 1 metre. The stimuli were played on a Sony D-FJ041 audio player and presented via a Grason-Stadler GSI 61 two-channel clinical audiometer to calibrated speakers. The presentation level was 75 dB HL for the calibration tone. The sound level was averaged at 75 dB SPL and hearing-aid users were permitted to adjust the volume on their hearing aids for maximum comfort. Sound was presented at the same intensity for all hearing-aid users, regardless of individual hearing thresholds. This was done as all participants had moderate to severe hearing losses and therefore no drastic differences in audiometric thresholds were expected. The participant held an answer sheet with a set of written instructions for each test section. All instructions were also presented via the speakers before the onset of each sub-test.
• Participants completed the test at once and did not have a break
between different test sections. No feedback was given during or after the test.
• After completion of the MPT, the procedures and content were
discussed with the participants in order to determine whether it was relevant and whether any changes were needed.
• Participants were thanked for their time and participation.
• Data and comments were analysed and interpreted and the
necessary alterations made.
The same equipment, physical set-up of the room, and instructions were used in phases 2 and 3.
Reliability and validity
Several measures were taken to increase the reliability and validity of the MPT, including (Downing & Haladyna, 1997):
• Conducting the MPT on normal hearing listeners enabled the
researcher to compile preliminary norms for this test and to compare the results of the participants with hearing loss to those of normal hearing listeners.
• Intra-rater reliability, as a form of rater reliability,4 was established
as the test results were consistent when the researcher administered the test on more than one occasion.
• Test specifications were constructed by documentation of
specifications for the test and can be seen in the MPT manual available in Appendix B.
• Item content verification was done by providing a reference list
of sources used in the development of the test as well as a peer content review. The peer content review was employed in the form of a rating scale to classify the quality of items included, as well as the relevance of the test to the field being assessed. The evaluation sheet for the peer content review was given to four independent audiologists and three music teachers. A copy of evaluation sheet used for the peer content review can be found in Appendix C. Various aspects were addressed in the music perception test evaluation sheet and after completion by professionals in the audiology and music industry provided the MPT with face validity,5 content validity,6 construct validity7 and criterion
validity8 (Shipley & McAfee, 2004).
• Test item editing was done in phase 2 where items with high
error rates were dismissed. By reviewing items, the clarity and appearance of items were enhanced. Furthermore, all items that needed editing were professionally edited.
• Revision to identify bias-sensitivity as one source of invalidity may be measurement error introduced by the language used. A thorough and systematic review of the MPT for potentially biased words, phrases, situations or content was done in order to eliminate potentially culturally biased words, phrases and situations that might be offensive to some individuals or groups. This was done by including individuals from different ethnic groups in the peer review. An exact match of the South African demographics could not be obtained, but Downing and Haladyna (1997) indicated that an exact match to the demographics of the target examinees is unnecessary.
• Test security of items was ensured. This is essential as invalidity
is introduced to the test if some examinees have access to test items whereas others do not. Furthermore, the researcher ensured that the examination was secure and that careful documentation, record keeping and a method of systematic, routine reporting of documentation took place.
Data analysis
Test scores from the MPT were directly written on the answer sheet. Each answer sheet was marked with the respondent’s number to ensure participant anonymity. All the answer sheets were checked to ensure that they had been completed in full before participants left the practice. The answer sheets were hand-scored because some melodies have both alternative and well-known titles and there are often multiple versions of lyrics. Furthermore, individual assessment of sub-test 5 (parts 1 and 2), sub-test 10 and sub-test 11 was required because in these sub-tests participants were only assessed on items familiar to them and therefore the total for each of these sub-tests differed for all participants. The researcher transferred all the data from the answer sheets into a Microsoft Excel work sheet. Responses were quantitatively coded and analysed with computer software. Data were processed with the use of an HP Intel Core 2 3.0 GHz processor and Microsoft Windows Vista as well as Microsoft Office programmature.
4 Refers to the degree to which the same person or different people obtain the same or very similar results after administering a test.
5 This implies that the MPT appears to measure what it claims to measure based on appearance. 6 This refers to the completeness of the MPT as a valid assessment of music perception because of the whole spectrum of skills that were tested.
7 This refers to the MPT’s ability to measure predetermined theoretical construct, in this case music perception, which is an explanation of behaviour based on empirical observations.
8 This implies validity of the MPT that is established by the use of external criteria as obtained from the peer review.
Results
Phase 2: Normal hearing participants
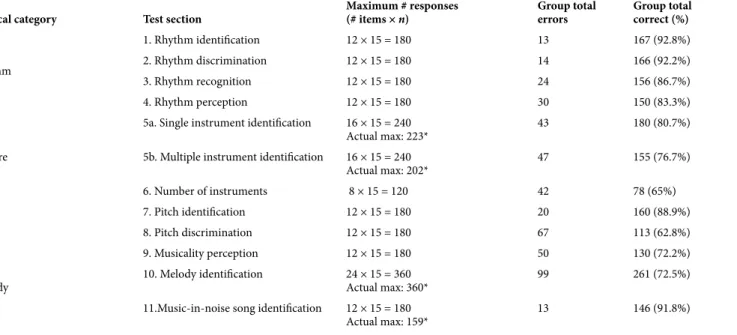
Participants obtained an average score of 88.8% for the rhythm section of the test with individual scores ranging between 70% and 100%. For the timbre section, a group average of 74.1% was obtained while participants’ scores ranged between 54% and 92%. An average score of 75.9% was obtained for the pitch section, with a range of 50 - 100%. The average score for the melody section of the test was 78.8% (range 63 - 93%). These results are summarised in Table V.
From Table V it is evident that participants performed best on the rhythm section of the MPT, with the highest average score obtained for the rhythm identification task. The worst performance was for the timbre section of the MPT, while the lowest average group score was obtained for the pitch discrimination task. Three errors on any single item were defined on a practical basis as a high error rate for normal
hearing listeners (20% of the sample). Spitzer et al. (2008) previously
used a high error rate as 15% of the sample got a certain item wrong. Test 1 had only 1 item with a high error rate while 2 items in test 2 were found to have a high error rate, 3 items in test 3 and 5 items in test 4. In test 5 (part 1), 7 items were found to have a high rate of error and 13 items in test 5 (part 2). Test 6 had 4 items, test 7 had 2 items and test 8 had 11 items with a high error rate. Nine items in test 9, 14 items in test 10 and 1 item in test 11 had high error rates. All items with high error rates were either adapted or eliminated in constructing the second version of the test that was used in phase 3.
Phase 2: Participants with hearing aids
Hearing-aid users obtained an average score of 73.5% for the rhythm section, 51.2% for the timbre section, 67.7% for the pitch section and 40.2% for the melody section of the MPT. Individual scores ranged between 48% and 100% for the rhythm section, 23% and 87% for the timbre section, 48% and 100% for the pitch section and 0% and 92% for the melody section of the test. The results of the participants with hearing aids included in phase 2 are summarised in Table VI.
Table VI shows that hearing-aid users also performed best on the rhythm section of the MPT with the highest average score again obtained for the rhythm identification task. The worst performance was on the melody section, probably due to the extremely low score obtained for
the music-in-noise song identification task. From the results obtained in phase 2, the following major changes were made to the test:
• To shorten the test, most of the sections were reduced from 12
to 10 items. The items eliminated in each section were those that were found to have the highest error rates. By shortening the test the reliability was increased as the probability of poor results caused by length of concentration and fatigue are reduced.
• For test 5 (part 2), the difficulty of the test items was addressed.
Most items consisted of 3 musical instruments playing together. Participants were unable to identify 3 instruments correctly, but could identify 1 or 2 instruments playing in an ensemble. Stimuli were therefore changed so that most items included only 2 instruments with only a few items remaining more difficult (3 instruments).
• The same principle was followed in test 6. The degree of difficulty
was reduced by including fewer musical instruments playing together; the items with high error rates were those where 4 or 5 instruments had been combined.
• A decrease in participants’ scores was noted for test 8. This was
found to be unrelated to difficulty of the test items; it was due to unclear instructions. Participants mentioned that they were unclear of what was expected of them. Therefore the test items were left unchanged with only the 2 items with the highest error rates being eliminated. Focus was placed on changing the instructions to avoid misunderstanding.
• The analysis of the results of test 10 showed that participants confused 2 of the items which sounded very similar. The first few notes of ‘Baa baa black sheep’ and ‘Twinkle, twinkle little star’ are almost identical. Confusing of these two melodies caused the percentage of success on this task to drop by 16.7% (2 melodies each being presented twice). It was therefore decided to eliminate one of these melodies to avoid unnecessary confusion. The items with the highest error rate were also eliminated to reduce the number of test items to 20 instead of 24.
• Test 11 was not found to be problematic with the normal hearing
participants, but almost all of the hearing-aid users obtained no score for this test. All of the hearing-aid users complained that the background noise was too loud and that they were unable to hear the melody. Therefore the stimuli were changed by reducing the intensity of the noise compared with that of the melody.
Table V. Error rates and percentage correct for the first version of the MPT presented to normal hearing
par-ticipants (n=15)
Musical category Test section Maximum # responses(# items × n) Group total errors Group total correct (%)
Rhythm
1. Rhythm identification 12 × 15 = 180 13 167 (92.8%) 2. Rhythm discrimination 12 × 15 = 180 14 166 (92.2%) 3. Rhythm recognition 12 × 15 = 180 24 156 (86.7%) 4. Rhythm perception 12 × 15 = 180 30 150 (83.3%)
Timbre
5a. Single instrument identification 16 × 15 = 240
Actual max: 223* 43 180 (80.7%) 5b. Multiple instrument identification 16 × 15 = 240
Actual max: 202* 47 155 (76.7%) 6. Number of instruments 8 × 15 = 120 42 78 (65%) Pitch 7. Pitch identification 12 × 15 = 180 20 160 (88.9%)
8. Pitch discrimination 12 × 15 = 180 67 113 (62.8%)
Melody
9. Musicality perception 12 × 15 = 180 50 130 (72.2%) 10. Melody identification 24 × 15 = 360
Actual max: 360* 99 261 (72.5%) 11.Music-in-noise song identification 12 × 15 = 180
Actual max: 159* 13 146 (91.8%)
*Actual maximum for test differs from maximum possible responses as participants indicated with which items they were familiar ,and the final score was reported as a percentage of correct responses on the items with which the listener was familiar.
Furthermore, the 2 items with the highest error rates were eliminated to reduce the number of items to 10.
• Technical adjustments and language editing were done to improve
the test and reduce confusion.
The second version (Appendix D) of the MPT consisted of the same sections as the first version but most of the sections were shorter to reduce the length of the test. This version of the MPT was constructed with a total of 140 items (test 1, 2, 3, 4, 7, 8, 9 = 10 items each, test 5 (part one) = 16 items, test 5 (part two) = 16 items, test 6 = 8 items, test 10 = 20
items and test 11 = 10 items). A marking sheet of all the answers of the revised version of the test can be seen in Appendix E.
In phase 3, the adapted version of the MPT was presented to 4 adults with normal hearing and 20 adults with hearing aids. Scores for the different sections of the test improved on presentation to the adults with normal hearing when compared with the results of normal hearing listeners in phase 2, as can be seen in Table VII. Normal hearing participants obtained an average score of 93.8% for the rhythm section of the test with individual scores ranging between 80% and 100%. For the timbre
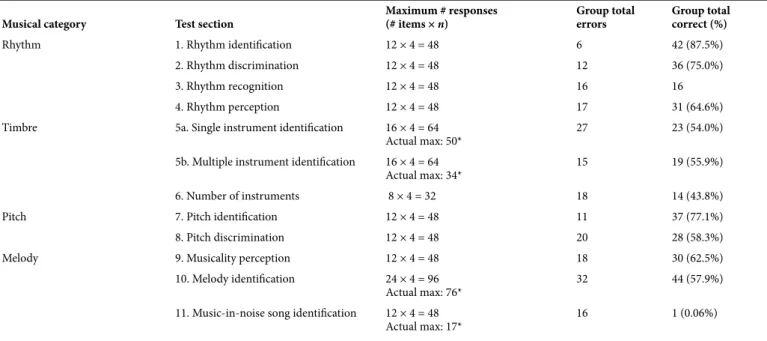
Table VI. Error rates and percentage correct for the first version of the MPT presented to participants with
hearing aids (n=4)
Musical category Test section Maximum # responses(# items × n) Group total errors Group total correct (%)
Rhythm 1. Rhythm identification 12 × 4 = 48 6 42 (87.5%) 2. Rhythm discrimination 12 × 4 = 48 12 36 (75.0%) 3. Rhythm recognition 12 × 4 = 48 16 16 4. Rhythm perception 12 × 4 = 48 17 31 (64.6%) Timbre 5a. Single instrument identification 16 × 4 = 64
Actual max: 50* 27 23 (54.0%) 5b. Multiple instrument identification 16 × 4 = 64
Actual max: 34* 15 19 (55.9%) 6. Number of instruments 8 × 4 = 32 18 14 (43.8%) Pitch 7. Pitch identification 12 × 4 = 48 11 37 (77.1%) 8. Pitch discrimination 12 × 4 = 48 20 28 (58.3%) Melody 9. Musicality perception 12 × 4 = 48 18 30 (62.5%)
10. Melody identification 24 × 4 = 96
Actual max: 76* 32 44 (57.9%) 11. Music-in-noise song identification 12 × 4 = 48
Actual max: 17* 16 1 (0.06%)
*Actual maximum for test differs from maximum possible responses as participants indicated with which items they were familiar and the final score was reported as a percentage of correct responses on the items with which the listener was familiar.
Table VII. Error rates and percentage correct for the adapted version of the MPT presented to normal hearing
listeners (n=4)
Musical category Test section Maximum # responses(# items × n) Group total errors Group total correct (%)
Rhythm 1. Rhythm identification 10 × 4 = 40 2 38 (95.0%) 2. Rhythm discrimination 10 × 4 = 40 1 39 (97.5%) 3. Rhythm recognition 10 × 4 = 40 3 37 (92.5%) 4. Rhythm perception 10 × 4 = 40 4 36 (90.0%) Timbre 5a. Single instrument identification 16 × 4 = 64
Actual max: 60 8 52 (86.7%) 5b. Multiple instrument identification 16 × 4 = 64
Actual max: 53* 10 43 (81.1%) 6. Number of instruments 8 × 4 = 32 6 26 (81.3%) Pitch 7. Pitch identification 10 × 4 = 40 3 37 (92.5%) 8. Pitch discrimination 10 × 4 = 40 8 32 (80.0%) Melody 9. Musicality perception 10 × 4 = 40 7 33 (82.5%)
10. Melody identification 20 × 4 = 80
Actual max: 80* 8 72 (90.0%) 11. Music-in-noise song identification 10 × 4 = 40
Actual max: 38* 3 35 (92.1%)
*Actual maximum for test differs from maximum possible responses as participants indicated with which items they were familiar and the final score was reported as a percentage of correct responses on the items with which the listener was familiar.
section a group average of 83% was obtained while participants’ scores ranged between 66% and 100%. An average score of 86.3% was obtained for the pitch section and 88.2% for the melody section of the test. For the pitch section scores ranged between 70% and 100% while scores ranged between 68% and 100% for the melody section.
Again, the best average score was obtained for the rhythm section of the test while the lowest average score was obtained for the timbre section. The task with the highest score was the rhythm discrimination task whereas the pitch discrimination task obtained the lowest average score. Results of phase 3, in which the test items were administered to aid users, are summarised in Table VIII. In this phase, hearing-aid users obtained an average score of 75.5% for the rhythm section, 62.3% for the timbre section, 70.8% for the pitch section and 61.9% for the melody section of the MPT. Individual scores ranged between 60% and 100% for the rhythm section, 46% and 94% for the timbre section, 60% and 100% for the pitch section and 39% and 100% for the melody section of the test.
From Table VIII it is evident that hearing-aid users performed the best on the rhythm section of the test and obtained the highest score for the rhythm identification task. Again these listeners obtained the lowest average score for the timbre section of the test with the identification of multiple instruments being the most difficult task.
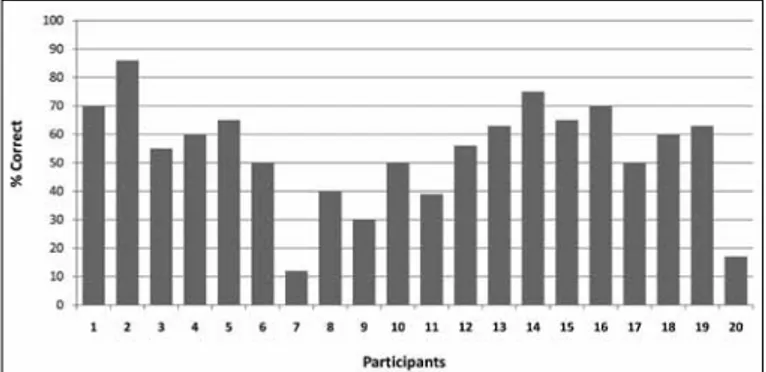
The mean overall score for the hearing-aid users who completed the adapted version of the MPT was 68.6%. Figure 2 illustrates the overall individual performances on the MPT for this group.
With a bigger, heterogeneous group of hearing-aid users who completed the revised version of the test, a few observations were made. First, the entire sample was able to perform all the different sub-tests of the MPT. None of the participants was confused by the tasks or unable to participate. Table VIII reflects that all the participants found tests 1, 2, 3 and test 4 relatively easy and performed fairly well on these tasks, obtaining an average score of 60% or more. Results for test 5 (parts one and two) were somewhat different and are presented in Figures 3 and 4. As demonstrated in Figure 3, just over half of the participants (11 of 20) found this task relatively easy and obtained a score of 60% or more while the other 9 participants’ scores ranged from 25% to 56%.
It was noted that participants who performed better on this task were those who indicated that they were able to play one or more musical instruments or had some formal musical training.
Figure 4 displays participants’ individual performance on the multiple instrument identification task (test 5, part 2).
The scores displayed in Figure 4 indicate that participants obtained much lower scores for this task than the previous one. It was, however,
Fig. 3. Participants’ performance on the single instrument identification task (test 5, part one).
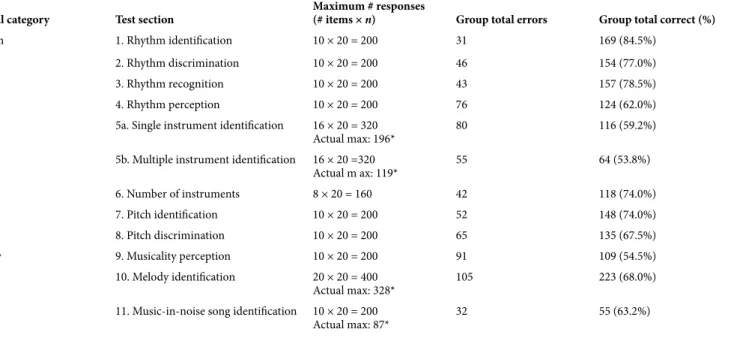
Table VIII. Error rates and percentage correct for the adapted version of the MPT presented to participants
with hearing aids (n=20)
Musical category Test section Maximum # responses(# items × n) Group total errors Group total correct (%)
Rhythm 1. Rhythm identification 10 × 20 = 200 31 169 (84.5%) 2. Rhythm discrimination 10 × 20 = 200 46 154 (77.0%) 3. Rhythm recognition 10 × 20 = 200 43 157 (78.5%) 4. Rhythm perception 10 × 20 = 200 76 124 (62.0%) Timbre 5a. Single instrument identification 16 × 20 = 320
Actual max: 196* 80 116 (59.2%) 5b. Multiple instrument identification 16 × 20 =320
Actual m ax: 119* 55 64 (53.8%) 6. Number of instruments 8 × 20 = 160 42 118 (74.0%) Pitch 7. Pitch identification 10 × 20 = 200 52 148 (74.0%) 8. Pitch discrimination 10 × 20 = 200 65 135 (67.5%) Melody 9. Musicality perception 10 × 20 = 200 91 109 (54.5%)
10. Melody identification 20 × 20 = 400
Actual max: 328* 105 223 (68.0%) 11. Music-in-noise song identification 10 × 20 = 200
Actual max: 87* 32 55 (63.2%)
*Actual maximum for test differs from maximum possible responses as participants indicated with which items they were familiar and the final score was reported as a percentage of correct responses on the items with which the listener was familiar.
Fig. 2. The overall individual performances of hearing-aid users on the adapted version of the MPT.
expected that participants would find this task more difficult than the previous one as the combination of instruments were included as a task of increased difficulty to assess timbre recognition beyond single instruments. Furthermore, it is evident that 65% (13 of 20) of the participants obtained lower scores for the multiple instrument identification task compared with the single instrument identification task, with only 15% (3 of 20) of participants scoring exactly the same on both tasks. A total of 20% (4 of 20) of the participants had improved scores on the more challenging task, possibly because they had musical training. For 1 of the 4 participants the improvement was very slight (only 2%), but for the other 3 improvement of 11%, 35% and 12% was seen. This improvement was not expected and warrants further investigation. Interstingly, when asked what they thought contributed to their superior performance in this task, 3 of them replied that they regularly listen to classical music and therefore found the identification of instruments presented in an ensemble not that difficult. This can be explained by the fact that classical compositions consist of complex harmonic progressions, intricate rhythms and timbral blends (Gfeller
et al., 2005) and should be investigated in more detail.
Results of test 6, test 7, test 8, test 10 and test 11 were all relatively good, with the average for all of these tasks being 60% or above. The range of scores for these tests were:
• Test 6 - number of instruments 29 - 100%
• Test 7 – pitch identification 50 - 100%
• Test 8 – pitch discrimination 50 - 100%
• Test 10 – melody identification 0 - 90%
• Test 11 – music-in-noise song identification 0 - 100%
Participants obtained a lower average score for the musicality perception task (test 9). These data are displayed in Figure 5.
From Figure 5 it seems that participants found the musicality perception task challenging as they only obtained an average score of 54.5% for this task. This task again has a correlation with musicality and therefore explains the tendency of participants with previous musical training to perform better than participants with no musical training.
Discussion and conclusion
The development of a musical test for hearing-aid users, in which there is a stepwise, graded range of difficulty, was feasible, based on the
present findings. Test results of the MPT demonstrated that each section entailed a different challenge level and that various difficulty levels were included in each section. This is important as it demonstrates that the MPT was neither too easy nor too difficult for hearing aid users and therefore implies that valid results will be obtained; the difficulty level of the test will make it possible for most hearing- aid users to complete. Furthermore, results proved that normal hearing adults as well as adults with hearing aids were able to complete all the sub-tests of the MPT although hearing-aid users obtained lower scores on the various sub-tests compared with normal hearing listeners.
Although hearing-aid users scored less than normal hearing users on the rhythm section of the MPT, they still obtained relatively high scores. The high scores obtained by hearing aid users on the rhythm tasks are not unexpected as it is known that adults with hearing loss increase their reliance on temporal cues as their hearing loss increases. This reliance on temporal cues is logical, given that, for most severe hearing losses, frequency resolution is lost, while temporal information remains largely intact (Flynn, Davis & Pogash, 2004). Furthermore, previous research confirmed that adults with hearing loss generally perceive
rhythm as well as adults with normal hearing (Looi et al., 2008). The
poor performance on the timbre perception might be explained by the fact that accurate timbre perception requires the perception of both the signal’s temporal envelope and the energy spectrum of its harmonic components. Modifying features of the temporal envelope or changing the frequencies and/or amplitude of the harmonic components could alter the timbre perceived (Looi et al., 2008). Therefore, the comparatively poorer identification results for participants with a hearing loss compared with normal hearing participants might suggests that the hearing aid does not sufficiently transmit the broad spectral envelope and/or temporal envelope information from the input signal to enable accurate timbral perception. This may have arisen from a range of factors. For a normal hearing individual, such spectral selectivity derives from the different frequency components of the acoustic stimulus being separated into different auditory filters, with each frequency component resulting in activity at discrete sites along the basilar membrane. For hearing-aid users, perceptual smearing may occur as a consequence of auditory filter anomalies associated with cochlear hearing loss, poor neural survival patterns, and poor frequency selectivity. This may result in diminishing spectral clarity of the stimuli for the subject (Looi et al., 2008).
As it is well known that cochlear damage leads to changes in perceived pitch or reduced pitch perception accuracy (Ricketts, Dittberner & Johnson, 2008; Moore, 1996), it was expected that hearing-aid users would obtain lower scores on pitch-related tasks than normal hearing listeners. This might be due to the that fact that people with cochlear damage depend relatively more on temporal information and less on spectral information than normal hearing listeners when perceiving pitch (Moore, 1996). Performance on the melody section of the test can be similarly explained as listeners depend on exact pitch intervals of melodies when trying to recognise them. Gfeller and Lansing (1992) also confirmed that hearing loss has a significant impact on melody perception; therefore it was not unexpected for normal hearing adults to perform better on melodic perception tasks than hearing-aid users. As previously mentioned, currently no MPTs for hearing-aid users exist, as most of the previously designed MPTs were compiled with cochlear implantees as the target population. Therefore results of the current test could not be compared with results obtained in previous studies.
The different sections of the MPT were intended to provide an insight into different aspects of music perception. The possible value of using a test like this in the hearing-aid industry can result in more effective hearing-aid fittings taking place, specifically with the focus being placed on music perception. The test can further be used as a counselling tool to assist audiologists and patients in understanding the problems they experience regarding music perception, and might be used for future musical training in areas where participants experience problems in customising individual fittings.
Fig. 4. Participants’ performance on the multiple instrument identification task (test 5, part 2).