International Journal of Communication Networks and Information Security (IJCNIS) Vol. 9, No. 3, December 2017
Overhead in Available Bandwidth Estimation Tools:
Evaluation and Analysis
Dixon Salcedo
1, Julián Guerrero
2and Cesar D. Guerrero
21
Department of Computer Science and Electronics, Universidad de la Costa, Colombia
2
Engineering and Organization Research Center, Universidad Autónoma de Bucaramanga
Abstract: Current Available Bandwidth Estimation Tools (ABET) insert into the network probing packets to perform a single estimation. The utilization of these packets makes ABET intrusive and prone to errors since they consume part of the available bandwidth they are measuring. This paper presents a comparative of Overhead Estimation Tools (OET) analysis of representative ABET: Abing, Diettopp, Pathload, PathChirp, Traceband, IGI, PTR, Assolo, and Wbest. By using Internet traffic, the study shows that the insertion of probing packets is a factor that affects two metrics associated to the estimation. First, it is shown that the accuracy is affected proportionally to the amount of probing traffic. Secondly, the Estimation Time (ET) is increased in high congested end-to-end links when auto-induced congestion tools are used.
Keywords: Available bandwidth estimation, Overhead, Internet measurement tools, Network monitoring.
1. Introduction
The available bandwidth (av_bw) estimation between two end Internet nodes, is an open research area that, for more than twenty years, has called the attention of researchers around the world, due to its potential use on different network applications. For example, administration tools can monitor with accuracy the utilization a link; Internet Service Providers (ISP) can monitor and verify service quality levels; Intrusion Detection Systems (IDS) can generate alerts based on an unexpected increase in the network utilization; transport protocols can determine the best initial transmission rate as the amount of av_bw in the network [1-8]. These and other applications require an estimate of av_bw in an end-to-end manner since estimation nodes don’t have control over the intermediate links through which the communication channel is established.
The estimate of the end-to-end av_bw has been studied by several researchers around the world. Several works are aimed to describe the estimation techniques and related concepts [9-18]. Other studies present comparative analysis of the estimation tools when tested in different network scenarios and under different types of cross traffic [19], [20]. The complexity of the problem has led several authors to make erroneous considerations on the behavior of their estimation tools [21-24]. The inability of the software running on application layer to prioritize the probing packet delivery process, introduces additional errors since the transmission times of the packets does not correspond to the theoretical value determined by the tool [25-27]. Although new ABET have managed to significantly reduce the probing traffic, it has still a significant impact given the need for repetitive testing to obtain a single estimation [4], [28]. According to Aceto et. al. [29], Pathload [30] generates between 2.5MB and 10MB, and Spruce generates about 300KB test traffic by measurement. The average
measurement of probe traffic generated by IGI-PTR [31] is 130KB. Comparative studies showing differentiating aspects of each of the tools when tested in different network scenarios and under different types of cross traffic are presented in the literature [32], [9], [33], [34], [35], [36], [37]. Similar studies are performed for Wireless Networks [38-43]. This paper presents a comparative analysis of OET, accuracy, Relative Error (ER) and ET shown by nine estimation tools: Abing [44], Assolo [45], Diettopp [46], Pathload, PathChirp [17], Traceband [47], IGI and PTR and Wbest [48].
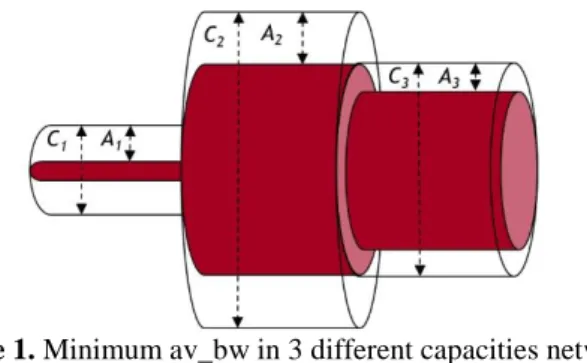
Figure 1. Minimum av_bw in 3 different capacities network segments.
Researchers as V. Jacobson [50], [51] and V. Paxson [52] [53] were pioneers on studying metrics and characteristics of end-to-end Internet links. One of these metrics was the av_bw. The av_bw in a link refers to the unused portion of the total link capacity for a certain period. Although it seems that the capacity of a connection depends on the connection rate of the technology and the propagation medium used, it also depends on the traffic load of the link during time [54]. In [55] and [56], based on the burst nature of the traffic in the network, show that to accurately measure the av_bw it is required to perform an average of measurements during a short period of time. This can be expressed by the following equation.
𝑢 𝑡 − 𝜏, 𝑡 =1 𝜏 𝑢
𝑡
𝑡−𝜏
𝑥 𝑑𝑥, (1)
where u(x) is the av_bw in an instant of time given x. It is possible to calculate the av_bw in a segment, so that if ci
is the ability segment i, ui is the average use of the segment
in each time interval, the mean value av_bw Ai is could be
expressed as follows:
𝐴𝑖 = 𝐶𝑖 1 − 𝑢𝑖 . (2)
Similarly, the capacity minimum av_bw be found along a link or several segments:
International Journal of Communication Networks and Information Security (IJCNIS) Vol. 9, No. 3, December 2017
The Figure 1 can be viewed as the last segment A3 has the
lowest av_bw and will this be the bottleneck of the transmission in that moment of time. Importantly often it assumed that the traffic load is stationary in all the way. This is only reasonable taking a short time since it is an indicator that varies rapidly with time. This is the main difference with respect to capacity, since it does not change as fast as there are no changes in routes or links.
Currently to exponential growth of Internet traffic demand and the need to provide end users with better service performance to their applications. This makes between different metrics for network administrative services, the estimation of av_bw becomes very relevant; due to it is an important optimization QoS metric specifically Internet networks. This justifies the efforts of researchers worldwide, to make better comparative studies of the behavior of ABET, which appear in [63], [21], [58], [4], [59], [60]; These are intrusive and ABET mostly active or another passive. Current studies show no real analysis of the effects caused using test packets in the critical variables of the estimate, such as accuracy and time estimation. That is why the need arises to have studies that focus on these variables and they have information not known behavior of these tools that allow design and implement new methodologies or non-intrusive and more accurate than current tools.
Our study ran 270 experiments using a specialized network testbed. The cross traffic used in the experiments is generated from an Internet trace, captured by CAIDA (Center for Applied Internet Data Analysis), and replicated using the tcpreplay [49] tool. Section II presents the theoretical fundaments, the reason why the study was performed and the state of the art of similar studies of the estimation of the available bandwidth. In the Section III, we present the impact of overhead in the estimation of current tools is explained. Section IV, presents the methodology to design and execute the experiments. Finally, the analysis of the results and conclusions are presented in Section V and VI respectively.
2. Related Works and Motivation
To the date, comparative studies reveal differentiating aspects of ABET when you are tested in different network scenarios and under different types of cross traffic (CT). A review of the literature identified 26 studies representing ABET that summarize, analyze and evaluate different approaches, methods, tools and concepts related to measurement av_bw.
The first survey that evaluated Pathchar [50] was [60], compared the behavior of eight links with different capacities, focusing only on latency and av_bw; showing that there are gaps in the size and number of packets ideal test should use a tool and associate himself so the effects on the measurement. Researchers [30] evaluated IGI, PTR and Pathload; comparing the accuracy, convergence time, size and number of trains test packets; but does not discuss the relationship between the impact and the other. Their results showed that only three tools have maximum 30% error in the measurement. IGI and PTR also take about 2s to converge, while Pathload takes much longer. Besides the difficulties of IGI when tight bond is not in the bottleneck. Another study focused on analyzing the ABET comparing three metrics mainly; the ability av_bw and Bulk Transfer Capacity (BTC) [55]. It does not perform evaluation, only classified according to the methodology used to estimate such as:
Per-hop capacity, End-to-end capacity, Available bandwidth, TCP throughput and BTC measurement, ending with an analysis of the intrusiveness of methodologies the performance evaluation and comparison of three BET, Pathload and PathChirp estimation tools. [61] this one focuses on comparing the accuracy, av_bw and time estimation; without further analysis between the behavior of the measured variables and scenarios setting. This study highlights the evaluation of ABET in a wireless link, showing this low accuracy in estimating av_bw. Also in [59], five tools were evaluated in different scenarios, with tight links 10 to 200Mbps, with low and high level of CT. The study made an interesting relationship of the impact of capacity, packet delay, the rate and packet size of the CT; ER, OH, time and reliability of the estimations; contrast to the present study that shows how impinges OH methodology and tool accuracy and estimation time. Other researchers in [58], compared the behavior of accuracy, time and level of intrusion nine ABET. Limited only to compare the results of each of the experiments conducted in different types of scenarios and CT. [4] used to evaluate eight tools, a platform called Unified Architecture for Network Measurement (UANM), evaluating and analyzing the impact of CT, in the av_bw, convergence time and OH. This shows CT increases in relation to the variability in the amount of test packets as Pathload tools. Another study in [57], assesses five ABET, focusing on analyzing the influence of Round Tripe Time (RTT) in error estimation time, compared to CT and lost packets. All these studies presented above scenarios are evaluated with wired networks and others in simulated NS-2 or NS-3 environments. Likewise, also they evaluated ABET Wireless or hybrid scenarios. In [62], evaluate the NEXT-FIT tool and compared with PathCrip, performance analyzing error and relation between CT and av_bw estimated by both tools. There are other studies that evaluate and compare tools in these scenarios, whose information can be extended in [37], [47], [42].
The papers presented, showing the efforts made by researchers to compare the most important variables in the estimation of av_bw. Still, do not require an analysis of the direct or indirect relationship with these and how they can influence one on the other, to minimize noise measurement, creating a void on the intrusive tools, they know the noise generated by packets test, but they have precisely quantified the impact or actual impact on the accuracy of the estimate. It is indicating that there are several reasons that make this work different to the previous ones. First compares the nine tools more evaluated by the researchers, which makes a reference. Second tests performed on a specialized testbed, which controls the CT, lost packets and bandwidth. And third, it has a broad comparative and relational behavior analysis overhead, accuracy, relative error and estimation time.
International Journal of Communication Networks and Information Security (IJCNIS) Vol. 9, No. 3, December 2017
or estimation methodology, to refine the estimate. Therefore, Assolo, Pathload and slops Pathchirp used (Self-Loading Periodic Streams); on the contrary, Traceband, Abing, IGI, and Wbest PTR, PP/TD (Packet Pair/Train Dispersion) and TOPP (Trains of Packet Pairs) used by the tool Diettopp used.
3. Overhead
Overall context, the OH, can be defined as a system overload, irrespective of the factor producing it; it’s could decrease the performance of the telecommunications systems and network protocols [64], [65]. In the telecommunications area, specifically estimating the av_bw and capacity, using probes packets to evaluate the analyzed channel, there are two sources of OH related to the intrusive nature, given the levels of hardware and software. At the hardware level is called Overhead Hardware Interrupt (OHI), occurs in the network adapter (NIC), when the tool needs to mark the times that are sent test packets; for the time, it asks the operating system through specific functions such as
gettimeofday() or hardclock(), which generate an interrupt to
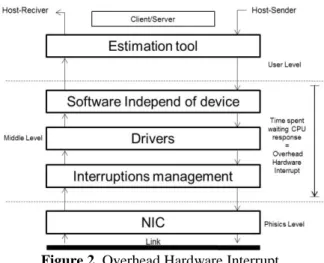
the CPU, which is serviced according to their planning processes. In the allocation of time-two methods are known; the first continuously checks the CPU clock and sends the packet when the clock reaches a certain time; for example, in Linux-X86 systems access to the hardware clock requires approximately 1.9µs. Also, an operation such as write() to call the system requires on average 2µs (for CPU's Pentium), therefore a Linux system can only send packets with higher intervals 2 + 1.9 = 3.9µs [27], [66]. The second method is to register in the program sending one Interrupt Service Routine packets (ISR) of interrupt clock hardware, operating systems such as 4.4BSD and Linux 2.6 kernels, spend between 1s to 0.0001s on each call. Also, if the transmission rate is 1Gbps, the interval between packets it is 12µs, allowing conclude the OHI is as high as 1/12 of the total working time CPU. Therefore, the ideal of moderation interruption period should be short enough to keep the NIC always available and avoid major delays in processing packet [67]. The Figure 2, it shows a diagram of an ABET, which operates in client-server mode. In at user level, performs operations setup, start and end of the estimation. When the estimation starts, you must send test packets, which should be marked with shipping times; for this, the tool requests the middle level, using functions time capture system that allows you to mark the departure times of the test packets. But because of the way the system controls the CPU interrupts, these functions should wait a while (called OIH); causing an assignment of a time-totally different that really should have been sent to the physical layer for transmission.
The maximum interval interrupt (I_Maxtime) can be calculated as shown in the following formula:
𝐼_𝑀𝑎𝑥𝑡𝑖𝑚𝑒 = ( 𝑁 ∗ 𝑇 /𝑉𝑒𝑙_𝑏𝑢𝑠). (4)
Where N is the number of buffers receiver descriptors, compiled statically to the NIC driver and I the average packet size.
The software level OH we call OET, due to the intrusive nature of ABET, all packets use test tools for estimation. The percentage of OET used by a tool on an estimate εi it can be
expressed as,
𝑂𝐸𝑇(𝜀𝑖) = (( 𝜌 ∗ 𝛾 /𝜏)/𝛽), (5)
where ρ, is the number packets input to the network for estimation, γ the packet size in bits, τ the time in seconds(s) for which packets are inserted and β represents the actual available bandwidth of end-to-end network in Mbps.
Figure 2. Overhead Hardware Interrupt
The OET cause a negative impact on the measure of av_bw. The best known is the error found by the underestimation of the channel, due to that the probes packets used the channel during estimation are not considered in the final measure. Other errors related to OET are the impact over time of estimation and the accuracy of ABET, is still under study and is addressed by this work. Because of this, researchers in the field of monitoring computer networks. Therefore, they have proven techniques and methods for reducing the overhead. In [9], a technique called NEXT (New Enhanced available bandwidth measurement Technique) for each packet-probe stream uses 10 packets of 1200 bytes, for a total of 10 * 1200 = 12KB occurs, and train number depends on the amount of CT on the network. In [25] presents OMware, a method that can reduce OET, manipulating delays, timestamps, and before calculating the CheckSum and the head of the TCP/IP packets. [11] implement the method called Sigmon (Signature based Measurement and Monitoring), which reduces test overhead and time without causing congestion estimation, reaching a utilization of 80% when using persistent channel CT. [68], implement a technique known as Self-Loading Decreasing Rate Train (SLDRT), make estimates, where the OET low levels between 0,273 MB and 0,078MB, but the relative error cannot be controlled, to 4% and 68% respectively.
International Journal of Communication Networks and Information Security (IJCNIS) Vol. 9, No. 3, December 2017
0.9. In [70], [27] and [71] propose a new estimation technique based on TCP, called Inline Measurement TCP (ImTCP), which adjusts the transmission intervals of test packets to minimize overhead and evaluates the times of arrival of the ACK's. Also [72] analyzes only the amount of OET to estimate with Wren (performs passive estimate), showing that using TCP Bulk, this is minimal, but it does not show the accuracy measured.
Figure 3. Scale of OET level
To reference and classify better the level of intrusiveness of each ABET, we create a scale with five levels, it’s that measures the level de OET utilized for gain an estimation. The lower level, Low (0Mb to 2Mb) and the higher level is greater or equal to 40Mb; the middle levels, appear in the Figure 3.
4. Performance Evaluattion
4.1 Evaluation Testbed
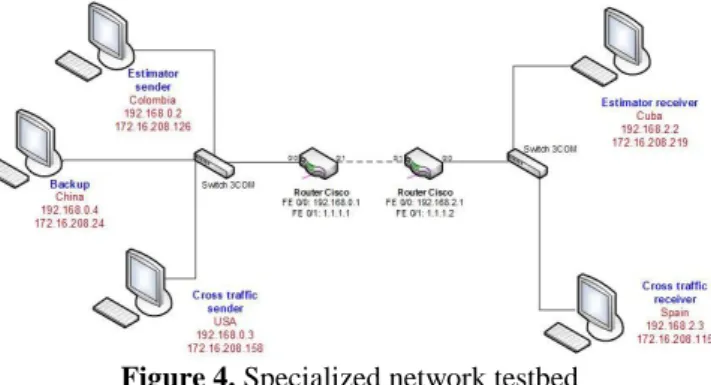
or the experimental evaluation of the tools, we implemented a testbed (Tb) expertise to assess network protocols, which can be seen in Figure 4. This is a totally controlled and programmable links in terms of link capacity, packet size and propagation delay environment. The Tb hardware level has three components: 7 computers corresponding to the host, which allow you to interact with the network and perform all necessary tests, equipped with enough processing power to support the performance that experiments require the CPU speeds ranging from 800MHz to 2.8GHz and all with GNU system, see Table 1. At each end of Tb, host to communicate with each other, each network has a Baseline 2928-SFP Plus Switch, brand 3COM, which can operate between 100Mbps and 1Gbps. Also, to interconnect the network 1 with the network 2 each network has one CISCO 1800 Series Router (100Mbps); where the router assigned to Network 1 is called ALFA and OMEGA as net 2. Each switch is connected to the interface (LAN) FE0/0 of their respective router, also they are interconnected using the (WAN) interface FE0/1, thus simulating an Internet connection, forming the network 3.
Table 1. Host features
Host Operating
System
Architec
ture CPU-Clock (Mhz)
COLOMBIA Debian-Linux 8.3 i686 Athlon II 800-2800
USA Arch-Linux X86_64 Athlon II 800-2800
CUBA Debian-Linux 8.3 i686 Athlon II 800-2800
SPAIN Debian-Linux 8.3 i686 Athlon II 800-2800
CHINA Arch-Linux X86_64 Athlon II 800-2800
At the software level, the Tb has two main elements. First, ABET selected to evaluate, were installed and configured in the respective host, mainly in the Sender and the Receiver
host. Importantly, during the preparation of Tb, tools like Abing, Assolo and Wbest, could not be configured properly due to incompatibility with operating systems architecture X86_64, so we recommend using operating systems i686. Second, researchers in their assessments, are forced to simulate channel congestion and cross-traffic control, to determine the accuracy of the estimate, among other variables. Therefore, generators used packets (synthetic traffic) for estimating. To select a packet generator synthetic traffic, three important aspects were analyzed. Initially, it's replicates traces (PCAP files), also allowing scale traffic transmission rate (30% to 60%) on the channel used. Finally, it has been implemented in a real testbed and not a simulation (e.g. NS-3).
Figure 4. Specialized network testbed
D-ITG, it is produces traffic with appropriate accuracy,
controlling the output time and the size of packets to send, works on IPv4 and IPv6. It also has the most versatile type of traffic, which would have more options to compare the performance of the tools.
Iperf, it is normally used as an estimation tool where they
can take advantage of many of its features with better performance.
MGEN, it is an easy to use, due to the flexibility of the parameters (protocol, Tx and Rx events, etc.) of each type of traffic generated. It also allows traffic to generate a trace previously captured in a pcap file. This makes using the CLONE parameter, but cannot scale the amount that is to be introduced to the network. It is important to clarify that with other options such as POISSON or BURST, among others, Mgen can scale traffic.
Tcpreplay, is an easy to use tool that can generate traffic. In
addition, traces replica format pcap, two very particular ways, as are the (-multiplier/-mbps), which can scale (dimension) traffic that enters the testbed.
International Journal of Communication Networks and Information Security (IJCNIS) Vol. 9, No. 3, December 2017
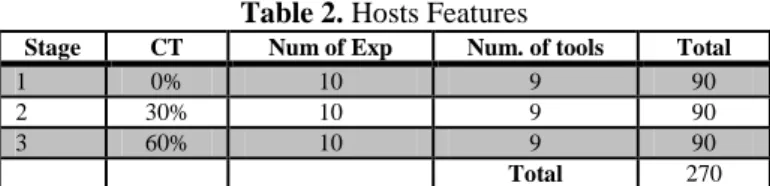
using the parameter mbps, that allows flooding the channel to a controllable amount of data, reaching a precision of 1µs. Given the above and according to the amount of traffic; scenarios to be evaluated are: Without traffic, with 30% and 60% of CT; with 10 experiments were performed for each scenario, to have 30 evaluations for each tool, and thus achieve a total of 90 experiments by stage and 270 experiments in total, which are shown in Table 2.
Table 2. Hosts Features
Stage CT Num of Exp Num. of tools Total
1 0% 10 9 90
2 30% 10 9 90
3 60% 10 9 90
Total 270
In the literature review it was determined that the metrics most evaluated by the most representative 26 studies of ABET, have been ranked in order from highest to lowest, being of as follows. The Available bandwidth (22/26) Packet size (17/26), Estimation time (16/26), CT and accuracy (13/26), and overhead with (6/26). In relation to the above and due to the nature of the investigation to be performed are defined as metrics to evaluate and compare the ABET, the following variables:
-Estimation Time (TE). -OET.
-Relative Error (ER).
-Available Bandwidth (Av_bw).
4.2 Tools
Table 3. ABET developed to date
Year Tool Author(s)
2016 NEXT-FT Kumar, Tachibana and Hasegawa
2014
BEST-AP Dely, Kassler, Chow, Bambos, Bayer and
Einsiedler
Brandshaper Low and Alias
2009 ASSOLO Goldoni, Rossi and Torelli
Traceband César Guerrero
2008 DCSPT Ergin, Gruteser, Luo, Raychaudhuri and Liu
Wbest Li, Claypool and Kinicki
2007 YAZ Sommers, Barford and Willinge
2006 ImTCP Man, Hasegawa and Murata
BART Hartikainen, Ekelin and Karlsson
2005 BET Botta, D’Antonio, Pescapè, Ventre
2005 Owamp Shanlunov, Teitelbaum, Karp, Boote and
Zekauskas
2004 DietTopp Johnsson, Melander and Björkman
2003
PTR Hu y Steenkiste
Iperf The Iperf team
PathChirp Vinay Ribeiro
Spruce Strauss, Katabi and Kaashoek
Wren Zangrilli and Lowekamp
Abing Navratil and Cottrell
Pathrate Dovrolis and Prasad
2002 IGI - PTR Ningning Hu
Pathload Jain and Dovrolis
2001 Pipechar Jin Guojun
2000 TOPP Bob Melander
1997 Pathchar Van Jacobson
1996 Cprobe Carter and Crovella
All evaluated tools are active and intrusive; and they were carefully selected from the literature review, of which 23 pre-selected tools, see Table 3. Then those 23 filtered according to the following criteria: be a GNU/Linux available Online tool evaluated at least 5 times by researchers, see Table 4, developed from 2005 onwards, it has been evaluated in physical testbed and evaluate at least
two of these three metrics: RE, CT or OET. Selected tools that met minimum 3 criteria and are listed in the Table 5.
Table 4. Estimation tools selected
Tool Num.
Eval Year
GNU/Onli
ne Testbed
Eval. Metrics
Pathload * * * * *
PatChirp * * * *
IGI * * * *
PTR * * * *
Abing * * * *
Diettop * * * *
Assolo * * * * *
Wbest * * * * *
Traceband * * * *
Table 5. Estimation tools selected
Tool Num. evaluated times
IGI 9
Pathload 22
PTR 7
PatChirp 12
Wbwest 11
Abing 2
Diettop 3
Traceband 3
Assolo 4
5. Results
The ABET were evaluated in the Tb described in the previous section, using a real bandwidth of 100Mbps, and 1Gbps interfaces that work. the available bandwidth, time estimate, allowing recalculating and precision of the tool was measured. The RE is defined as the ratio between the estimated value mAB and the actual value µAB and is measured
in percentage terms and is given by:
𝑒𝑟𝑟𝑜𝑟 = ((𝑚𝐴𝐵− 𝜇𝐴𝐵)/𝜇𝐴𝐵) ∗ 100%. (6)
5.1 Generalities
Initially looking at the results in a general way. Table 6 shows the results of experiments with cross-traffic 30%, where the av_bw channel must be of 70Mbps. Of the eight tools, 7 had a high RE (low accuracy) between 7% and 48% (underestimating channel) only Pathload showed high precision with an error between 1% to 5%. Regarding the OET, Pathload showed up to 14.01%, otherwise the rest was relatively low ranging from 0.03% and 2.72%. And regarding the estimation time Abing, PathChirp, IGI, PTR and Assolo, showed a low yield reaching times between 14.25s to 250.56s, otherwise the rest of the tools had only one maximum of 7.53s.
Table 6. Performance metrics with 30 % of TC in a tight 100Mbps link
Metrics RE (%) OET (%) ET (sec)
Tools Min Max Min Max Min Max
Abing 0.14 0.26 0.06 0.13 76.91 89.63
Assolo -0.23 0.21 2.21 2.51 56.48 64.52
Diettopp -0.16 -0.12 0.33 2.72 8.75 71.61
IGI 0.27 0.68 0.09 1.56 14.25 83.70
PTR 0.08 0.24 0.03 1.98 14.25 83.70
PathChirp -0.06 0.11 0.29 0.31 84.48 250.56
Pathload 0.01 0.05 7.73 14.01 5.73 7.53
Traceband -0.07 0.13 1.96 2.30 0.63 0.73
International Journal of Communication Networks and Information Security (IJCNIS) Vol. 9, No. 3, December 2017
For CT 60%, the behavior of the tools does not vary to a large degree, as shown in Table 7. Abing where underestimates1 the channel bandwidth by 48% while Assolo, Traceband, Wbest, Diettopp, IGI/PTR and PathChirp present ER between 13% (underestimating) and 47%. For OET, Pathload behavior shows the highest-level gain 10.12% in each estimate, while other tools had a minimum of 0.06% and a maximum of 2.8%. And regarding the duration of the estimate in this type of scenario, Wbest, Traceband and Pathload, have a low estimation time between (0.62 and 6.99)s. While the rest of the tools shown times between (89.63-251)s.
Finally, the tools with 0% of CT were evaluated. The results are shown in the Table 8. The behavior of most tools shows an ER between -0.09% and 0.00% considered low; the tool being Traceband 0.0% of RE, contrary to this IGI and the PTR reached -22% of ER. According to OET, Abing had the lowest that all tools with a maximum of 0.19%, contrary to Pathload which is the most intrusive tool with a maximum of 17.80%. The tool with the highest ET was Assolo, with a maximum of 62.04s; in contrast to this, Traceband was the fastest tool converge with maximum 0.77s. The other tools were between (2.21 and 13.89)s.
Additionally, the experimentation allowed to prove, that when cross-traffic 70% or more, none of the 9 tools evaluated, managed to make the estimate scale; opening this space for various hypotheses on estimation of av_bw in segments end-to-end really congested Internet.
Table 7. Performance metrics with 60% of TC in a tight 100Mbps link
Metrics RE (%) OET (%) ET (sec)
Tools Min Max Min Max Min Max
Abing -48.50 0.22 0.06 0.14 76.15 87.81
Assolo -0.16 0.21 2.21 2.51 56.48 64.56
Diettopp -0.17 0.25 0.43 2.80 8.80 71.67
IGI 0.09 0.24 0.01 1.60 14.25 83.70
PTR 0.22 0.47 0.21 2.09 6.25 83.70
PathChirp -0.19 0.31 0.29 0.31 85.69 251.0
Pathload -0.09 -0.04 2.54 10.12 6.78 6.99
Traceband -0.13 0.23 1.90 2.27 0.63 0.76
Wbest -0.15 0.25 0.1 0.35 0.62 0.91
5.2 Tools accuracy
The accuracy is an important metric for estimation tool because its allows to know the level of reliability of the same and thus be certain that the measurement obtained. Also, the different services that use the av_bw as a metric to determine the levels of quality of service offered to its users, especially which work in real time.
Table 8. Performance metrics with 0% of CT in a tight 100Mbps link
Metrics RE (%) OET (%) ET (sec)
Tools Min Max Min Max Min Max
Abing 0.02 0.04 0.14 0.19 9.91 13.89
Assolo -0.17 -0.08 2.43 2.81 23.89 62.04
Diettopp 0.03 0.04 2.37 4.55 9.11 12.39
IGI -0.17 -0.09 4.66 8.78 2.21 3.92
PTR -0.22 -0.08 4.66 8.78 2.21 3.92
PathChirp -0.18 0.00 2.53 2.82 5.73 11.42
Pathload -0.04 -0.02 8.27 17.80 6.74 10.59
Traceband 0.00 0.00 1.87 2.43 0.59 0.77
Wbest -0.07 -0.04 0.17 0.62 1.76 6.41
1 It’s mean values whose measure are below the real or ideal expected
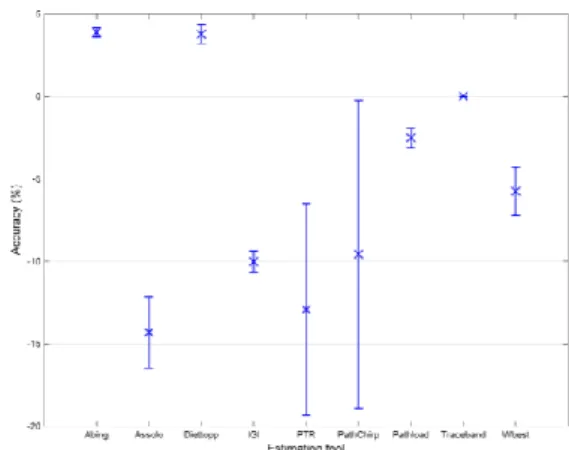
The experiments showed that the RE tools on a stage with 0% CT, such as PTR and PathChirp have the lowest accuracy, reaching the 19%, underestimating the channel. On the other hand, Diettopp, Wbest and IGI, have intermediate levels of errors, but still far from acceptable. It’s stresses that Traceband is completely accurate with 0.0% when the CT is 0%; see Figure 5.
The Figures 6 and 7, show ER behavior of ABET with 30% and 60% of CT. Where the most precise tool in any scenario CT is Pathload, which reaches a maximum of 10% of ER, underestimating the channel. On the other hand, the less accurate tools are Abing, Assolo, PTR and PathChirp; which reach an ER between 30% to 60%.
5.3 Estimation tools overhead
Evaluating the tools in the three scenarios mentioned in a channel with a bottleneck of 100Mbps, we find that all are intrusive and have varying levels of OET, in relation to the estimation technique used by each tool, which can be PP/TD, slops, TOPP, ICIM, among others. Where the tools evaluated based on PP/TD, used between 1000 and 1500 test packets with size between (1024 and 1520) bytes; Depending on the parameters it receives the application, reaching OET 12Mbps 100Mbps on a channel. And based on slops, they reach up to 25Mbps 100Mbps use for estimating packets up to 1520Bytes.
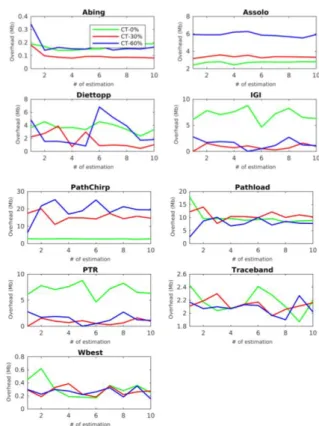
An individual analysis tool, it’s shows in the Figure 8, which shows the behavior of OET, in the three scenarios evaluated 0% 30% to 60% of CT. Where it is important to emphasize that the tools base their technique PP/TD, with a maximum of 9Mbps, use the least amount of additional traffic, to perfect an estimate of av_bw, Abing and Wbest being less intrusive tools. Contrary to using SloPs, reaching to flood the channel with 25Mbps evaluated, being Pathchirp the most intrusive tool. Additionally, the TOPP technique, which inserts around 7Mbps to the network evaluated.
Given that each tool has its own OET, and based on the scale of NOET, we can classify each tool, about its average OET by scenario evaluated. From what we can determine, the ABET using SloPs and TOPP technique, have on average NOET between ML and M. On the other hand, it’s using PPD/PTD, NOET are located between L and ML. Complete ranking can be seen in Table 9.
International Journal of Communication Networks and Information Security (IJCNIS) Vol. 9, No. 3, December 2017
Figure 6. RE of ABET congested network with 30% of CT
Figure 7. RE of ABET congested network with 60% of CT
Each tool for estimating spends time known as ET. This time mostly proportion is consumed for the tool to converge (get the measure of av_bw). Each estimation technique used by the tools, according to the methodology used different times of convergence, which impacts negatively on the performance of the tool, should be very high.
Figure 9 shows that the tools they use estimation technique PP/TD, with 0% CT, have the lowest convergence time, reaching a maximum of 10s. In contrast to the behavior on stage 30% to 60% of CT, which can reach the 90s; except for Traceband and Wbest tools, whose ET is between (1-7)s. For slops based tools, each tool changes it’s behavior for each scenario assessed. Assolo and Pathchirp are the tools with the worst performance, because in all three scenarios, reaching to spend ET ranging between (10-250)s. Finally, the Diettopp tool, which uses its own technical TOPP, reaching up to converge ET 80s.
Table 9. OET level of evaluated tools
Tool
M
et
h
od
0%
-CT
L
eve
l
30%
-CT
L
eve
l
60%
-CT
L
eve
l
IGI PPD/PTD 7.03 ML 0.17 L 0.1 L PTR PPD/PTD 7.03 ML 1.49 L 0.84 L Traceband PPD/PTD 2.17 ML 2.13 ML 2.08 L Wbest PPD/PTD 0.31 L 0,27 ML 0,26 ML Abing PPD/PTD 0.16 L 0.10 L 0.17 L PathChirp SLoPs 2.71 ML 5.9 ML 3.37 ML Pathload SLoPs 10.02 M 19.2 M 15.45 M Assolo SLoPs 2.70 ML 7.69 ML 10.82 M Diettopp TOPP 3.66 ML 2.95 ML 1.68 L
It is known that the closer is at zero (0%) the RE of ABET, it is considered more accurate. This accuracy can be affected due to the amount of OET inserted to the network, to get an estimation. Therefore, it is important to analyze that
relationship and impact has the OET on the accuracy of measurement of av_bw.
Figure 8. OET generated by the tools in each estimate in different scenarios (0, 30 and 60)% of CTE of ABET
Figure 9. Time spent by each tool to perfect an estimate of av_bw, in scenarios with (0, 30 and 60)% of CTE of ABET
5.4 OET vs RE
International Journal of Communication Networks and Information Security (IJCNIS) Vol. 9, No. 3, December 2017
percentage of RE, where Pathchirp with OET between (3-5)Mb, RE reaches 18% (underestimating the av_bw). Similarly, Pathload OET mode between (9-18)Mb underestimates the channel to 3%. This indicates that when the CT continues to increase 30% to 60%, more tools inserted OET, in turn increasing the RE. Keeping the directly proportional relationship between the two metrics, as shown in the Figure 10. This behavior can also be seen in Figures 11 and 12, where Wbest and Traceband tools maintain on average a lower OET, such as the percentage of CT increases, its RE also.
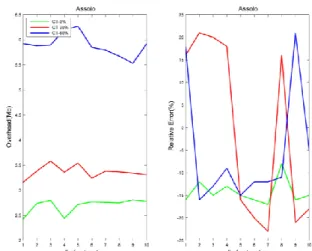
For tools as Assolo and Diettopp, OET behavior in the three scenarios shown in Figures 13 and 14 respectively; They show that both reach a maximum OET 7Mb to perfect an estimation, but rises to RE 25% when the CT 60%.
5.5 OET vs ET
The time spent for an ABET to perfect an estimate of av_bw, is a very important metric when the measurement is used for setting quality of service on applications or real time. Therefore, this analysis can show the relationship between the amount of OET and the impact on the speed of the tool. Analyzing the results shown in Figures 15 and 16, indicate that CT (30 and 60)%, the OET used reaches 25Mb of assessed canal, causing the tools Diettopp and reach Pathchirp spend between (80 and 250)s to estimate; the opposite happens when no CT, where most tools use 11s is used; Showing direct proportionality between increased ET, when the OET used by the tool is greater, to achieve perfect an estimate of av_bw.
The behavior of the OET, on stage 30% to 60% is not high for Traceband with 2.4Mb, using PP/TD technique; Pathload opposite reaching 13Mb. But Pathload shows the worst performance of the SloPs technique used for the estimation, when evaluated without CT, because it injects to the network to 18Mb OET and uses approximately 11s ET; checking that there is a direct relationship between the increase of ET and OET, this can be seen in the Figure 17.
Figure 10. OET and RE generated by Pathchirp in different scenarios with (0, 30 and 60)% of CT
Figure 11. OET and RE generated by Wbest in different scenarios with (0, 30 and 60)% of CT
Figure 12. OET and RE generated by Traceband in different scenarios with (0, 30 and 60)% of CT
International Journal of Communication Networks and Information Security (IJCNIS) Vol. 9, No. 3, December 2017
Figure 14. OET and RE generated by Diettopp in different scenarios with (0, 30 and 60)% of CT
Figure 15. OET vs ET of Pathchirp in different scenarios with (0, 30 and 60)% of CT
Figure 16. OET vs ET of Pathload in different scenarios with (0, 30 and 60)% of CT
Figure 17. OET vs ET of Traceband in different scenarios with (0, 30 and 60)% of CT
6. Conclusions and perspectives
The intrusive character of the ABET for estimation, are the main weakness of the tools to estimate av_bw in highly congested network links around a 70%. Likewise, the average overhead of tools like Pathload, high percentage contrasts with accuracy in estimating when the channel has 30% of TC. Also, Abing with low overhead, but reaches an error until 48% with CT 60%. Allowing say that for tools, the measurement accuracy of av_bw is inversely proportional to the percentage of overhead? Regarding methodologies or techniques used to estimate av_bw by existing tools, an imbalance with respect to the actual amount of test packets to be used for the measurement of av_bw was found
In analyzing the relationship between ET, the RE and the OET, it was found that the ABET Pathload, which is the most precise tool in the two scenarios evaluated RE maximum of 1%, in contrast, has the highest level of OET of all the tools with maximum of 14.01%. In addition, the tool less accurately Abing, which underestimates the channel to 48%, its lowest OET is 0.06%; which clearly shows an inverse relationship of these two metrics. On the other hand, with respect to TE and ER, tools like Pathchirp, Abing, Assolo, Diettopp, IGI and PTR; ET between (6.25-250)s, and an ER underestimating the channel between 6% and 48% respectively; these values that would be acceptable to consider an ABET as accurate; but its high estimate excludes time environments, applications that demand is real-time metrics. So, this measure would be valid for the performance nature of Internet traffic. This behavior is also found in ABET like Abing, Assolo, Diettopp and IGI and PTR. Also, by observing the behavior of all ABET in both scenarios (30-60)%; whose ET (251s max) and RE (47% max) are the highest, it is evident that the OET (2.80% max) is relatively low, leading to the need to review each technique or method of estimation each ABET, which makes its own premises convergence values.
International Journal of Communication Networks and Information Security (IJCNIS) Vol. 9, No. 3, December 2017
estimation technique, because the ABET using PPT/PTD, with close to 0% of CT scenarios, spent less time than using slops, the which peaked 60s to perfect an estimate. In scenarios saturated with more than 30%, in 6 of 9 ABET; Its ET, increased directly proportional to the increase of the OET. At the level of operating systems, the revised tools have incompatibility with architectures X86_64. Otherwise it happens with i686 platforms. Most generators do not allow climbing analyzed the CT, which is inserted into the network, MGEN and tcpreplay only support such a feature. We also found that the tools evaluated not work (not perform estimation) when the CT inserted exceeds 60%, allowing hypothesize, are able current detected with high precision ABET if a communication channel is congested?
The challenges and efforts in that area should focus research estimating the available bandwidth, to the improvement of the metric should be directed to two aspects. First, create estimation techniques that minimize the use of test packets. And second, creating faster tools to eliminate the use of the operating system to perform critical operations estimate. Which allowed more precise tools and deliver results in ideal time for real-time applications.
Acknowledgement
The author Dixon Salcedo, be grateful for COLCIENCIAS and the Universidad de la Costa due to the funding of the research stay and the Universidad Autónoma de Bucaramanga, which facilitated the development of research. To the Universidad Pontificia Bolivariana, where he develops the PhD studies in Engineering.
References
[1] E. Zhang, “Bandwidth Estimation for Virtual Networks,” PhD thesis, University of Nebraska Lincoln, 2015.
[2] S. Baghermousavi, H. Rashidi, and H. Haghighi, “An approach to reduce qos monitoring overhead in ESB,” in e-Commerce in Developing Countries: With Focus on e-Trust (ECDC), 2014 8th International Conference on, pp. 1–5, 2014.
[3] S. Lee, K. Levanti, and H. Kim, “Network monitoring: Present and future,” Computer Networks, Vol. 65, pp. 84 – 89, 2014. [4] A. Botta, A. Davy, B. Meskill, and G. Aceto, “Active
techniques for available bandwidth estimation: Comparison and application,” in Data Traffic Monitoring and Analysis (E. Biersack, C. Callegari, and M. Matijasevic, eds.), Vol. 7754 of Lecture Notes in Computer Science, pp. 28–43, Springer Berlin Heidelberg, 2013.
[5] M. Li, Y. Wu, and C. Chang, “Available bandwidth estimation for the network paths with multiple tight links and bursty traffic,” Journal of Network and Computer Applications, Vol. 36, no. 1, pp. 353 – 367, 2013.
[6] S. Nam, S. Kim, S. Lee, and H. Kim, “Estimation of the available bandwidth ratio of a remote link or path segments,” Computer Networks, Vol. 57, no. 1, pp. 61–77, 2013.
[7] C. Guerrero and M. Labrador, “A hidden markov model approach to available bandwidth estimation and monitoring,” in Internet Network Management Workshop, 2008. INM 2008. IEEE, pp. 1–6, 2008.
[8] N. Jeyanthi, N. C. Iyengar, P. Kumar, and A. Kannammal, “An enhanced entropy approach to detect and prevent DDoS in cloud environment,” International Journal of Communication Networks and Information Security, Vol. 5, no. 2, pp. 110, 2013.
[9] A. K. Paul, A. Tachibana, and T. Hasegawa, “Next: New enhanced available bandwidth measurement technique, algorithm and evaluation,” in 2014 IEEE 25th Annual
International Symposium on Personal, Indoor, and Mobile Radio Communication (PIMRC), pp. 443–447, IEEE, 2014. [10]K. Chan, “Testing and Measurement: Techniques and
Applications,” Proceedings of the 2015 International Conference on Testing and Measurement Techniques (TMTA 2015), pp. 16-17, January 2015, Phuket Island, Thailand. CRC Press, 2015.
[11]J. Kim and Y. Lee, “An end-to-end measurement and monitoring technique for the bottleneck link capacity and its available bandwidth,” Computer Networks, Vol. 58, pp. 158 – 179, 2014.
[12]C. Guerrero and D. Morillo, “On the reduction of the available bandwidth estimation error through clustering with k-means,” in 2012 IEEE Latin-America Conference on Communications, pp. 1–5, 2012.
[13]A. Ali, F. Michaut, and F. Lepage, “End-to-end available bandwidth measurement tools: A comparative evaluation of performances,” CoRR (Computing Research Repository), Vol. abs/0706.4004, p. 13, 2007.
[14]G. Urvoy-Keller, T. En-Najjary, and A. Sorniotti, “Operational com parison of available bandwidth estimation tools,” SIGCOMM Comput. Commun. Rev. Vol. 38, pp. 39–42, 2008.
[15]S. Nam, S. Kim, and D. Sung, “Estimation of available bandwidth for a queueing system,” Applied Mathematical Modelling, Vol. 33, no. 8, pp. 3299 – 3308, 2009.
[16]C. Man, G. Hasegawa, and M. Murata, “A simultaneous inline measurement mechanism for capacity and available bandwidth of end to end network path,” IEICE TRANSACTIONS on Communications, Vol. E89-B No.9, pp. 2469 – 2479, 2006.
[17]V. Ribeiro, R. Riedi, R. Baraniuk, J. Navratil, and L. Cottrell, “Pathchirp: Efficient available bandwidth estimation for network paths,” DARPA/AFRL, NSF, Texas Instruments, SLAC - Stanford, 2003.
[18]R. Kapoor, C. Lao, L. Chen, Gerla, and Y. Sanadidi, “Capprobe: A simple and accurate capacity estimation technique,” in ACM SIGCOMM Computer Communication Review, Vol. 34, pp. 67–78, 2004.
[19]C. Guerrero and M. Labrador, “Experimental and analytical evaluation of available bandwidth estimation tools,” in Local Computer Networks, Proceedings 2006 31st IEEE Conference on, pp. 710–717, 2006.
[20]A. Shriram, M. Murray, Y. Hyun, N. Brownlee, A. Broido, M. Fomenkov, and K. Claffy, “Comparison of public end-to-end bandwidth estimation tools on high speed links,” in Proceedings of the 6th International Conference on Passive and Active Network Measurement, PAM’05, (Berlin, Heidelberg), pp. 306–320, 2005.
[21]M. Jain and C. Dovrolis, “Ten fallacies and pitfalls on end-to-end available bandwidth estimation,” in Proceedings of the 4th ACM SIGCOMM Conference on Internet Measurement, IMC ’04, (New York, NY, USA), pp. 272–277, 2004. [22]U. Nguyen, D. Tran, and G. Nguyen, “A taxonomy of applying
filter techniques to improve the available bandwidth estimations,” in Proceedings of the 8th International Conference on Ubiquitous Information Management and Communication, ICUIMC ’14, (New York, NY, USA), pp. 18:1–18:8, 2014.
[23]H. Zhou, Y. Wang, X. Wang, and X. Huai, “Difficulties in estimating available bandwidth,” in Communications, 2006. ICC ’06. IEEE International Conference on, Vol. 2, pp. 704– 709, June 2006.
[24]F. Michaut and F. Lepage, “Application-oriented network metrology: Metrics and active measurement tools,” Communications Surveys Tutorials, IEEE, Vol. 7, pp. 2–24, Second 2005.
International Journal of Communication Networks and Information Security (IJCNIS) Vol. 9, No. 3, December 2017
[26]J. Kiciński and K. Nowicki, “Using statistical methods to estimate the worst case response time of network software running on indeterministic hardware platforms,” Journal of Computer Science and Software Application, Vol. 1, pp. 42-62, 2014.
[27]C. Man, G. Hasegawa, and M. Murata, “Inline bandwidth measurement techniques for gigabit networks,” Int. Journal. Internet Protoc. Technol. IJIPTCao LE THANH MAN, Vol. 3, pp. 81–94, 2008.
[28]G. Aceto, A. Botta, A. Pescapè, and M. D’Arienzo, “Unified architecture for network measurement: The case of available bandwidth,” Journal of Network and Computer Applications, Vol. 35, no. 5, pp. 1402– 1414, 2012.
[29]J. Strauss, D. Katabi, and F. Kaashoek, “A measurement study of available bandwidth estimation tools,” in Proceedings of the 3rd ACM SIGCOMM Conference on Internet Measurement, IMC ’03, (New York, NY, USA), pp. 39–44, 2003.
[30]M. Jain and C. Dovrolis, “Pathload: A measurement tool for end-to-end available bandwidth,” in In Proceedings of Passive and Active Measurements (PAM) Workshop, pp. 14–25, 2002.
[31]N. Hu and P. Steenkiste, “Evaluation and characterization of available bandwidth probing techniques,” Selected Areas in Communications, IEEE Journal, Vol. 21, pp. 879–894, 2003. [32]S. Abolfazli, Z. Sanaei, S. Wong, A. Tabassi, and S. Rosen,
“Throughput measurement in 4G wireless data networks: Performance evaluation and validation,” in Computer Applications & Industrial Electronics (ISCAIE), 2015 IEEE Symposium on, pp. 27–32, 2015.
[33]B. Cavusoglu and E. Oral, “Estimation of available bandwidth share by tracking unknown cross-traffic with adaptive extended kalman filter,” Computer Communications, Vol. 47, no. 58, pp. 34–50, 2014.
[34]K. Dichev, F. Reid, and A. Lastovetsky, “Efficient and reliable network tomography in heterogeneous networks using bittorrent broadcasts and clustering algorithms,” in Proceedings of the International Conference on High Performance Computing, Networking, Storage and Analysis, SC ’12, (Los Alamitos, CA, USA), pp. 36:1–36:11, 2012. [35]L. Daniel and M. Kojo, “Enhancing TCP with cross-layer
notifications and capacity estimation in heterogeneous access networks,” in Local Computer Networks (LCN), 2012 IEEE 37th Conference on, pp. 392–400, 2012.
[36]P. Vuletić and J. Protić, “Self-similar cross-traffic analysis as a foundation for choosing among active available bandwidth measurement strategies,” Computer Communications, Vol. 34, no. 10, pp. 1145 – 1158, 2011.
[37]F. Thouin, M. Coates, and M. Rabbat, “Large scale probabilistic available bandwidth estimation,” Computer Networks, Vol. 55, no. 9, pp. 2065 – 2078, 2011.
[38]P. Dely, A. Kassler, L. Chow, N. Bambos, N. Bayer, H. Einsiedler, and C. Peylo, “BEST-AP: Non-intrusive estimation of available bandwidth and its application for dynamic access point selection,” Computer Communications, Vol. 39, pp. 78 – 91, 2014.
[39]Z. Yuan, H. Venkataraman, and G. Muntean, “MBE: Model-based available bandwidth estimation for IEEE 802.11 data communications,” Vehicular Technology, IEEE Transactions on, Vol. 61, pp. 2158–2171, 2011.
[40]Z. Yuan, H. Venkataraman, and G. Muntean, “iBE: A novel bandwidth estimation algorithm for multimedia services over IEEE 802.11 wireless networks,” in Proceedings of the 12th IFIP/IEEE International Conference on Management of Multimedia and Mobile Networks and Services: Wired-Wireless Multimedia Networks and Services Management, MMNS 2009, (Berlin, Heidelberg), pp. 69–80, 2009.
[41]M. Alzate, J. Pagan, N. Pena, and M. Labrador, “End-to-end bandwidth and available bandwidth estimation in multi-hop IEEE 802.11b ad hoc networks,” in Information Sciences and
Systems, 2008. CISS 2008. 42nd Annual Conference on, pp. 659–664, 2008.
[42]M. Ergin, M. Gruteser, L. Luo, D. Raychaudhuri, and H. Liu, “Available bandwidth estimation and admission control for QoS routing in wireless mesh networks,” Computer Communications - Special Issue: Resource Management and routing in Wireless Mesh Networks, Vol. 31, no. 7, pp. 1301– 1317, 2008.
[43]K. Lakshminarayanan, V. Padmanabhan, and J. Padhye, “Bandwidth estimation in broadband access networks,” in Proceedings of the 4th ACM SIGCOMM Conference on Internet Measurement, IMC ’04, (New York, NY, USA), pp. 314–321, 2004.
[44]J. Navratil and R. Cottrell, “ABwE: A practical approach to available bandwidth estimation,” in In Passive and Active Measurement (PAM) Workshop 2003 Proceedings, La Jolla, 2003.
[45]E. Goldoni, G. Rossi, and A. Torelli, “Assolo, a new method for available bandwidth estimation,” in Internet Monitoring and Protection, 2009. ICIMP’09. Fourth International Conference on, pp. 130–136, 2009.
[46]A. Johnsson, B. Melander, and M. Bjӧrkman, “Diettopp: A first implementation and evaluation of a simplified bandwidth measurement method,” in Second Swedish National Computer Networking Workshop, Vol. 5, 2004.
[47]C. Guerrero and M. Labrador, “Traceband: A fast, low overhead and accurate tool for available bandwidth estimation and monitoring,” Computer Networks, Vol. 54, no. 6, pp. 977 – 990, 2010.
[48]M. Li, M. Claypool, and R. Kinicki, “Wbest: A bandwidth estimation tool for IEEE 802.11 wireless networks,” in 2008 33rd IEEE Conference on Local Computer Networks (LCN), pp. 374–381, IEEE, 2008.
[49]A. Turner and M. Bing, “Tcpreplay: Pcap editing and replay tools for*nix,” online], http://tcpreplay. sourceforge. net, 2005.
[50]V. Jacobson, “Congestion avoidance and control,” in ACM SIGCOMM computer communication review, Vol. 18, pp. 314–329, 1988.
[51]V. Jacobson, “Pathchar: a tool to infer characteristics of internet paths,” in Mathematical Sciences Research Institute- MSRI of National Science Foundation Division of Mathematical Sciences-NSF, 1997.
[52]V. Paxson, “End-to-end internet packet dynamics,” SIGCOMM Comput. Common. Rev, Vol. 27, pp. 139–152, 1997.
[53]V. Paxson, “Fast, approximate synthesis of fractional gaussian noise for generating self-similar network traffic,” ACM SIGCOMM Computer Communication Review, Vol. 27, no. 5, pp. 5–18, 1997.
[54]D. Villa and C. Castellanos, “Study of available bandwidth estimation techniques to be applied in packet-switched mobile networks,”. Aalborg University. Department of Communication Technology, 2006.
[55]R. Prasad, C. Dovrolis, M. Murray, and K. Claffy, “Bandwidth estimation: Metrics, measurement techniques, and tools,” Network, IEEE, Vol. 17, pp. 27–35, 2003.
[56]M. Jain and C. Dovrolis, “End-to-end available bandwidth: Measurement methodology, dynamics, and relation with TCP throughput,” Networking, IEEE/ACM Transactions on, Vol. 11, pp. 537–549, 2003.
[57]A. Downey, “Using pathchar to estimate internet link characteristics,” SIGCOMM Comput. Commun. Rev, Vol. 29, pp. 241–250, 1999.
[58]A. Botta, A. Pescapè, and G. Ventre, “On the performance of bandwidth estimation tools,” in Systems Communications, 2005. Proceedings, pp. 287–292, 2005.
International Journal of Communication Networks and Information Security (IJCNIS) Vol. 9, No. 3, December 2017
[60]E. Goldoni and M. Schivi, “End-to-end available bandwidth estimation tools, an experimental comparison,” Traffic Monitoring and Analysis, Vol. 6003 of Lecture Notes in Computer Science, pp. 171–182, 2010.
[61]Z. Xiaodan, “The application-orientated measurement performance evaluation of the end-to-end available bandwidth,” in Advanced Research and Technology in Industry Applications (WARTIA), 2014 IEEE Workshop on, pp. 573–577, 2014.
[62]A. K. Paul, A. Tachibana, and T. Hasegawa, “Next-fit: Available bandwidth measurement over 4G/LTE networks–a curve-fitting approach,” in 2016 IEEE 30th International Conference on Advanced Information Networking and Applications (AINA), pp. 25–32, 2016.
[63]P. Low and M. Alias, “Enhanced bandwidth estimation design based on probe-rate model for multimedia network,” in Telecommunication Technologies (ISTT), 2014 IEEE 2nd International Symposium on, pp. 198–203, 2014.
[64]H. Sadeghian, A. Farahani, and M. Abbaspour, “Overhead-controlled contention-based routing for vanets,” International Journal of Communication Networks and Information Security, Vol. 6, no. 2, p. 118, 2014.
[65]J. Akpojaro, P. Aigbe, and D. Oyemade, “A cost-based approach for analysis the overheads of multicast protocols in non-strictly hierarchical networks,” International Journal of Communication Networks and Information Security, Vol. 3, no. 1, p. 67, 2011.
[66]G. Jin and B. L. Tierney, “System capability effects on algorithms for network bandwidth measurement,” in Proceedings of the 3rd ACM SIGCOMM conference on Internet measurement, pp. 27–38, 2003.
[67]M. Zec, M. Mikuc, and M. Zagar, “Estimating the impact of interrupt coalescing delays on steady state TCP throughput,” in International Conference on Software, Telecommunications and Computer Networks (SoftCOM), 2002.
[68]Z. Hu, D. Zhang, A. Zhu, Z. Chen, and H. Zhou, “SLDRT: A measurement technique for available bandwidth on multi-hop path with bursty cross traffic,” Computer Networks, Vol. 56, no. 14, pp. 3247 – 3260, 2012.
[69]D. Croce, M. Mellia, and E. Leonardi, “The quest for bandwidth estimation techniques for large-scale distributed systems,” SIGMETRICS Perform. Eval. Rev, Vol. 37, pp. 20–25, 2010.
[70]C. Man, G. Hasegawa, and M. Murata, “IMTCP: TCP with an inline measurement mechanism for available bandwidth,” Computer Communications, Vol. 29, no. 10, pp. 1614–1626, 2006.
[71]C. Man, G. Hasegawa, and M. Murata, “Available bandwidth measurement via TCP connection,” in In Proceedings of IFIP/IEEE MMNS 2004 (E2EMON Workshop, pp. 38–44, 2004.