Young People in the Labour Market, 2014
Coverage: UK
Date: 05 March 2014
Geographical Area: Local Authority and County
Theme: Labour Market
Young People in the Labour Market
• The number of people aged 16 to 24 in full-time education has more than doubled over the last 30 years
• 69% of young people not in full-time education were employed at the end of 2013
• The proportion of young people undertaking work alongside full-time study has been falling since the year 2000
• Young people are most likely to work in the lowest skilled jobs in the economy • In the final quarter of 2013 the youth unemployment rate was similar to that in 1984 • Around 13 in every 100 young people were unemployed, in the final quarter of 2013
• The youth unemployment rate in the UK was lower than the European Union average in 2013 • Wokingham had the highest youth employment rate, for those not in full-time education, across
England and Wales
• Hartlepool and Wolverhampton had the highest unemployment rates for young people who are not in full-time education across England and Wales
• Barking and Dagenham had the highest inactivity rate for young people who are not in full-time education across England and Wales
• Of all young people across local areas, Barking and Dagenham has the highest percentage who state they are not working because they are looking after the family or home. Neath Port Talbot has the highest percentage who say they are long term sick or disabled.
Participation in full-time education
The number of young people in full-time education has more than doubled over the last 30 years
At the end of 2013, 3.03 million (42%) people aged 16 to 24 were in full-time education, up from 1.42 million (17%) in 1984. This increase has happened against a backdrop of a falling youth population, which at 7.20 million is one million lower than in 1984, when it was 8.20 million. The overall population of the UK has increased over the same period.
Figure 1: The percentage of people aged 16 to 24 in full-time education, 1984 to 2013
Source: Labour Force Survey - Office for National Statistics Download chart
XLS format (304 Kb)
Note that in this report data prior to 1992 is for each year in March to May and not seasonally adjusted. However it is our best estimate of the youth labour market for the time.
The number of young people in full-time education rose steadily from 1984 to 1998 where 2.3 million (37%) were in full-time education. Around 1997, there was a sharp rise in those in full-time education and this increase happened around the time of one of the biggest changes in higher education funding for 30 years, when student grants were stopped and some tuition fees were introduced. After 1998 the number continued to increase but at a slower rate than during the 1980s and 1990s. In 2008, at the start of the economic downturn in the UK, there were 2.8 million in full-time education and there was then a sharp increase after 2008 which may in part reflect more young people staying in full-time education at a time when employment opportunities were lower than
education at the end of 2013, up from 50% in 1984. For 18 to 24 year olds, 32% were in full-time education at the end of 2013, up from 8% in 1984.
Most young people not in full-time education were employed at the end of 2013
A young person’s participation in the labour market, either in work (employed) or available and looking for work (unemployed), varies by whether they are in full-time education or not. To look at these groups separately may give a better indication of the different circumstances young people are in. Government labour market policies are principally aimed at those who have left full-time education and are not in work.
Figure 2: Participation of 16 to 24 year olds in the labour market by whether they are in full-time education or not, 1984 to 2013
Source: Labour Force Survey - Office for National Statistics Download chart
XLS format (153.5 Kb)
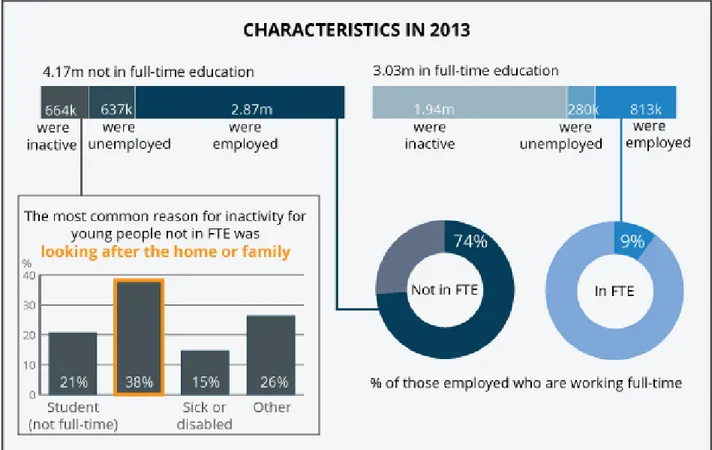
Of the 4.17 million young people not in full-time education in the final quarter of 2013, 2.87 million (69%) were in employment. Of the remaining, 637,000 (15%) were unemployed, which means they were actively seeking and available to work, and 664,000 (16%) were inactive. Of those who were
Figure 3: Participation of 16 to 24 year olds in the labour market by whether they are in full-time education or not, 2013
Source: Labour Force Survey - Office for National Statistics Download chart
XLS format (71.5 Kb)
Those undertaking work alongside full-time study has been falling since the year 2000 The majority of young people in full-time education are inactive and at the end of 2013, 64% of students (1.94 million) were not seeking or available to work. Around 9% (280,000) of full-time students aged 16 to 24 were unemployed with the remaining 27% (813,000) in employment. The percentage of those who combine work and full-time study has been falling since the year 2000, when it peaked at 41%. Most of this fall has happened since 2005 and at the end of 2013 the
percentage of students in work was similar to the mid 1980s. Combining work with study does have its benefits. The transition from education to joining the workforce may be more difficult without any prior work experience, which can help develop competencies and skills not learned on an educational course.
Focusing on those in employment around 74% of young people not in full-time education worked full-time compared with just 9% for full-time students.
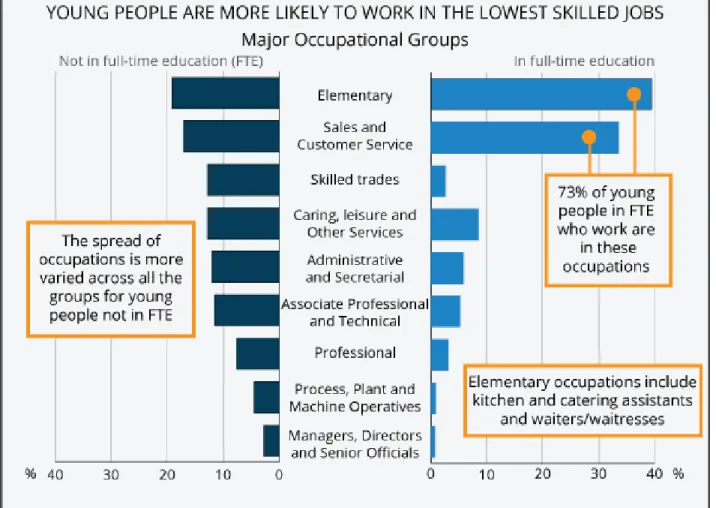
Young people who are in work, regardless of if they are in full-time education or not, are most likely to be working in the lowest skilled occupation group known as elementary occupations. This group contains jobs such as kitchen/catering assistants and waiters/waitresses. The second most common occupational group that young people work in is sales and customer service occupations. In 2013, using a four quarter average across the year, for those who worked alongside full-time study these two occupational groups accounted for almost three-quarters (73%) of all those in employment. For those not in full-time education the equivalent figure is 36% with 19% working in elementary occupations and a further 17% working in sales and customer service occupations. The spread across all the occupation groups was more varied for those working and not in full-time education compared with those working alongside studying. By comparison, for people aged 25 to 64 the largest occupational group was professional occupations, in which 22% work, followed by associate professional and technical occupations at 15%.
Overall young people in full-time education work in part-time lesser skilled jobs, however they may still develop some valuable work experience for future careers.
Figure 4: Occupations of young people in employment by whether they are in full-time education or not, 2013
Download chart XLS format (43.5 Kb)
Youth Unemployment
In the final quarter of 2013 the youth unemployment rate was similar to that in 1984
For young people at the end of 2013 the unemployment rate, measured as a proportion of the labour force rather than the total population, was 20%. This was similar to the position in 1984, following the 1980s recession and was higher than the peak of 18% in 1993 following the 1990s recession. The youth unemployment rate peaked at 22% towards the end of 2011, following the UK economic downturn in 2008.
It is important to take in to account the changes to participation in full-time education has had on these figures. The majority of full-time students are inactive which means that within the youth population overall more full-time students means less young people in the labour market (those employed and unemployed). This can impact on the unemployment rate which shows the proportion of young people who are unemployed in relation to those active in the labour market.
The unemployment rate is the preferred international measure for unemployment, as decided by the International Labour Organisation. It is calculated as follows:
Unemployment rate
When more people remain inactive, the number in the economically active population decreases. Therefore the unemployment rate increases even if the number unemployed does not change. To overcome this, when looking at young people, it is it useful to look at the unemployment proportion. This measures the percentage of unemployed people out of all people regardless of whether they are active in the labour market or inactive. This is:
Unemployment proportion
Switching between employment and inactivity, which for young people is likely to be because of being in education, has no impact on the proportion.
In the final quarter of 2013 around 13 in every 100 young people were unemployed Figure 5: Unemployment rate and proportion by age group, 1984 to 2013
Download chart XLS format (91 Kb)
The unemployment proportion in the final quarter of 2013 stood at 13%, lower than in 1984 (15%). The gap between the unemployment rate and the proportion increased most during the early 1990s and the recession of 2008/09, when there were sharp rises in the number of people in full-time education.
The youth unemployment proportion of 13% was three times as large as the proportion of those aged 25 to 64 which stood at 4%. The youth unemployment rate (20%) was four times larger than the rate for those aged 25 to 64 (5%).
However, the unemployment proportion still includes unemployed full-time students in the total number of unemployed. A further disaggregation is to look at young people who are not in full-time education and are unemployed as a proportion of the total youth population.
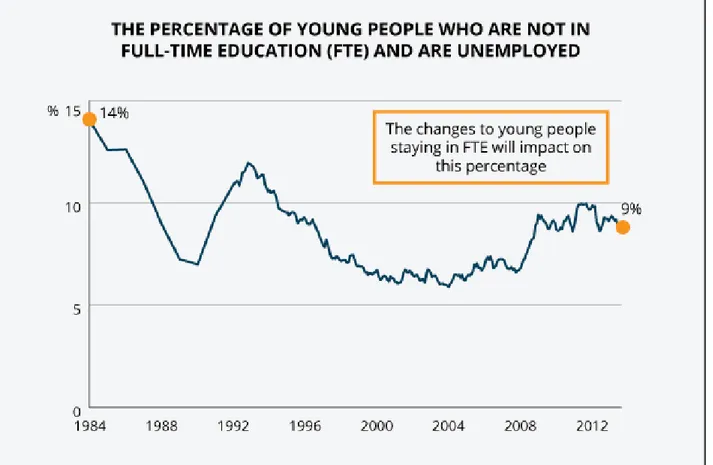
Figure 6: Percentage of 16 to 24 year olds who are not in full-time education and are unemployed, 1984 to 2013
Download chart XLS format (82.5 Kb)
In 1984, 14% of all young people were not in full-time education and were unemployed. This
percentage fell to 7% by 1990 and rose again to 12% in 1993, after the recession in the early 1990s. The percentage fell steadily until 2001 and rose slightly in the years following. Around 2008 there was a sharper rise than in previous years and at the end of 2013, the percentage unemployed and not in full-time education stood at 9%. So the percentage of young people who are not in full-time education and unemployed was lower in the most recent downturn compared to the recession of the 1980s and 1990s. This in part is explained by the fact that more young people are remaining in full-time education.
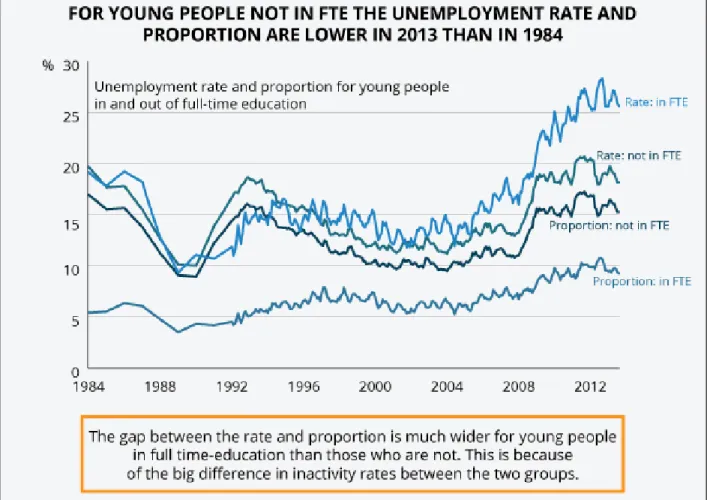
The impact of education on the unemployment rate and proportion is highlighted when looking at young people in and out of full-time education. For those in full-time education the rate stood at 26% in the final quarter of 2013, much higher than the rate for those not in full-time education, which stood at 18%. However, the unemployment proportion for those in full-time education was much lower (at 9%) than for those not in full-time education (at 15%).
Figure 7: Unemployment rate and proportion of 16 to 24 year olds by whether in full-time education or not, 1984 to 2013
Source: Labour Force Survey - Office for National Statistics Download chart
XLS format (94 Kb)
When people leave education, generally they are looking for work and therefore unemployment is high
When people leave full-time education, they then tend to start to look for work following their study and this is a time when unemployment is generally high. Given time, when young people have had more opportunity to look for work, the proportion of them who are unemployed decreases. This generally happens across all qualification levels but the level of qualification held also has an impact on the unemployment proportion. Generally higher qualifications reduce the likelihood of being unemployed as you get older.
The proportion of 21 year olds with a degree (or equivalent) who were unemployed in 2013 was 22% and for those with GCSEs (or equivalent) as their highest qualification it was 18%. However, by the age of 21 those with GCSEs as their highest qualification have had a longer period to find a job whilst those with a degree are just starting to look for work. By the age of 24 the proportion is lower for degree holders at 8% compared with 12% for those with GCSEs. For those with the higher qualification, the likelihood of being unemployed has fallen more sharply, although for those with GCSEs the unemployment proportion also falls with time.
Figure 8: The unemployment proportion of those not in full-time education by age and highest qualification held
Source: Labour Force Survey - Office for National Statistics Download chart
XLS format (53 Kb)
How does the UK compare with Europe?
The youth unemployment rate in the UK was lower than the European Union average in 2013 Comparing the UK with other countries across the European Union (EU), the UK unemployment rate (21%) was lower than the EU average (23.5%), in the third quarter of 2013. However, the UK unemployment proportion (12%) was higher than the EU average (10%), in the third quarter of
Figure 9: The youth unemployment rates of countries in the European Union for the third quarter of 2013 and the first quarter of 2008
Source: Eurostat Download chart XLS format (51 Kb)
The countries across the EU have different proportions of the population who are young people, and also the participation in education varies, which should be considered when comparing the unemployment rate. For example the unemployment rate in Spain stood at 57% of the labour force in the third quarter of 2013 but the proportion was much lower at 21%. So over half of young people in the Spanish labour force (employed or unemployed) are looking for work but out of the whole
The different demographics, government policies and social attitudes within each country all impact on unemployment for young people. To illustrate the policy impact, Germany, which was the only country to experience a fall in youth unemployment over the past five years, has well-established routes into employment for young people who do not enter higher education including apprenticeships. Differences in the national systems of education and training also play a major role in how people make the transition from education into the labour market.
The situation for young people varies across the major economies across the Europe Union Looking at the major economies across Europe, the UK, Germany, France, Italy and Spain, the situation for young people varies. This is illustrated by comparing the youth unemployment ratio (proportion) with the share of young people who combine education with being active in the labour market. Eurostat (European Commission Statistical Agency) has created five groups based on these comparisons.
• The UK is within group 4 which has a high involvement of students in the labour market, an average level of unemployment and a long-standing tradition of students doing part-time or summer jobs.
• Germany, which has low youth unemployment is within group 5, it has high levels of employment and almost no unemployment among those in education. They have established apprenticeships systems or vocational training in secondary education.
• France is within group 2 in which there is a moderate overlap between education and being active in the labour market, with youth unemployment levels around the EU average.
• Spain is within group 3 which has a moderate overlap between education and being active in the labour market and a very high level of youth unemployment. This group contains some of the countries worst hit by the recent economic crisis.
• Italy is within group 1 which has very few students employed or unemployed. The overlap between the labour market and education is very small and many young people complete their studies before looking for their first job.
Figure 10: Percentage of people aged 15 to 24 who are simultaneously in education and the labour market plotted against the unemployment proportion for 15 to 24 year olds by country, 2012
Download chart XLS format (28.5 Kb)
The definition used, in the recent report by Eurostat Participation of young people in education and the labour market, counts all those who state they have been in formal education or training during the previous four weeks as being in education, this would include those participating in part-time study. It does not include people who participated exclusively in non-formal training sessions such as attending a course, a seminar or taking private lessons.
How do different parts of the UK differ?
Within the UK, the South East of England had the highest employment rate for young people not studying
The situation for young people varies across the countries of the UK and regions of England. Focusing on those who are no longer in full-time education, between October 2012 and September 2013, the South East of England had the highest employment rate at 73% and Northern Ireland the lowest at 61%.
Figure 11: Employment rates of 16 to 24 year olds not in full-time education by region, October 2012 to September 2013
Source: Annual Population Survey (APS) - Office for National Statistics Download chart
XLS format (54.5 Kb)
The highest youth unemployment rate was in the North East of England
The North East of England had the highest unemployment rate for young people who were not in full-time education at 25% between October 2012 to September 2013, 6 percentage points higher than the UK average of 19%. The South East of England had the lowest unemployment rate for young people who were not in full-time education at 15%.
Figure 12: Unemployment and inactivity rates of 16 to 24 year olds not in full-time education by region, October 2012 to September 2013
Source: Annual Population Survey (APS) - Office for National Statistics Download chart
XLS format (56 Kb)
Northern Ireland had the highest inactivity rate for young people no longer studying with Scotland the lowest
Northern Ireland had the lowest employment rate for those who are no longer in education but did not have the highest youth unemployment. This is because it has the highest inactivity among those not studying full-time. Between, October 2012 to September 2013, the inactivity rate among young people no longer in full-time education was 24%, 8 percentage points higher than the UK average over the same period. Scotland had the lowest inactivity rate for young people who were not in full-time education with 14%.
Wokingham had the highest youth employment rate, for those not in full-time education, across England and Wales
at 83.2%. This is around 11 percentage points higher than the average for England and Wales at 72.3%. The next highest youth employment rate was in South Gloucestershire at 81.7%, followed by North Yorkshire at 81.2%, Bracknell Forest at 81.0% and West Berkshire at 80.7%.
Hartlepool and Wolverhampton had the highest unemployment rates for young people across England and Wales
Looking at youth unemployment at a local level, Hartlepool and Wolverhampton had the highest youth unemployment rate excluding full-time students at 28.1%. This was followed by Middlesbrough at 27.7%, Birmingham at 26.0% and Redcar and Cleveland at 25.5%. Three of these areas are in close proximity in the North East of England. The highest youth unemployment rate within Wales was in Blaenau Gwent at 25.5%, the same as Redcar and Cleveland.
Figure 13: The participation of young people in the labour market for local authorities in England and Wales, 2011
Source: Census - Office for National Statistics Download chart
XLS format (111.5 Kb)
Looking at inactivity amongst young people excluding full-time students, Barking and Dagenham had the highest inactivity rate at 20.3%. This was followed by Greenwich at 19.8% and Birmingham at 19.4%. The highest youth inactivity rate in Wales was in Bridgend at 19.2%.
Ceredigion has the highest proportion of students amongst its youth population
Looking at the areas that have high proportions of students, Ceredigion has the highest percentage of students amongst its youth population at 73.2%, 26 percentage points higher than the average for England and Wales. The University of Aberystwyth is in this area.
Barking and Dagenham has the highest percentage of young people who are inactive to look after their home or family
Another reason given for being inactive is to look after the home or family, Barking and Dagenham has the highest percentage of young people who give this reason, at 5.2% of the youth population. This is followed by Walsall at 5.1%, Hartlepool at 4.9% and North East Lincolnshire at 4.8%. The highest percentage within Wales is 4.6% in Blaenau Gwent.
Welsh authorities are at the top of the areas where young people are inactive due to them being long term sick or disabled, double the average for England and Wales
Looking at the reasons young people give for being inactive, the area that has the highest
percentage of all young people who give their reason for inactivity in the labour market as being long term sick or disabled is Neath Port Talbot at 2.7%. This is followed by Bridgend at 2.5%, Blaenau Gwent at 2.4% and Torfaen at 2.3%. These areas are all in Wales. The highest percentage inactive because of being long term sick or disabled in England is 2.2% in Blackpool. All these areas have double, or more, the average for England and Wales which stood at 1.1%.
Background notes
1. Details of the policy governing the release of new data are available by visiting
www.statisticsauthority.gov.uk/assessment/code-of-practice/index.html or from the Media Relations Office email: media.relations@ons.gsi.gov.uk
These National Statistics are produced to high professional standards and released according to the arrangements approved by the UK Statistics Authority.
Copyright
www.nationalarchives.gov.uk/doc/open-government-licence/ or write to the Information Policy Team, The National Archives, Kew, London TW9 4DU, or email: psi@nationalarchives.gsi.gov.uk.