For release 10:00 a.m. (EDT) Tuesday, June 9, 2015
USDL-15-1131
Technical information: (202) 691-5870 • JoltsInfo@bls.gov • www.bls.gov/jlt
Media contact:
(202) 691-5902 • PressOffice@bls.gov
J
OB
O
PENINGS AND
L
ABOR
T
URNOVER
–
A
PRIL
2015
The number of job openings rose to 5.4 million on the last business day of April, the highest since the
series began in December 2000, the U.S. Bureau of Labor Statistics reported today. The number of hires
was little changed at 5.0 million in April and the number of separations was little changed at 4.9 million.
Within separations, the quits rate was 1.9 percent and the layoffs and discharges rate was 1.3 percent,
both little different from the previous month. This release includes estimates of the number and rate of
job openings, hires, and separations for the nonfarm sector by industry and by four geographic regions.
Job Openings
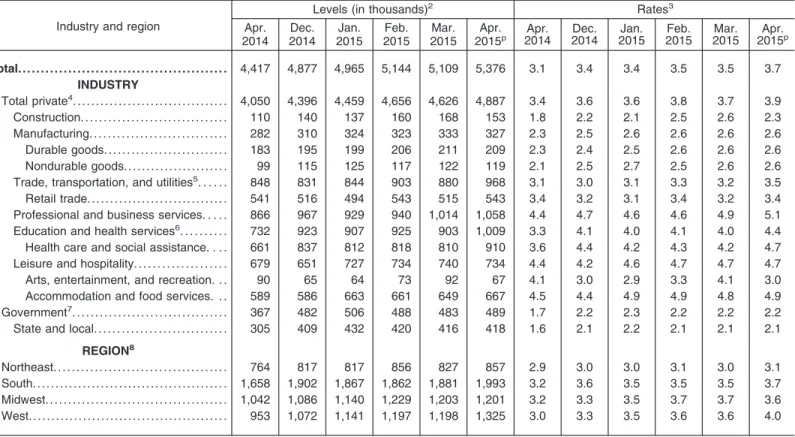
Job openings
rose to 5.4 million on the last business day of April, the highest point since the series
began in December 2000. The job openings rate for April 2015 was 3.7 percent. The number of job
openings increased for total private and was essentially unchanged for government. At the industry
level, job openings rose over the month in health care and social assistance but fell in arts,
entertainment, and recreation. In the regions, job openings increased in the West. (See table 1.)
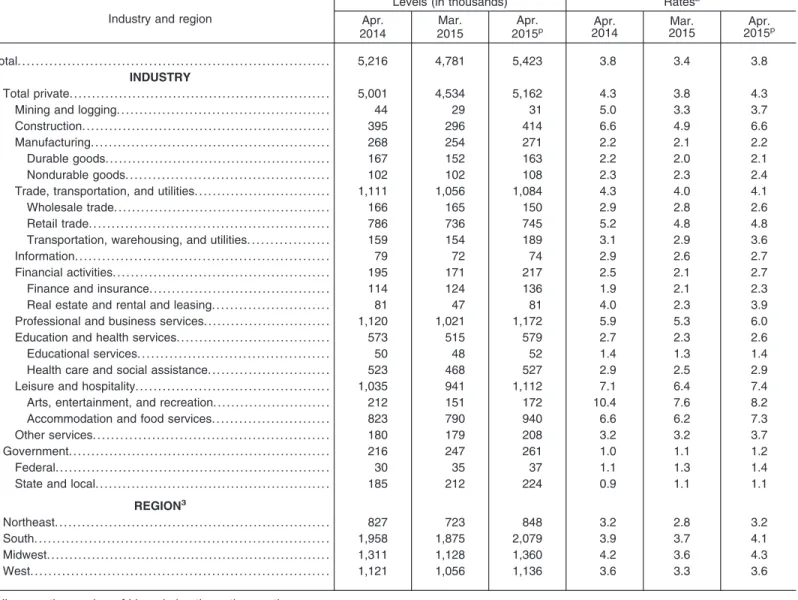
The number of
job openings
(not seasonally adjusted) increased over the 12 months ending in April for
total nonfarm, total private, and government. Job openings increased over the year for many industries
with the largest changes occurring in professional and business services and in health care and social
assistance. Job openings decreased over the year in mining and logging and in arts, entertainment, and
recreation. The number of job openings increased over the year in all four regions. (See table 7.)
2.0 2.2 2.4 2.6 2.8 3.0 3.2 3.4 3.6 3.8 4.0Percent
2014 2015
Chart 1. Job openings rate, seasonally adjusted, May 2012 - April 2015
2013 2.0
2.2 2.4 2.6 2.8 3.0 3.2 3.4 3.6 3.8 4.0
Hires Separations
Percent
2014 2015
Chart 2. Hires and total separations rates, seasonally adjusted, May 2012 - April 2015
- 2 -
Hires
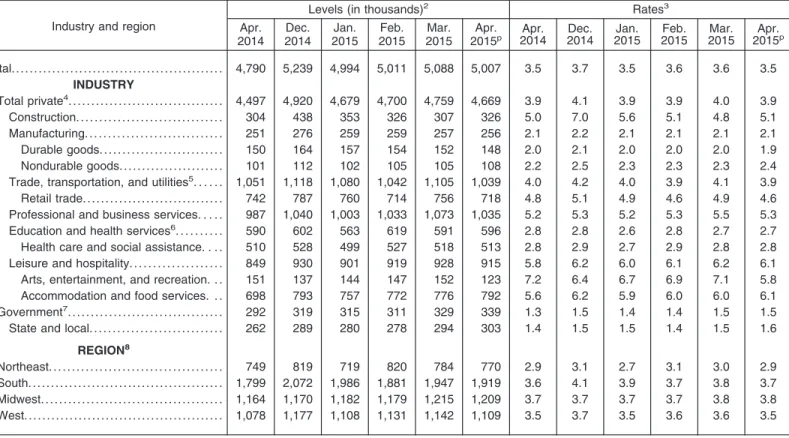
The number of
hires
was 5.0 million in April, little changed from March. The hires rate was 3.5 percent.
The number of hires was little changed for total private and government in April. There was little change
in the number of hires in all industries and regions over the month. (See table 2.)
Over the 12 months ending in April, the number of
hires
(not seasonally adjusted) was little changed for
total nonfarm and total private, and increased for government. At the industry level, hires increased in
accommodation and food services and in state and local government. The number of hires decreased
over the year in mining and logging and in arts, entertainment, and recreation. The number of hires was
essentially unchanged over the year in all four regions. (See table 8.)
Separations
Total separations includes quits, layoffs and discharges, and other separations. Total separations is
referred to as turnover. Quits are generally voluntary separations initiated by the employee. Therefore,
the quits rate can serve as a measure of workers’ willingness or ability to leave jobs. Layoffs and
discharges are involuntary separations initiated by the employer. Other separations includes separations
due to retirement, death, and disability, as well as transfers to other locations of the same firm.
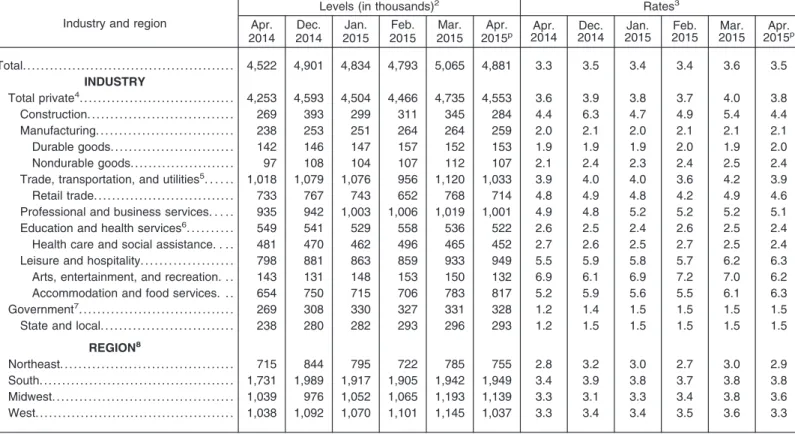
There were 4.9 million
total separations
in April, little changed from March. The separations rate was
3.5 percent. The number of total separations was little changed for total private and government, and in
all industries and regions over the month. (See table 3.)
There were 2.7 million
quits
in April, little changed from March. The quits rate in April was 1.9
percent. The number of quits was little changed for total private and government over the month. The
number of quits did not increase over the month for any industries, but fell in retail trade and in
accommodation and food services. In all four regions, the number of quits was little changed in April.
(See table 4.)
The number of
quits
(not seasonally adjusted) increased over the 12 months ending in April for total
nonfarm, total private, and government. Over the year, quits increased in several industries with the
largest rises occurring in durable goods manufacturing; finance and insurance; and health care and social
assistance. The number of quits increased over the year in the South region. (See table 10.)
There were 1.8 million
layoffs and discharges
in April, about the same as in March. The layoffs and
discharges rate was 1.3 percent. The number of layoffs and discharges was little changed over the month
for total private and government, and in all four regions. (See table 5.) Seasonally adjusted estimates of
layoffs and discharges are not available for individual industries.
The number of
layoffs and discharges
(not seasonally adjusted) was little changed over the 12 months
ending in April for total nonfarm, total private, and government. The number of layoffs and discharges
increased over the year in mining and logging and in accommodation and food services, but decreased in
health care and social assistance. There was little change in layoffs and discharges over the year in all
four regions. (See table 11.)
In April, there were 395,000
other separations
for total nonfarm, about the same as in March. Over the
- 3 -
government at 69,000. (See table 6.) Seasonally adjusted estimates of other separations are not available
for individual industries or regions.
Over the 12 months ending in April, the number of
other separations
(not seasonally adjusted) was
little changed for total nonfarm, total private, and government, and in all industries and regions. (See
table 12.)
Net Change in Employment
Large numbers of hires and separations occur every month throughout the business cycle. Net
employment change results from the relationship between hires and separations. When the number of
hires exceeds the number of separations, employment rises, even if the hires level is steady or declining.
Conversely, when the number of hires is less than the number of separations, employment declines, even
if the hires level is steady or rising. Over the 12 months ending in April 2015,
hires
totaled 60.0 million
and
separations
totaled 57.2 million, yielding a
net employment
gain of 2.8 million. These totals
include workers who may have been hired and separated more than once during the year.
The Job Openings and Labor Turnover Survey results for May 2015 are scheduled to be released
on Tuesday, July 7, 2015 at 10:00 a.m. (EDT).
Table A. Job openings, hires, and total separations by industry, seasonally adjusted
Category
Job openings Hires Total separations
Apr. 2014
Mar. 2015
Apr.
2015p 2014Apr. 2015Mar. 2015Apr.p 2014Apr. 2015Mar. 2015Apr.p
LEVELS BY INDUSTRY (in thousands)
Total. . . 4,417 5,109 5,376 4,790 5,088 5,007 4,522 5,065 4,881
Total private1. . . . 4,050 4,626 4,887 4,497 4,759 4,669 4,253 4,735 4,553
Construction. . . 110 168 153 304 307 326 269 345 284
Manufacturing. . . 282 333 327 251 257 256 238 264 259
Durable goods. . . 183 211 209 150 152 148 142 152 153
Nondurable goods. . . 99 122 119 101 105 108 97 112 107
Trade, transportation, and utilities2. . . . 848 880 968 1,051 1,105 1,039 1,018 1,120 1,033
Retail trade. . . 541 515 543 742 756 718 733 768 714
Professional and business services. . . 866 1,014 1,058 987 1,073 1,035 935 1,019 1,001
Education and health services3. . . . 732 903 1,009 590 591 596 549 536 522
Health care and social assistance. . . 661 810 910 510 518 513 481 465 452
Leisure and hospitality. . . 679 740 734 849 928 915 798 933 949
Arts, entertainment, and recreation. . . 90 92 67 151 152 123 143 150 132
Accommodation and food services. . . 589 649 667 698 776 792 654 783 817
Government4. . . . 367 483 489 292 329 339 269 331 328
State and local. . . 305 416 418 262 294 303 238 296 293
RATES BY INDUSTRY (percent)
Total. . . 3.1 3.5 3.7 3.5 3.6 3.5 3.3 3.6 3.5
Total private1. . . . 3.4 3.7 3.9 3.9 4.0 3.9 3.6 4.0 3.8
Construction. . . 1.8 2.6 2.3 5.0 4.8 5.1 4.4 5.4 4.4
Manufacturing. . . 2.3 2.6 2.6 2.1 2.1 2.1 2.0 2.1 2.1
Durable goods. . . 2.3 2.6 2.6 2.0 2.0 1.9 1.9 1.9 2.0
Nondurable goods. . . 2.1 2.6 2.6 2.2 2.3 2.4 2.1 2.5 2.4
Trade, transportation, and utilities2. . . . 3.1 3.2 3.5 4.0 4.1 3.9 3.9 4.2 3.9
Retail trade. . . 3.4 3.2 3.4 4.8 4.9 4.6 4.8 4.9 4.6
Professional and business services. . . 4.4 4.9 5.1 5.2 5.5 5.3 4.9 5.2 5.1
Education and health services3. . . . 3.3 4.0 4.4 2.8 2.7 2.7 2.6 2.5 2.4
Health care and social assistance. . . 3.6 4.2 4.7 2.8 2.8 2.8 2.7 2.5 2.4
Leisure and hospitality. . . 4.4 4.7 4.7 5.8 6.2 6.1 5.5 6.2 6.3
Arts, entertainment, and recreation. . . 4.1 4.1 3.0 7.2 7.1 5.8 6.9 7.0 6.2
Accommodation and food services. . . 4.5 4.8 4.9 5.6 6.0 6.1 5.2 6.1 6.3
Government4. . . . 1.7 2.2 2.2 1.3 1.5 1.5 1.2 1.5 1.5
State and local. . . 1.6 2.1 2.1 1.4 1.5 1.6 1.2 1.5 1.5
1Includes mining and logging, information, financial activities, and other services, not shown separately.
2Includes wholesale trade and transportation, warehousing, and utilities, not shown separately.
3Includes educational services, not shown separately.
4Includes federal government, not shown separately.
Technical Note
This news release presents statistics from the Job
Openings and Labor Turnover Survey (JOLTS). The
Bureau of Labor Statistics (BLS) collects and compiles
JOLTS data monthly from a sample of nonfarm
establishments. A more detailed discussion of JOLTS
concepts and methodology is available online at
www.bls.gov/opub/hom/pdf/homch18.pdf.
Coverage and collection
The JOLTS program covers all private nonfarm
estab-lishments, as well as federal, state, and local government
entities in the 50 states and the District of Columbia. Data
are collected for total employment, job openings, hires,
quits, layoffs and discharges, other separations, and total
separations.
Concepts
Industry classification.
The industry classifications in
this release are in accordance with the 2012 version of the
North American Industry Classification System (NAICS).
Employment.
Employment includes persons on the
payroll who worked or received pay for the pay period
that includes the 12th day of the reference month.
Full-time, part-Full-time, permanent, short-term, seasonal, salaried,
and hourly employees are included, as are employees on
paid vacations or other paid leave. Proprietors or partners
of unincorporated businesses, unpaid family workers, or
persons on leave without pay or on strike for the entire
pay period, are not counted as employed. Employees of
temporary help agencies, employee leasing companies,
outside contractors, and consultants are counted by their
employer of record, not by the establishment where they
are working.
Job openings.
Job openings information is collected for
the last business day of the reference month. A job
opening requires that: 1) a specific position exists and
there is work available for that position, 2) work could
start within 30 days whether or not the employer found a
suitable candidate, and 3) the employer is actively
recruiting from outside the establishment to fill the
position. Included are full-time, part-time, permanent,
short-term, and seasonal openings. Active recruiting
means that the establishment is taking steps to fill a
position by advertising in newspapers or on the Internet,
posting help-wanted signs, accepting applications, or
using other similar methods.
Jobs to be filled only by internal transfers, promotions,
demotions, or recall from layoffs are excluded. Also
excluded are jobs with start dates more than 30 days in
the future, jobs for which employees have been hired but
have not yet reported for work, and jobs to be filled by
employees of temporary help agencies, employee leasing
companies, outside contractors, or consultants. The job
openings rate is computed by dividing the number of job
openings by the sum of employment and job openings and
multiplying that quotient by 100.
Hires.
The hires level is the total number of additions to
the payroll occurring at any time during the reference
month, including both new and rehired employees,
full-time and part-full-time, permanent, short-term and seasonal
employees, employees recalled to the location after a
layoff lasting more than 7 days, on-call or intermittent
employees who returned to work after having been
formally separated, and transfers from other locations.
The hires count does not include transfers or promotions
within the reporting site, employees returning from strike,
employees of temporary help agencies or employee
leasing companies, outside contractors, or consultants.
The hires rate is computed by dividing the number of
hires by employment and multiplying that quotient by
100.
Separations.
The separations level is the total number of
employment terminations occurring at any time during the
reference month, and is reported by type of separation—
quits, layoffs and discharges, and other separations.
(Some respondents are only able to report total
separations.) The quits count includes voluntary
separations by employees (except for retirements, which
are reported as other separations). The layoffs and
discharges count is comprised of involuntary separations
initiated by the employer and includes layoffs with no
intent to rehire; formal layoffs lasting or expected to last
more than 7 days; discharges resulting from mergers,
downsizing, or closings; firings or other discharges for
cause;
terminations
of
permanent
or
short-term
employees; and terminations of seasonal employees. The
other separations count includes retirements, transfers to
other locations, deaths, and separations due to disability.
The separations count does not include transfers within
the same location or employees on strike. The separations
rate is computed by dividing the number of separations by
employment and multiplying that quotient by 100. The
quits, layoffs and discharges, and other separations rates
are computed similarly.
Annual estimates.
Annual levels for hires, quits, layoffs
and discharges, other separations, and total separations
are the sum of the 12 published monthly levels. Annual
rates are computed by dividing the annual level by the
Current Employment Statistics (CES) annual average
employment level, and multiplying that quotient by 100.
This figure will be approximately equal to the sum of the
12 monthly rates. Consistent with BLS practice, annual
estimates are published only for not seasonally adjusted
data and are released with the January news release each
year. Annual estimates are not calculated for job openings
because job openings are a stock, or point-in-time,
measurement for the last business day of each month.
Sample and estimation methodology
The JOLTS survey design is a stratified random sample of
16,000 nonfarm business and government establishments.
The sample is stratified by ownership, region, industry
sector, and establishment size class. The establishments
are drawn from a universe of over 9.1 million
establishments compiled by the Quarterly Census of
Employment and Wages (QCEW) program which
includes all employers subject to state unemployment
insurance laws and federal agencies subject to the
Unemployment Compensation for Federal Employees
program.
JOLTS total employment estimates are benchmarked, or
ratio adjusted, monthly to the strike-adjusted employment
estimates of the CES survey. A ratio of CES to JOLTS
employment is used to adjust the levels for all other
JOLTS data elements.
JOLTS business birth/death model
As with any sample survey, the JOLTS sample can only
be as current as its sampling frame. The time lag from the
birth of an establishment until its appearance on the
sampling frame is approximately one year. In addition,
many of these new units may fail within the first year.
Since these universe units cannot be reflected on the
sampling frame immediately, the JOLTS sample cannot
capture job openings, hires, and separations from these
units during their early existence. To compensate for the
inability to capture data from these establishments, BLS
has developed a birth/death model that uses birth and
death activity from previous years. The estimates of job
openings, hires, and separations produced by the
birth/death model are added to the sample-based estimates
produced from the survey to arrive at the estimates for
openings, hires, and separations.
Seasonal adjustment
BLS uses X-12 ARIMA to seasonally adjust several
JOLTS series utilizing moving averages as seasonal
filters. A concurrent seasonal adjustment methodology is
used in which new seasonal adjustment factors are
calculated each month, using all relevant data, up to and
including current month data. JOLTS seasonal adjustment
includes both additive and multiplicative models and
REGARIMA (regression with auto-correlated errors)
modeling to improve the seasonal adjustment factors at
the beginning and end of the series and to detect and
adjust for outliers in the series.
Alignment procedure
The JOLTS measures for hires minus separations can be
used to derive a measure of net employment change. This
change should be comparable to the net employment
change from the much larger CES survey. However,
definitional differences as well as sampling and
non-sampling errors between the two surveys historically
caused JOLTS to diverge from CES over time. To limit
the divergence, and improve the quality of the JOLTS
hires and separations series, BLS implemented the
Monthly Alignment Method.
This method applies the CES employment trends to the
seasonally adjusted JOLTS implied employment trend
(hires
minus
separations)
forcing
them
to
be
approximately the same, while preserving the seasonality
of the JOLTS data. First, the two series are seasonally
adjusted and the difference between the JOLTS implied
employment change and the CES net employment change
is calculated. Next, the JOLTS implied employment
change is adjusted to equal the CES net employment
change through a proportional adjustment. This procedure
adjusts the two components (hires,
separations)
proportionally to their contribution to the total churn
(hires plus separations). The adjusted hires and
separations are converted back to not seasonally adjusted
data by reversing the application of the original seasonal
factors. After the Monthly Alignment Method has been
used to adjust the level estimates, rate estimates are
computed from the adjusted levels.
Reliability of the estimates
JOLTS estimates are subject to both sampling and
nonsampling error. When a sample is surveyed rather than
the entire population, there is a chance that the sample
estimates may differ from the "true" population values
they represent. The exact difference, or sampling error,
varies depending on the particular sample selected, and
this variability is measured by the standard error of the
estimate. BLS analysis is generally conducted at the
percent level of confidence. That means that there is a
90-percent chance, or level of confidence, that an estimate
based on a sample will differ by no more than 1.6
standard errors from the "true" population value because
of sampling error. Sampling error estimates are available
at www.bls.gov/jlt/jolts_median_standard_errors.htm.
The JOLTS estimates also are affected by non-sampling
error. Nonsampling error can occur for many reasons,
including the failure to include a segment of the
population, the inability to obtain data from all units in
the sample, the inability or unwillingness of respondents
to provide data on a timely basis, mistakes made by
respondents, errors made in the collection or processing
of the data, and errors from the employment benchmark
data used in estimation.
Other information
Information in this release will be made available to
sensory impaired individuals upon request. Voice phone:
(202) 691-5200; Federal Relay Service: (800) 877-8339.
Table 1. Job openings levels and rates by industry and region, seasonally adjusted
1Industry and region
Levels (in thousands)2 Rates3
Apr. 2014
Dec. 2014
Jan. 2015
Feb. 2015
Mar. 2015
Apr.
2015p 2014Apr. 2014Dec. 2015Jan. 2015Feb. 2015Mar. 2015Apr.p
Total. . . . 4,417 4,877 4,965 5,144 5,109 5,376 3.1 3.4 3.4 3.5 3.5 3.7
INDUSTRY
Total private4. . . . 4,050 4,396 4,459 4,656 4,626 4,887 3.4 3.6 3.6 3.8 3.7 3.9
Construction. . . 110 140 137 160 168 153 1.8 2.2 2.1 2.5 2.6 2.3
Manufacturing. . . 282 310 324 323 333 327 2.3 2.5 2.6 2.6 2.6 2.6
Durable goods. . . 183 195 199 206 211 209 2.3 2.4 2.5 2.6 2.6 2.6
Nondurable goods. . . 99 115 125 117 122 119 2.1 2.5 2.7 2.5 2.6 2.6
Trade, transportation, and utilities5. . . . 848 831 844 903 880 968 3.1 3.0 3.1 3.3 3.2 3.5
Retail trade. . . 541 516 494 543 515 543 3.4 3.2 3.1 3.4 3.2 3.4
Professional and business services. . . 866 967 929 940 1,014 1,058 4.4 4.7 4.6 4.6 4.9 5.1
Education and health services6. . . . 732 923 907 925 903 1,009 3.3 4.1 4.0 4.1 4.0 4.4
Health care and social assistance. . . . 661 837 812 818 810 910 3.6 4.4 4.2 4.3 4.2 4.7
Leisure and hospitality. . . 679 651 727 734 740 734 4.4 4.2 4.6 4.7 4.7 4.7
Arts, entertainment, and recreation. . . 90 65 64 73 92 67 4.1 3.0 2.9 3.3 4.1 3.0
Accommodation and food services. . . 589 586 663 661 649 667 4.5 4.4 4.9 4.9 4.8 4.9
Government7. . . . 367 482 506 488 483 489 1.7 2.2 2.3 2.2 2.2 2.2
State and local. . . 305 409 432 420 416 418 1.6 2.1 2.2 2.1 2.1 2.1
REGION8
Northeast. . . 764 817 817 856 827 857 2.9 3.0 3.0 3.1 3.0 3.1
South. . . 1,658 1,902 1,867 1,862 1,881 1,993 3.2 3.6 3.5 3.5 3.5 3.7
Midwest. . . 1,042 1,086 1,140 1,229 1,203 1,201 3.2 3.3 3.5 3.7 3.7 3.6
West. . . 953 1,072 1,141 1,197 1,198 1,325 3.0 3.3 3.5 3.6 3.6 4.0
1Job openings are the number of job openings on the last business day of the month.
2Detail will not necessarily add to totals because of the independent seasonal adjustment of the various series and because not all series are shown.
3The job openings rate is the number of job openings on the last business day of the month as a percent of total employment plus job openings.
4Includes mining and logging, information, financial activities, and other services, not shown separately.
5Includes wholesale trade and transportation, warehousing, and utilities, not shown separately.
6Includes educational services, not shown separately.
7Includes federal government, not shown separately.
8The states (including the District of Columbia) that comprise the regions are: Northeast: Connecticut, Maine, Massachusetts, New Hampshire, New
Jersey, New York, Pennsylvania, Rhode Island, and Vermont; South: Alabama, Arkansas, Delaware, District of Columbia, Florida, Georgia, Kentucky, Louisiana, Maryland, Mississippi, North Carolina, Oklahoma, South Carolina, Tennessee, Texas, Virginia, and West Virginia; Midwest: Illinois, Indiana, Iowa, Kansas, Michigan, Minnesota, Missouri, Nebraska, North Dakota, Ohio, South Dakota, and Wisconsin; West: Alaska, Arizona, California, Colorado, Hawaii, Idaho, Montana, Nevada, New Mexico, Oregon, Utah, Washington, and Wyoming.
Table 2. Hires levels and rates by industry and region, seasonally adjusted
1Industry and region
Levels (in thousands)2 Rates3
Apr. 2014
Dec. 2014
Jan. 2015
Feb. 2015
Mar. 2015
Apr.
2015p 2014Apr. 2014Dec. 2015Jan. 2015Feb. 2015Mar. 2015Apr.p
Total. . . 4,790 5,239 4,994 5,011 5,088 5,007 3.5 3.7 3.5 3.6 3.6 3.5
INDUSTRY
Total private4. . . . 4,497 4,920 4,679 4,700 4,759 4,669 3.9 4.1 3.9 3.9 4.0 3.9
Construction. . . 304 438 353 326 307 326 5.0 7.0 5.6 5.1 4.8 5.1
Manufacturing. . . 251 276 259 259 257 256 2.1 2.2 2.1 2.1 2.1 2.1
Durable goods. . . 150 164 157 154 152 148 2.0 2.1 2.0 2.0 2.0 1.9
Nondurable goods. . . 101 112 102 105 105 108 2.2 2.5 2.3 2.3 2.3 2.4
Trade, transportation, and utilities5. . . . 1,051 1,118 1,080 1,042 1,105 1,039 4.0 4.2 4.0 3.9 4.1 3.9
Retail trade. . . 742 787 760 714 756 718 4.8 5.1 4.9 4.6 4.9 4.6
Professional and business services. . . 987 1,040 1,003 1,033 1,073 1,035 5.2 5.3 5.2 5.3 5.5 5.3
Education and health services6. . . . 590 602 563 619 591 596 2.8 2.8 2.6 2.8 2.7 2.7
Health care and social assistance. . . . 510 528 499 527 518 513 2.8 2.9 2.7 2.9 2.8 2.8
Leisure and hospitality. . . 849 930 901 919 928 915 5.8 6.2 6.0 6.1 6.2 6.1
Arts, entertainment, and recreation. . . 151 137 144 147 152 123 7.2 6.4 6.7 6.9 7.1 5.8
Accommodation and food services. . . 698 793 757 772 776 792 5.6 6.2 5.9 6.0 6.0 6.1
Government7. . . . 292 319 315 311 329 339 1.3 1.5 1.4 1.4 1.5 1.5
State and local. . . 262 289 280 278 294 303 1.4 1.5 1.5 1.4 1.5 1.6
REGION8
Northeast. . . 749 819 719 820 784 770 2.9 3.1 2.7 3.1 3.0 2.9
South. . . 1,799 2,072 1,986 1,881 1,947 1,919 3.6 4.1 3.9 3.7 3.8 3.7
Midwest. . . 1,164 1,170 1,182 1,179 1,215 1,209 3.7 3.7 3.7 3.7 3.8 3.8
West. . . 1,078 1,177 1,108 1,131 1,142 1,109 3.5 3.7 3.5 3.6 3.6 3.5
1Hires are the number of hires during the entire month.
2Detail will not necessarily add to totals because of the independent seasonal adjustment of the various series and because not all series are shown.
3The hires rate is the number of hires during the entire month as a percent of total employment.
4Includes mining and logging, information, financial activities, and other services, not shown separately.
5Includes wholesale trade and transportation, warehousing, and utilities, not shown separately.
6Includes educational services, not shown separately.
7Includes federal government, not shown separately.
8The states (including the District of Columbia) that comprise the regions are: Northeast: Connecticut, Maine, Massachusetts, New Hampshire, New
Jersey, New York, Pennsylvania, Rhode Island, and Vermont; South: Alabama, Arkansas, Delaware, District of Columbia, Florida, Georgia, Kentucky, Louisiana, Maryland, Mississippi, North Carolina, Oklahoma, South Carolina, Tennessee, Texas, Virginia, and West Virginia; Midwest: Illinois, Indiana, Iowa, Kansas, Michigan, Minnesota, Missouri, Nebraska, North Dakota, Ohio, South Dakota, and Wisconsin; West: Alaska, Arizona, California, Colorado, Hawaii, Idaho, Montana, Nevada, New Mexico, Oregon, Utah, Washington, and Wyoming.
Table 3. Total separations levels and rates by industry and region, seasonally adjusted
1Industry and region
Levels (in thousands)2 Rates3
Apr. 2014
Dec. 2014
Jan. 2015
Feb. 2015
Mar. 2015
Apr.
2015p 2014Apr. 2014Dec. 2015Jan. 2015Feb. 2015Mar. 2015Apr.p
Total. . . 4,522 4,901 4,834 4,793 5,065 4,881 3.3 3.5 3.4 3.4 3.6 3.5
INDUSTRY
Total private4. . . . 4,253 4,593 4,504 4,466 4,735 4,553 3.6 3.9 3.8 3.7 4.0 3.8
Construction. . . 269 393 299 311 345 284 4.4 6.3 4.7 4.9 5.4 4.4
Manufacturing. . . 238 253 251 264 264 259 2.0 2.1 2.0 2.1 2.1 2.1
Durable goods. . . 142 146 147 157 152 153 1.9 1.9 1.9 2.0 1.9 2.0
Nondurable goods. . . 97 108 104 107 112 107 2.1 2.4 2.3 2.4 2.5 2.4
Trade, transportation, and utilities5. . . . 1,018 1,079 1,076 956 1,120 1,033 3.9 4.0 4.0 3.6 4.2 3.9
Retail trade. . . 733 767 743 652 768 714 4.8 4.9 4.8 4.2 4.9 4.6
Professional and business services. . . 935 942 1,003 1,006 1,019 1,001 4.9 4.8 5.2 5.2 5.2 5.1
Education and health services6. . . . 549 541 529 558 536 522 2.6 2.5 2.4 2.6 2.5 2.4
Health care and social assistance. . . . 481 470 462 496 465 452 2.7 2.6 2.5 2.7 2.5 2.4
Leisure and hospitality. . . 798 881 863 859 933 949 5.5 5.9 5.8 5.7 6.2 6.3
Arts, entertainment, and recreation. . . 143 131 148 153 150 132 6.9 6.1 6.9 7.2 7.0 6.2
Accommodation and food services. . . 654 750 715 706 783 817 5.2 5.9 5.6 5.5 6.1 6.3
Government7. . . . 269 308 330 327 331 328 1.2 1.4 1.5 1.5 1.5 1.5
State and local. . . 238 280 282 293 296 293 1.2 1.5 1.5 1.5 1.5 1.5
REGION8
Northeast. . . 715 844 795 722 785 755 2.8 3.2 3.0 2.7 3.0 2.9
South. . . 1,731 1,989 1,917 1,905 1,942 1,949 3.4 3.9 3.8 3.7 3.8 3.8
Midwest. . . 1,039 976 1,052 1,065 1,193 1,139 3.3 3.1 3.3 3.4 3.8 3.6
West. . . 1,038 1,092 1,070 1,101 1,145 1,037 3.3 3.4 3.4 3.5 3.6 3.3
1Total separations are the number of total separations during the entire month.
2Detail will not necessarily add to totals because of the independent seasonal adjustment of the various series and because not all series are shown.
3The total separations rate is the number of total separations during the entire month as a percent of total employment.
4Includes mining and logging, information, financial activities, and other services, not shown separately.
5Includes wholesale trade and transportation, warehousing, and utilities, not shown separately.
6Includes educational services, not shown separately.
7Includes federal government, not shown separately.
8The states (including the District of Columbia) that comprise the regions are: Northeast: Connecticut, Maine, Massachusetts, New Hampshire, New
Jersey, New York, Pennsylvania, Rhode Island, and Vermont; South: Alabama, Arkansas, Delaware, District of Columbia, Florida, Georgia, Kentucky, Louisiana, Maryland, Mississippi, North Carolina, Oklahoma, South Carolina, Tennessee, Texas, Virginia, and West Virginia; Midwest: Illinois, Indiana, Iowa, Kansas, Michigan, Minnesota, Missouri, Nebraska, North Dakota, Ohio, South Dakota, and Wisconsin; West: Alaska, Arizona, California, Colorado, Hawaii, Idaho, Montana, Nevada, New Mexico, Oregon, Utah, Washington, and Wyoming.
Table 4. Quits levels and rates by industry and region, seasonally adjusted
1Industry and region
Levels (in thousands)2 Rates3
Apr. 2014
Dec. 2014
Jan. 2015
Feb. 2015
Mar. 2015
Apr.
2015p 2014Apr. 2014Dec. 2015Jan. 2015Feb. 2015Mar. 2015Apr.p
Total. . . 2,413 2,715 2,779 2,720 2,769 2,669 1.7 1.9 2.0 1.9 2.0 1.9
INDUSTRY
Total private4. . . . 2,282 2,572 2,636 2,571 2,611 2,518 2.0 2.2 2.2 2.2 2.2 2.1
Construction. . . 118 144 105 118 122 105 1.9 2.3 1.7 1.9 1.9 1.6
Manufacturing. . . 111 135 140 131 129 141 0.9 1.1 1.1 1.1 1.0 1.1
Durable goods. . . 61 77 85 75 72 83 0.8 1.0 1.1 1.0 0.9 1.1
Nondurable goods. . . 50 58 54 56 56 59 1.1 1.3 1.2 1.2 1.2 1.3
Trade, transportation, and utilities5. . . . 555 650 623 564 649 610 2.1 2.4 2.3 2.1 2.4 2.3
Retail trade. . . 413 459 452 413 492 443 2.7 3.0 2.9 2.7 3.2 2.8
Professional and business services. . . 451 444 554 516 474 491 2.4 2.3 2.8 2.6 2.4 2.5
Education and health services6. . . . 310 336 361 388 353 345 1.5 1.5 1.7 1.8 1.6 1.6
Health care and social assistance. . . . 275 297 327 357 313 308 1.5 1.6 1.8 1.9 1.7 1.7
Leisure and hospitality. . . 499 588 582 560 613 556 3.4 3.9 3.9 3.7 4.1 3.7
Arts, entertainment, and recreation. . . 49 49 56 52 46 47 2.4 2.3 2.6 2.4 2.2 2.2
Accommodation and food services. . . 449 540 526 508 567 509 3.6 4.2 4.1 3.9 4.4 3.9
Government7. . . . 131 144 143 149 158 151 0.6 0.7 0.7 0.7 0.7 0.7
State and local. . . 120 133 132 137 147 140 0.6 0.7 0.7 0.7 0.8 0.7
REGION8
Northeast. . . 340 422 385 348 398 374 1.3 1.6 1.5 1.3 1.5 1.4
South. . . 957 1,169 1,126 1,098 1,128 1,108 1.9 2.3 2.2 2.1 2.2 2.2
Midwest. . . 572 528 637 631 629 594 1.8 1.7 2.0 2.0 2.0 1.9
West. . . 543 596 631 643 613 593 1.7 1.9 2.0 2.0 1.9 1.9
1Quits are the number of quits during the entire month.
2Detail will not necessarily add to totals because of the independent seasonal adjustment of the various series and because not all series are shown.
3The quits rate is the number of quits during the entire month as a percent of total employment.
4Includes mining and logging, information, financial activities, and other services, not shown separately.
5Includes wholesale trade and transportation, warehousing, and utilities, not shown separately.
6Includes educational services, not shown separately.
7Includes federal government, not shown separately.
8The states (including the District of Columbia) that comprise the regions are: Northeast: Connecticut, Maine, Massachusetts, New Hampshire, New
Jersey, New York, Pennsylvania, Rhode Island, and Vermont; South: Alabama, Arkansas, Delaware, District of Columbia, Florida, Georgia, Kentucky, Louisiana, Maryland, Mississippi, North Carolina, Oklahoma, South Carolina, Tennessee, Texas, Virginia, and West Virginia; Midwest: Illinois, Indiana, Iowa, Kansas, Michigan, Minnesota, Missouri, Nebraska, North Dakota, Ohio, South Dakota, and Wisconsin; West: Alaska, Arizona, California, Colorado, Hawaii, Idaho, Montana, Nevada, New Mexico, Oregon, Utah, Washington, and Wyoming.
Table 5. Layoffs and discharges levels and rates by industry and region, seasonally adjusted
1Industry and region
Levels (in thousands)2 Rates3
Apr. 2014
Dec. 2014
Jan. 2015
Feb. 2015
Mar. 2015
Apr.
2015p 2014Apr. 2014Dec. 2015Jan. 2015Feb. 2015Mar. 2015Apr.p
Total. . . 1,703 1,725 1,722 1,688 1,894 1,817 1.2 1.2 1.2 1.2 1.3 1.3
INDUSTRY
Total private4. . . . 1,621 1,623 1,603 1,579 1,791 1,709 1.4 1.4 1.3 1.3 1.5 1.4
Construction. . . – – – – – – – – – – – –
Manufacturing. . . – – – – – – – – – – – –
Durable goods. . . – – – – – – – – – – – –
Nondurable goods. . . – – – – – – – – – – – –
Trade, transportation, and utilities5. . . . – – – – – – – – – – – –
Retail trade. . . – – – – – – – – – – – –
Professional and business services. . . – – – – – – – – – – – –
Education and health services6. . . . – – – – – – – – – – – –
Health care and social assistance. . . . – – – – – – – – – – – –
Leisure and hospitality. . . – – – – – – – – – – – –
Arts, entertainment, and recreation. . . – – – – – – – – – – – –
Accommodation and food services. . . – – – – – – – – – – – –
Government7. . . . 82 102 119 110 103 108 0.4 0.5 0.5 0.5 0.5 0.5
State and local. . . – – – – – – – – – – – –
REGION8
Northeast. . . 288 355 335 305 308 313 1.1 1.4 1.3 1.2 1.2 1.2
South. . . 627 617 656 662 690 697 1.2 1.2 1.3 1.3 1.3 1.4
Midwest. . . 383 358 370 340 479 449 1.2 1.1 1.2 1.1 1.5 1.4
West. . . 405 394 361 381 418 358 1.3 1.2 1.1 1.2 1.3 1.1
1Layoffs and discharges are the number of layoffs and discharges during the entire month.
2Detail will not necessarily add to totals because of the independent seasonal adjustment of the various series and because not all series are shown.
3The layoffs and discharges rate is the number of layoffs and discharges during the entire month as a percent of total employment.
4Includes mining and logging, information, financial activities, and other services, not shown separately.
5Includes wholesale trade and transportation, warehousing, and utilities, not shown separately.
6Includes educational services, not shown separately.
7Includes federal government, not shown separately.
8The states (including the District of Columbia) that comprise the regions are: Northeast: Connecticut, Maine, Massachusetts, New Hampshire, New
Jersey, New York, Pennsylvania, Rhode Island, and Vermont; South: Alabama, Arkansas, Delaware, District of Columbia, Florida, Georgia, Kentucky, Louisiana, Maryland, Mississippi, North Carolina, Oklahoma, South Carolina, Tennessee, Texas, Virginia, and West Virginia; Midwest: Illinois, Indiana, Iowa, Kansas, Michigan, Minnesota, Missouri, Nebraska, North Dakota, Ohio, South Dakota, and Wisconsin; West: Alaska, Arizona, California, Colorado, Hawaii, Idaho, Montana, Nevada, New Mexico, Oregon, Utah, Washington, and Wyoming.
p Preliminary - Data not available.
Table 6. Other separations levels and rates by industry and region, seasonally adjusted
1Industry and region
Levels (in thousands)2 Rates3
Apr. 2014
Dec. 2014
Jan. 2015
Feb. 2015
Mar. 2015
Apr.
2015p 2014Apr. 2014Dec. 2015Jan. 2015Feb. 2015Mar. 2015Apr.p
Total. . . 406 461 333 385 403 395 0.3 0.3 0.2 0.3 0.3 0.3
INDUSTRY
Total private4. . . . 349 399 265 316 333 326 0.3 0.3 0.2 0.3 0.3 0.3
Construction. . . – – – – – – – – – – – –
Manufacturing. . . – – – – – – – – – – – –
Durable goods. . . – – – – – – – – – – – –
Nondurable goods. . . – – – – – – – – – – – –
Trade, transportation, and utilities5. . . . – – – – – – – – – – – –
Retail trade. . . – – – – – – – – – – – –
Professional and business services. . . – – – – – – – – – – – –
Education and health services6. . . . – – – – – – – – – – – –
Health care and social assistance. . . . – – – – – – – – – – – –
Leisure and hospitality. . . – – – – – – – – – – – –
Arts, entertainment, and recreation. . . – – – – – – – – – – – –
Accommodation and food services. . . – – – – – – – – – – – –
Government7. . . . 57 62 68 69 70 69 0.3 0.3 0.3 0.3 0.3 0.3
State and local. . . – – – – – – – – – – – –
REGION8
Northeast. . . – – – – – – – – – – – –
South. . . – – – – – – – – – – – –
Midwest. . . – – – – – – – – – – – –
West. . . – – – – – – – – – – – –
1Other separations are the number of other separations during the entire month.
2Detail will not necessarily add to totals because of the independent seasonal adjustment of the various series and because not all series are shown.
3The other separations rate is the number of other separations during the entire month as a percent of total employment.
4Includes mining and logging, information, financial activities, and other services, not shown separately.
5Includes wholesale trade and transportation, warehousing, and utilities, not shown separately.
6Includes educational services, not shown separately.
7Includes federal government, not shown separately.
8The states (including the District of Columbia) that comprise the regions are: Northeast: Connecticut, Maine, Massachusetts, New Hampshire, New
Jersey, New York, Pennsylvania, Rhode Island, and Vermont; South: Alabama, Arkansas, Delaware, District of Columbia, Florida, Georgia, Kentucky, Louisiana, Maryland, Mississippi, North Carolina, Oklahoma, South Carolina, Tennessee, Texas, Virginia, and West Virginia; Midwest: Illinois, Indiana, Iowa, Kansas, Michigan, Minnesota, Missouri, Nebraska, North Dakota, Ohio, South Dakota, and Wisconsin; West: Alaska, Arizona, California, Colorado, Hawaii, Idaho, Montana, Nevada, New Mexico, Oregon, Utah, Washington, and Wyoming.
p Preliminary - Data not available.
Table 7. Job openings levels and rates by industry and region, not seasonally adjusted
1Industry and region
Levels (in thousands) Rates2
Apr. 2014
Mar. 2015
Apr.
2015p 2014Apr. 2015Mar. 2015Apr.p
Total. . . 4,816 5,048 5,851 3.4 3.5 4.0
INDUSTRY
Total private. . . 4,437 4,569 5,346 3.7 3.7 4.3
Mining and logging. . . 25 18 17 2.8 2.0 2.0
Construction. . . 136 173 182 2.2 2.8 2.8
Manufacturing. . . 301 332 349 2.4 2.6 2.8
Durable goods. . . 199 214 227 2.5 2.7 2.8
Nondurable goods. . . 102 117 122 2.2 2.5 2.6
Trade, transportation, and utilities. . . 880 859 1,017 3.3 3.1 3.7
Wholesale trade. . . 166 139 179 2.8 2.3 2.9
Retail trade. . . 555 511 569 3.5 3.2 3.6
Transportation, warehousing, and utilities. . . 158 209 269 3.0 3.8 4.9
Information. . . 131 102 112 4.6 3.5 3.9
Financial activities. . . 295 244 403 3.6 2.9 4.8
Finance and insurance. . . 248 173 305 4.0 2.8 4.8
Real estate and rental and leasing. . . 47 71 98 2.3 3.4 4.5
Professional and business services. . . 935 994 1,153 4.7 4.9 5.6
Education and health services. . . 785 869 1,091 3.5 3.8 4.7
Educational services. . . 76 86 103 2.1 2.3 2.8
Health care and social assistance. . . 709 783 988 3.8 4.1 5.1
Leisure and hospitality. . . 793 778 845 5.2 5.0 5.3
Arts, entertainment, and recreation. . . 118 96 84 5.5 4.6 3.9
Accommodation and food services. . . 675 682 761 5.1 5.1 5.6
Other services. . . 156 200 177 2.7 3.5 3.0
Government. . . 379 479 505 1.7 2.1 2.2
Federal. . . 66 79 79 2.3 2.8 2.8
State and local. . . 314 400 426 1.6 2.0 2.1
REGION3
Northeast. . . 832 788 944 3.1 2.9 3.5
South. . . 1,832 1,887 2,225 3.5 3.6 4.2
Midwest. . . 1,120 1,193 1,282 3.5 3.6 3.9
West. . . 1,032 1,179 1,401 3.2 3.6 4.2
1Job openings are the number of job openings on the last business day of the month.
2The job openings rate is the number of job openings on the last business day of the month as a percent of total employment plus job openings.
3The states (including the District of Columbia) that comprise the regions are: Northeast: Connecticut, Maine, Massachusetts, New Hampshire, New
Jersey, New York, Pennsylvania, Rhode Island, and Vermont; South: Alabama, Arkansas, Delaware, District of Columbia, Florida, Georgia, Kentucky, Louisiana, Maryland, Mississippi, North Carolina, Oklahoma, South Carolina, Tennessee, Texas, Virginia, and West Virginia; Midwest: Illinois, Indiana, Iowa, Kansas, Michigan, Minnesota, Missouri, Nebraska, North Dakota, Ohio, South Dakota, and Wisconsin; West: Alaska, Arizona, California, Colorado, Hawaii, Idaho, Montana, Nevada, New Mexico, Oregon, Utah, Washington, and Wyoming.
Table 8. Hires levels and rates by industry and region, not seasonally adjusted
1 Industry and regionLevels (in thousands) Rates2
Apr. 2014
Mar. 2015
Apr.
2015p 2014Apr. 2015Mar. 2015Apr.p
Total. . . 5,216 4,781 5,423 3.8 3.4 3.8
INDUSTRY
Total private. . . 5,001 4,534 5,162 4.3 3.8 4.3
Mining and logging. . . 44 29 31 5.0 3.3 3.7
Construction. . . 395 296 414 6.6 4.9 6.6
Manufacturing. . . 268 254 271 2.2 2.1 2.2
Durable goods. . . 167 152 163 2.2 2.0 2.1
Nondurable goods. . . 102 102 108 2.3 2.3 2.4
Trade, transportation, and utilities. . . 1,111 1,056 1,084 4.3 4.0 4.1
Wholesale trade. . . 166 165 150 2.9 2.8 2.6
Retail trade. . . 786 736 745 5.2 4.8 4.8
Transportation, warehousing, and utilities. . . 159 154 189 3.1 2.9 3.6
Information. . . 79 72 74 2.9 2.6 2.7
Financial activities. . . 195 171 217 2.5 2.1 2.7
Finance and insurance. . . 114 124 136 1.9 2.1 2.3
Real estate and rental and leasing. . . 81 47 81 4.0 2.3 3.9
Professional and business services. . . 1,120 1,021 1,172 5.9 5.3 6.0
Education and health services. . . 573 515 579 2.7 2.3 2.6
Educational services. . . 50 48 52 1.4 1.3 1.4
Health care and social assistance. . . 523 468 527 2.9 2.5 2.9
Leisure and hospitality. . . 1,035 941 1,112 7.1 6.4 7.4
Arts, entertainment, and recreation. . . 212 151 172 10.4 7.6 8.2
Accommodation and food services. . . 823 790 940 6.6 6.2 7.3
Other services. . . 180 179 208 3.2 3.2 3.7
Government. . . 216 247 261 1.0 1.1 1.2
Federal. . . 30 35 37 1.1 1.3 1.4
State and local. . . 185 212 224 0.9 1.1 1.1
REGION3
Northeast. . . 827 723 848 3.2 2.8 3.2
South. . . 1,958 1,875 2,079 3.9 3.7 4.1
Midwest. . . 1,311 1,128 1,360 4.2 3.6 4.3
West. . . 1,121 1,056 1,136 3.6 3.3 3.6
1Hires are the number of hires during the entire month.
2The hires rate is the number of hires during the entire month as a percent of total employment.
3The states (including the District of Columbia) that comprise the regions are: Northeast: Connecticut, Maine, Massachusetts, New Hampshire, New
Jersey, New York, Pennsylvania, Rhode Island, and Vermont; South: Alabama, Arkansas, Delaware, District of Columbia, Florida, Georgia, Kentucky, Louisiana, Maryland, Mississippi, North Carolina, Oklahoma, South Carolina, Tennessee, Texas, Virginia, and West Virginia; Midwest: Illinois, Indiana, Iowa, Kansas, Michigan, Minnesota, Missouri, Nebraska, North Dakota, Ohio, South Dakota, and Wisconsin; West: Alaska, Arizona, California, Colorado, Hawaii, Idaho, Montana, Nevada, New Mexico, Oregon, Utah, Washington, and Wyoming.
Table 9. Total separations levels and rates by industry and region, not seasonally adjusted
1Industry and region
Levels (in thousands) Rates2
Apr. 2014
Mar. 2015
Apr.
2015p 2014Apr. 2015Mar. 2015Apr.p
Total. . . 4,431 4,338 4,749 3.2 3.1 3.4
INDUSTRY
Total private. . . 4,244 4,112 4,520 3.7 3.5 3.8
Mining and logging. . . 28 42 40 3.2 4.9 4.7
Construction. . . 258 278 259 4.3 4.6 4.1
Manufacturing. . . 235 237 259 1.9 1.9 2.1
Durable goods. . . 142 140 156 1.9 1.8 2.0
Nondurable goods. . . 93 97 102 2.1 2.2 2.3
Trade, transportation, and utilities. . . 971 945 999 3.7 3.6 3.8
Wholesale trade. . . 128 147 138 2.2 2.5 2.3
Retail trade. . . 705 640 696 4.7 4.2 4.5
Transportation, warehousing, and utilities. . . 139 158 165 2.7 3.0 3.1
Information. . . 72 78 71 2.7 2.8 2.5
Financial activities. . . 186 161 213 2.4 2.0 2.6
Finance and insurance. . . 121 120 140 2.1 2.0 2.3
Real estate and rental and leasing. . . 65 41 73 3.2 2.0 3.6
Professional and business services. . . 996 961 1,058 5.3 5.0 5.4
Education and health services. . . 542 480 521 2.5 2.2 2.4
Educational services. . . 50 47 51 1.4 1.3 1.4
Health care and social assistance. . . 492 433 470 2.7 2.4 2.5
Leisure and hospitality. . . 799 765 922 5.5 5.2 6.2
Arts, entertainment, and recreation. . . 158 110 146 7.8 5.5 7.0
Accommodation and food services. . . 641 656 776 5.1 5.2 6.0
Other services. . . 157 165 179 2.8 3.0 3.2
Government. . . 187 227 228 0.8 1.0 1.0
Federal. . . 28 31 31 1.0 1.2 1.1
State and local. . . 159 195 197 0.8 1.0 1.0
REGION3
Northeast. . . 697 627 721 2.7 2.4 2.7
South. . . 1,740 1,734 1,960 3.5 3.4 3.8
Midwest. . . 974 964 1,068 3.1 3.1 3.4
West. . . 1,020 1,013 999 3.3 3.2 3.1
1Total separations are the number of total separations during the entire month.
2The total separations rate is the number of total separations during the entire month as a percent of total employment.
3The states (including the District of Columbia) that comprise the regions are: Northeast: Connecticut, Maine, Massachusetts, New Hampshire, New
Jersey, New York, Pennsylvania, Rhode Island, and Vermont; South: Alabama, Arkansas, Delaware, District of Columbia, Florida, Georgia, Kentucky, Louisiana, Maryland, Mississippi, North Carolina, Oklahoma, South Carolina, Tennessee, Texas, Virginia, and West Virginia; Midwest: Illinois, Indiana, Iowa, Kansas, Michigan, Minnesota, Missouri, Nebraska, North Dakota, Ohio, South Dakota, and Wisconsin; West: Alaska, Arizona, California, Colorado, Hawaii, Idaho, Montana, Nevada, New Mexico, Oregon, Utah, Washington, and Wyoming. .
Table 10. Quits levels and rates by industry and region, not seasonally adjusted
1Industry and region
Levels (in thousands) Rates2
Apr. 2014
Mar. 2015
Apr.
2015p 2014Apr. 2015Mar. 2015Apr.p
Total. . . 2,463 2,466 2,705 1.8 1.8 1.9
INDUSTRY
Total private. . . 2,360 2,346 2,585 2.0 2.0 2.2
Mining and logging. . . 17 10 14 1.9 1.2 1.6
Construction. . . 124 105 109 2.1 1.7 1.7
Manufacturing. . . 116 121 150 1.0 1.0 1.2
Durable goods. . . 66 70 90 0.9 0.9 1.2
Nondurable goods. . . 50 51 60 1.1 1.1 1.3
Trade, transportation, and utilities. . . 576 572 633 2.2 2.2 2.4
Wholesale trade. . . 72 77 89 1.2 1.3 1.5
Retail trade. . . 424 421 453 2.8 2.7 2.9
Transportation, warehousing, and utilities. . . 80 73 91 1.6 1.4 1.7
Information. . . 38 45 40 1.4 1.6 1.4
Financial activities. . . 88 91 118 1.1 1.1 1.5
Finance and insurance. . . 52 69 75 0.9 1.2 1.3
Real estate and rental and leasing. . . 35 22 43 1.8 1.1 2.1
Professional and business services. . . 461 454 498 2.4 2.3 2.5
Education and health services. . . 312 322 345 1.5 1.5 1.6
Educational services. . . 30 30 31 0.8 0.8 0.8
Health care and social assistance. . . 282 292 315 1.6 1.6 1.7
Leisure and hospitality. . . 526 532 574 3.6 3.6 3.8
Arts, entertainment, and recreation. . . 45 35 41 2.2 1.8 2.0
Accommodation and food services. . . 481 497 532 3.9 3.9 4.1
Other services. . . 104 93 104 1.9 1.7 1.9
Government. . . 102 120 121 0.5 0.5 0.5
Federal. . . 10 10 11 0.4 0.4 0.4
State and local. . . 92 109 110 0.5 0.6 0.6
REGION3
Northeast. . . 346 337 375 1.3 1.3 1.4
South. . . 1,009 1,042 1,164 2.0 2.0 2.3
Midwest. . . 565 538 580 1.8 1.7 1.8
West. . . 543 549 587 1.7 1.7 1.8
1Quits are the number of quits during the entire month.
2The quits rate is the number of quits during the entire month as a percent of total employment.
3The states (including the District of Columbia) that comprise the regions are: Northeast: Connecticut, Maine, Massachusetts, New Hampshire, New
Jersey, New York, Pennsylvania, Rhode Island, and Vermont; South: Alabama, Arkansas, Delaware, District of Columbia, Florida, Georgia, Kentucky, Louisiana, Maryland, Mississippi, North Carolina, Oklahoma, South Carolina, Tennessee, Texas, Virginia, and West Virginia; Midwest: Illinois, Indiana, Iowa, Kansas, Michigan, Minnesota, Missouri, Nebraska, North Dakota, Ohio, South Dakota, and Wisconsin; West: Alaska, Arizona, California, Colorado, Hawaii, Idaho, Montana, Nevada, New Mexico, Oregon, Utah, Washington, and Wyoming.
Table 11. Layoffs and discharges levels and rates by industry and region, not seasonally adjusted
1Industry and region
Levels (in thousands) Rates2
Apr. 2014
Mar. 2015
Apr.
2015p 2014Apr. 2015Mar. 2015Apr.p
Total. . . 1,608 1,525 1,679 1.2 1.1 1.2
INDUSTRY
Total private. . . 1,563 1,466 1,620 1.3 1.2 1.4
Mining and logging. . . 9 30 24 1.0 3.5 2.8
Construction. . . 126 151 133 2.1 2.5 2.1
Manufacturing. . . 97 92 85 0.8 0.8 0.7
Durable goods. . . 63 56 54 0.8 0.7 0.7
Nondurable goods. . . 34 36 31 0.8 0.8 0.7
Trade, transportation, and utilities. . . 308 289 278 1.2 1.1 1.0
Wholesale trade. . . 46 64 34 0.8 1.1 0.6
Retail trade. . . 218 159 187 1.4 1.0 1.2
Transportation, warehousing, and utilities. . . 44 66 56 0.9 1.3 1.1
Information. . . 28 25 23 1.0 0.9 0.8
Financial activities. . . 65 50 73 0.8 0.6 0.9
Finance and insurance. . . 40 36 45 0.7 0.6 0.7
Real estate and rental and leasing. . . 25 13 28 1.3 0.7 1.4
Professional and business services. . . 472 439 491 2.5 2.3 2.5
Education and health services. . . 177 120 119 0.8 0.5 0.5
Educational services. . . 17 15 17 0.5 0.4 0.5
Health care and social assistance. . . 160 105 101 0.9 0.6 0.5
Leisure and hospitality. . . 244 208 330 1.7 1.4 2.2
Arts, entertainment, and recreation. . . 112 72 102 5.5 3.6 4.9
Accommodation and food services. . . 132 136 228 1.1 1.1 1.8
Other services. . . 36 62 64 0.6 1.1 1.1
Government. . . 45 59 60 0.2 0.3 0.3
Federal. . . 9 13 11 0.3 0.5 0.4
State and local. . . 36 46 49 0.2 0.2 0.2
REGION3
Northeast. . . 270 221 282 1.0 0.8 1.1
South. . . 606 598 665 1.2 1.2 1.3
Midwest. . . 339 361 402 1.1 1.1 1.3
West. . . 393 345 330 1.3 1.1 1.0
1Layoffs and discharges are the number of layoffs and discharges during the entire month.
2The layoffs and discharges rate is the number of layoffs and discharges during the entire month as a percent of total employment.
3The states (including the District of Columbia) that comprise the regions are: Northeast: Connecticut, Maine, Massachusetts, New Hampshire, New
Jersey, New York, Pennsylvania, Rhode Island, and Vermont; South: Alabama, Arkansas, Delaware, District of Columbia, Florida, Georgia, Kentucky, Louisiana, Maryland, Mississippi, North Carolina, Oklahoma, South Carolina, Tennessee, Texas, Virginia, and West Virginia; Midwest: Illinois, Indiana, Iowa, Kansas, Michigan, Minnesota, Missouri, Nebraska, North Dakota, Ohio, South Dakota, and Wisconsin; West: Alaska, Arizona, California, Colorado, Hawaii, Idaho, Montana, Nevada, New Mexico, Oregon, Utah, Washington, and Wyoming.
Table 12. Other separations levels and rates by industry and region, not seasonally adjusted
1Industry and region
Levels (in thousands) Rates2
Apr. 2014
Mar. 2015
Apr.
2015p 2014Apr. 2015Mar. 2015Apr.p
Total. . . 360 348 364 0.3 0.2 0.3 INDUSTRY
Total private. . . 321 300 316 0.3 0.3 0.3 Mining and logging. . . 3 2 2 0.3 0.2 0.2 Construction. . . 8 21 17 0.1 0.4 0.3 Manufacturing. . . 22 24 24 0.2 0.2 0.2 Durable goods. . . 13 14 12 0.2 0.2 0.2 Nondurable goods. . . 9 10 12 0.2 0.2 0.3 Trade, transportation, and utilities. . . 87 83 88 0.3 0.3 0.3 Wholesale trade. . . 10 5 15 0.2 0.1 0.2 Retail trade. . . 63 59 56 0.4 0.4 0.4 Transportation, warehousing, and utilities. . . 14 19 18 0.3 0.4 0.3 Information. . . 6 8 8 0.2 0.3 0.3 Financial activities. . . 33 19 22 0.4 0.2 0.3 Finance and insurance. . . 29 14 20 0.5 0.2 0.3 Real estate and rental and leasing. . . 4 5 2 0.2 0.2 0.1 Professional and business services. . . 62 68 69 0.3 0.4 0.4 Education and health services. . . 53 38 57 0.2 0.2 0.3 Educational services. . . 3 2 3 0.1 0.1 0.1 Health care and social assistance. . . 50 36 54 0.3 0.2 0.3 Leisure and hospitality. . . 29 25 18 0.2 0.2 0.1 Arts, entertainment, and recreation. . . 2 2 2 0.1 0.1 0.1 Accommodation and food services. . . 27 23 16 0.2 0.2 0.1 Other services. . . 17 10 11 0.3 0.2 0.2 Government. . . 40 48 48 0.2 0.2 0.2 Federal. . . 8 9 10 0.3 0.3 0.4 State and local. . . 31 40 38 0.2 0.2 0.2
REGION3
Northeast. . . 81 68 65 0.3 0.3 0.2 South. . . 126 95 130 0.3 0.2 0.3 Midwest. . . 70 64 86 0.2 0.2 0.3 West. . . 84 120 83 0.3 0.4 0.3
1Other separations are the number of other separations during the entire month.
2The other separations rate is the number of other separations during the entire month as a percent of total employment.
3The states (including the District of Columbia) that comprise the regions are: Northeast: Connecticut, Maine, Massachusetts, New Hampshire, New
Jersey, New York, Pennsylvania, Rhode Island, and Vermont; South: Alabama, Arkansas, Delaware, District of Columbia, Florida, Georgia, Kentucky, Louisiana, Maryland, Mississippi, North Carolina, Oklahoma, South Carolina, Tennessee, Texas, Virginia, and West Virginia; Midwest: Illinois, Indiana, Iowa, Kansas, Michigan, Minnesota, Missouri, Nebraska, North Dakota, Ohio, South Dakota, and Wisconsin; West: Alaska, Arizona, California, Colorado, Hawaii, Idaho, Montana, Nevada, New Mexico, Oregon, Utah, Washington, and Wyoming.
p Preliminary