www.oecd.org/publishing
The High Cost of Low Educational Performance
THE LONG-RUN ECONOMIC IMPACT OF IMPROVING
PISA OUTCOMES
While governments frequently commit to improving the quality of education, it often slips down the policy agenda. Because investing in education only pays off in the future, it is possible to underestimate the value and the importance of improvements.
This report uses recent economic modelling to relate cognitive skills – as measured by PISA and other international instruments – to economic growth, demonstrating that relatively small improvements to labour force skills can largely impact the future well-being of a nation. The report also shows that it is the quality of learning outcomes, not the length of schooling, which makes the difference. A modest goal of all OECD countries boosting their average PISA scores by 25 points over the next 20 years would increase OECD gross domestic product by USD 115 trillion over the lifetime of the generation born in 2010. Other aggressive goals could result in gains in the order of USD 260 trillion.
Even if there is some uncertainty in such projections the gains, put in terms of current gross domestic product, far outstrip today’s value of the short-run business-cycle management. While efforts should be directed at issues of economic recession, the long-run issues can no longer be neglected.
FURTHER READING
PISA 2006: Science Competencies for Tomorrow’s World (OECD, 2007).
THE OECD PROGRAMME FOR INTERNATIONAL STUDENT ASSESSMENT (PISA)
PISA is a collaborative process among the 30 member countries of the OECD and nearly 30 partner countries and economies. It brings together expertise from the participating countries and economies and is steered by their governments on the basis of shared, policy-driven interests. Its unique features include:
– The literacy approach: PISA defines each assessment area (science, reading and mathematics) not mainly in terms of mastery of the school curriculum, but in terms of the knowledge and skills needed for full participation in society.
– A long-term commitment: It enables countries to monitor regularly and predictably their progress in meeting key learning objectives.
– The age-group covered: By assessing 15-year-olds, i.e. young people near the end of their compulsory education, PISA provides a significant indication of the overall performance of school systems.
– The relevance to lifelong learning: PISA does not limit itself to assessing students’ knowledge and skills but also asks them to report on their own motivation to learn, their beliefs about themselves and their learning strategies, as well as on their goals for future study and careers.
98 2010 02 1 E
The full text of this book is available on line via this link:
www.sourceoecd.org/education/9789264077485
Those with access to all OECD books on line should use this link:
www.sourceoecd.org/9789264077485
SourceOECD is the OECD online library of books, periodicals and statistical databases.
For more information about this award-winning service and free trials ask your librarian, or write to us
at SourceOECD@oecd.org.
The High Cost
of Low Educational
Performance
THE LONG-RUN ECONOMIC IMPACT
OF IMPROVING PISA OUTCOMES
The High Cost of Low
Educational Performance
THE LONG-RUN ECONOMIC IMPACT
OF IMPROVING PISA OUTCOMES
Programme for International Student Assessment
Faux-titre_19x27.fm Page 1 Friday, September 11, 2009 1:38 PMORGANISATION FOR ECONOMIC CO-OPERATION
AND DEVELOPMENT
The OECD is a unique forum where the governments of 30 democracies work together to address the economic, social and environmental challenges of globalisation. The OECD is also at the forefront of efforts to understand and to help governments respond to new developments and concerns, such as corporate governance, the information economy and the challenges of an ageing population. The Organisation provides a setting where governments can compare policy experiences, seek answers to common problems, identify good practice and work to co-ordinate domestic and international policies.
The OECD member countries are: Australia, Austria, Belgium, Canada, the Czech Republic, Denmark, Finland, France, Germany, Greece, Hungary, Iceland, Ireland, Italy, Japan, Korea, Luxembourg, Mexico, the Netherlands, New Zealand, Norway, Poland, Portugal, the Slovak Republic, Spain, Sweden, Switzerland, Turkey, the United Kingdom and the United States. The Commission of the European Communities takes part in the work of the OECD.
OECD Publishing disseminates widely the results of the Organisation’s statistics gathering and research on economic, social and environmental issues, as well as the conventions, guidelines and standards agreed by its members.
This work is published on the responsibility of the Secretary-General of the OECD. The opinions expressed and arguments employed herein do not necessarily reflect the official views of the Organisation or of the governments of its member countries.
ISBN 978-92-64-07748-5 (PDF)
Photo credits: Cover © Jack Hollingsworth/Photodisc/Getty Images.
Corrigenda to OECD publications may be found on line at: www.oecd.org/publishing/corrigenda.
PISATM, OECD/PISATM and the PISA logo are trademarks of the Organisation for Economic Co-operation and Development (OECD).
All use of OECD trademarks is prohibited without permission from the OECD. © OECD 2010
You can copy, download or print OECD content for your own use, and you can include excerpts from OECD publications, databases and multimedia products in your own documents, presentations, blogs, websites and teaching materials, provided that suitable acknowledgment of OECD as source and copyright owner is given. All requests for public or commercial use and translation rights should be submitted to rights@oecd.org. Requests for permission to photocopy portions of this material for public or commercial use shall be addressed directly to the Copyright Clearance Center (CCC) at info@copyright.com or the Centre français d’exploitation du droit de copie (CFC) at contact@cfcopies.com.
Foreword
In response to the need for cross-nationally comparable evidence on student performance, the Organisation for Economic Co-operation and Development (OECD) launched the OECD Programme for International Student Assessment (PISA) in 1997. PISA represents a commitment by governments to monitor the outcomes of education systems in terms of student achievement on a regular basis and within an internationally agreed common framework. It aims to provide a new basis for policy dialogue and for collaboration in defining and implementing educational goals, in innovative ways that reflect judgements about the skills that are relevant to adult life.
Results of the three-yearly PISA surveys reveal wide differences in the performance of education systems in terms of the learning outcomes achieved by students. For some countries, the results from PISA are disappointing, showing that their 15-year-olds’ performance lags considerably behind that of other countries, sometimes by the equivalent of several years of schooling and sometimes despite high investments in education. However, PISA also shows that other countries are very successful in achieving strong and equitable learning outcomes. Moreover, some countries have been able to significantly improve their learning outcomes, in the case of Poland by almost three-quarters of a school year between 2000 and 2006 alone.
This report uses recent economic modelling to relate cognitive skills – as measured by PISA and other international instruments – to economic growth. The relationship indicates that relatively small improvements in the skills of a nation’s labour force can have very large impacts on future well-being. Moreover, the gains, put in terms of current Gross Domestic Product (GDP), far outstrip the value of the short-run business-cycle management. This is not to say that efforts should not be directed at issues of economic recession, but it is to say that the long-run issues should not be neglected.
The report was written by Prof. Eric. A. Hanushek from the Hoover Institution at Stanford University and CES ifo and by Prof. Ludger Woessmann from the Ifo Institute for Economic Research, CES ifo, and the University of Munich, in consultation with members of the PISA Governing Board as well as Andreas Schleicher, Romain Duval and Maciej Jakubowski from the OECD Secretariat. The report was produced by the Indicators and Analysis Division of the OECD Directorate for Education and is published on the responsibility of the Secretary-General of the OECD.
Table of contents
Foreword ...3
Executive summary ...5
Introduction ...6
The effect of education on economic growth ...11
• Empirical growth analyses using school attainment data ...13
• Empirical growth analyses considering cognitive skills ...13
• Measuring cognitive skills...14
• Basic facts of cognitive skills and economic growth ...16
• Evidence on causality ...17
The economic costs of low educational achievement ...20
• Simulation approach ...20
• Scenario I: Increase average performance by 25 PISA points ...22
• Scenario II: Bring each country to the average level of Finland...24
• Scenario III: Bring everyone up to a minimum skill level of 400 PISA points ...25
Policy conclusions ...27
References ...29
Notes ...31
Annex A: Deriving a combined historical measure of cognitive skills ...35
Annex B: Underlying cross-country growth regressions ...45
Annex C: Projection of the economic value of education reforms ...49
Executive summary
While many nations express a commitment to improved educational quality, education often slips down on the policy agenda. Because the benefits of educational investments are seen only in the future, it is possible to underestimate the value and the importance of improvements.
This report uses recent economic modelling to relate cognitive skills – as measured by PISA and other international instruments – to economic growth. This relationship indicates that relatively small improvements in the skills of a nation’s labour force can have very large impacts on future well-being. Moreover, the gains, put in terms of current GDP, far outstrip today’s value of the short-run business-cycle management. This is not to say that efforts should not be directed at issues of economic recession, but it is to say that the long-run issues should not be neglected.
A modest goal of having all OECD countries boost their average PISA scores by 25 points over the next 20 years – which is less than the most rapidly improving education system in the OECD, Poland, achieved between 2000 and 2006 alone – implies an aggregate gain of OECD GDP of USD 115 trillion over the lifetime of the generation born in 2010 (as evaluated at the start of reform in terms of real present value of future improvements in GDP) (Figure 1). Bringing all countries up to the average performance of Finland, OECD’s best performing education system in PISA, would result in gains in the order of USD 260 trillion (Figure 4). The report also shows that it is the quality of learning outcomes, not the length of schooling, which makes the difference. Other aggressive goals, such as bringing all students to a level of minimal proficiency for the OECD (i.e. reaching a PISA score of 400), would imply aggregate GDP increases of close to USD 200 trillion according to historical growth relationships (Figure 2).
Figure 1
Present value of Scenario I (improve student performance in each country by 25 points on the PISA scale) in billion USD (PPP)
0 5 000 10 000 15 000 20 000
40 647
United States
Japan
Germany
United Kingdom
France Italy Mexico Spain Korea Canada Turkey Australia Poland
Netherlands
Belgium Sweden Greece
Czech Republic
Austria Norway
Switzerland
Portugal Hungary Denmark Finland Ireland
New Zealand
Slovak Republic
Luxembourg
Iceland
Note: Discounted value of future increases in GDP until 2090 due to reforms that improve student performance in each country by 25 points on PISA, or by ¼ standard deviation, expressed in billion USD (see also Table 1).
V
Figure 2
Present value of Scenario II (improve student performance in each country to reach the level achieved by Finland, the country with the highest performance in PISA) in billion USD (PPP)
0 5 000 10 000 15 000 20 000 United States Mexico Turkey Italy Germany Spain France United Kingdom
Poland Greece Portugal Japan Canada Australia Norway Sweden Belgium Austria Hungary
Netherlands Denmark Switzerland Czech Republic Ireland Korea Slovak Republic
Luxembourg New Zealand Iceland Finland
103 073 38 756
21 365
Note: Discounted value of future increases in GDP until 2090 due to reforms that improve student performance in each country to reach the level achieved by Finland, at 546 points on the PISA 2000 scale (average of mathematics and science in 2000, 2003 and 2006), expressed in billion USD (see also Table 2).
V
alue of reform (USD bn)
Figure 3
Present value of Scenario II (improve student performance in each country to reach the level achieved by Finland, the country with the highest performance in PISA) in percent of current GDP
2 155 1 673 0 500 1 000 1 500
Mexico Turkey Greece Portugal Italy
Luxembour g Spain United States Poland Norway Slovak Republic
Hungary Denmark Germany Iceland France Ireland Sweden Austria
Switzerland
Belgium
Czech Republic United Kingdom
Australia New Zealand Canada Netherlands Japan Korea Finland
Note: Discounted value of future increases in GDP until 2090 due to a reform that improves student performance in each country to reach the level achieved by Finland, at 546 points on the PISA 2000 scale (average of mathematics and science in 2000, 2003 and 2006), expressed as percentage of current GDP (see also Table 2).
% of current GDP
Figure 4
Present value of Scenario III (ensure that all students perform at a minimum of 400 points on the PISA scale) in billion USD (PPP)
0 5 000 10 000 15 000 20 000 72 101 26 064 United States Mexico Turkey Germany Italy Japan France Spain United Kingdom
Poland Canada Greece Korea
Australia Portugal Belgium
Netherlands
Norway Sweden Austria
Czech Republic
Switzerland
Hungary Denmark Ireland Slovak Republic New Zealand
Luxembourg
Finland Iceland
Note: Discounted value of future increases in GDP until 2090 due to a reform that ensures that all students perform at a minimum of 400 points on the PISA scale, expressed in billion USD (see also Table 3).
V
alue of reform (USD bn)
Figure 5
Present value of Scenario III (ensure that all students perform at a minimum of 400 points on the PISA scale) in percent of current GDP
0 500 1 000 1 500
Mexico Turkey Greece Portugal
Italy
Luxembour
g
United States
Spain Poland
Germany Norway Hungary
Slovak Republic
Belgium France Denmark Austria Sweden Iceland
Switzerland Czech Republic Ireland United Kingdom New Zealand Australia Netherlands Japan
Canada Korea Finland
Note: Discounted value of future increases in GDP until 2090 due to a reform that ensures that all students perform at a minimum of 400 points on the PISA scale), expressed as percentage of current GDP (see also Table 3).
% of current GDP
There is uncertainty in these projections as there is in all projections. The first issue is whether the statistical models used to characterise OECD growth between 1960 and 2000 accurately reflect the underlying determinants of growth. Economists disagree about the most appropriate way to model economic growth, and these estimates are based upon the specific form of endogenous growth models. Moreover, the execution of the estimation, including the measurement of cognitive skills and the allowance for other growth factors, incorporates additional elements of uncertainty. The second issue is the economic reality that is being projected. These projections trace the economy for 80 years into the future. A changing impact of cognitive skills on technological change and economic growth would clearly directly affect the specific estimates (although there is little reason to presume that it is more likely that the role of cognitive skills decreases as opposed to increases). Similarly, the present value of improved growth depends on the general health and growth of individual economies, which again is simply projected according to the historic patterns of the OECD nations. Other details, including how heavily future incomes are discounted and the time span for the calculations, also enter the specific projections.
Nonetheless, even reducing the projections substantially to allow for plausible minimal estimates suggests very large implications of improved cognitive skills and human capital. If the estimated impacts of cognitive skills were twice as large as the true underlying causal impact on growth, the resulting present value of successful school reform still far exceeds any conceivable costs of improvement.
Changing schools and educational institutions is, of course, a difficult task. Moreover, countries that have attempted reforms of schools have often found that the results in terms of student achievement are relatively modest. At the same time, the results from countries achieving high and equitable learning outcomes in PISA – like Finland in Europe, Canada in North America or Japan and Korea in East Asia – or from those that have seen rapid improvements in the quality of schooling (like Poland) underline that doing better is possible. Concluding that change is “too difficult” would imply foregoing enormous gains to the well-being of OECD nations.
IntroductIon
Nations around the world seek to improve their schools in order to enhance the skills and employability of their youth or to reduce inequalities in economic outcomes found within their societies. But there are also countervailing forces, because changing schools is politically difficult. If the gains from change are not too large, it may not make sense to politicians and decision-makers to take any moves unpopular with the existing educational establishment. The evidence presented here, however, indicates that this reasoning is flawed. The potential gains from improving schools within developed countries appear truly enormous. This conclusion draws upon prior work delving into the determinants of economic growth. Work over the past two decades on why some countries have succeeded economically while others have not now provides a much clearer picture of the role of human capital in economic development. The human capital influence on growth is best characterised by the relationship between direct measures of cognitive skills and long-term economic development. The evidence points to differences in cognitive skills as an explanation of a majority of the differences in economic growth rates across OECD countries. Moreover, the available historical evidence indicates that differential skills have a very powerful and continuing impact.
The historical growth relationships provide a means for projecting out how improvements in schools would translate into economic results. Based on the historic patterns, it is possible to estimate both the time pattern and the ultimate impact of school quality improvements. The performance deficits of countries, measured by average scores on PISA tests and other international tests of mathematics and science, identify serious shortfalls in economic performance relative to economic possibilities.
An important aspect highlighted by these projections is the dynamic nature of human capital and growth. The basic characterisation of growth indicates that higher cognitive skills offer a path of continued economic improvement, so that favourable policies today have growing impacts in the future. The underlying idea is that economies with more human capital (measured by cognitive skills) innovate at a higher rate than those with less human capital, implying that nations with larger human capital in their workers keep seeing more productivity gains. Characterising the full ramifications of schooling outcomes requires tracing future developments far into the future.
These projections do not indicate how schools should be changed. Nor do they solve the political-economy issues of how any change should be achieved politically. They simply show the cost of inaction.
Projections into the future of course contain uncertainties. Important facets of uncertainty come both from structural aspects of world economies and from potential analytical problems. On the structural side, all of the projections assume that historical economic growth patterns of OECD countries from 1960 to 2000 give a good indication of how growth will evolve across the 21st century. On the analytical side, the projections rest on a series of statistical models that are assumed to accurately characterise the underlying factors that are most important for national economic growth – but it is difficult to rule out fully alternative explanations for the observed differences in growth across countries.
Obviously, learning does not end with school and an assessment of schooling outcomes such as PISA cannot reflect the skills which individuals acquire subsequently in their lives. However, evidence from longitudinal surveys in Australia, Canada and Denmark shows that performance in PISA is a strong and consistent predictor for subsequent educational experiences.
Plausible scenarios for educational improvement yield estimates of economic impact reaching USD 260 trillion when aggregated across OECD countries, suggesting that the importance of action must be taken seriously. Even if the historic patterns of growth are not fully realised in the future or even if the estimates of how cognitive skills affect growth are too optimistic, the potential impact on economic well-being remains
enormous. If the true impact of improved cognitive skills in the OECD countries were just half of these estimates, the impact on the well-being of OECD societies would still be considerably larger than, for example, the aggregate gains from smoothing out all future business cycles.
The next section describes analyses of human capital and economic growth. It provides a short review of alternative models of economic growth and links these to the progression of empirical analysis. From this, it summarises the best evidence on how cognitive skills affect economic growth. The third section then presents a series of simulations for OECD countries of various amounts of improvement in cognitive skills. The fourth section concludes and discusses some of the political-economy issues involved. Technical issues, including the development of measures of cognitive skills and the underlying statistical modelling, are presented in annexes.
the effect of educatIon on economIc growth
At any point in time, attention to economic policies that deal with current demand conditions and with business cycles always seems to take priority. Perhaps this has never been as true as in 2009, when the most obvious focus of attention was the worldwide recession. Without minimising the need to deal with current unemployment conditions, the message of this analysis is that considering issues of longer-run economic growth may be more important for the welfare of nations. Nobel Laureate Robert Lucas, in his presidential address to the American Economic Association, concluded that “Taking performance in the United States over the past 50 years as a benchmark, the potential for welfare gains from better long-run, supply-side policies exceeds by far the potential from further improvements in short-run demand management” (Lucas, 2003).
Economists have considered the process of economic growth for much of the last 100 years, but most studies remained as theory with little empirical work.1 Over the past two decades, economists linked analysis much more closely to empirical observations and in the process rediscovered the importance of growth.
The analysis here particularly concentrates on the role of human capital. Human capital has been a central focus of much of the recent growth modelling, and it is a standard element of any empirical work. Its importance from a policy perspective is clear and unquestionable.
The prior analytical work has nonetheless diverged in important ways. Economists have developed a number of alternative models designed to highlight important determinants of economic growth. These theoretical views about the determinants of growth have gone in a variety of directions (see Box 1). Two aspects of theoretical investigations stand out for the discussion here. First, each of the approaches suggests different empirical specifications for any statistical modelling. Second, while each of the approaches has some conceptual appeal, it has been difficult to test the validity of the alternatives in an adequate manner. The restricted variation of experiences across countries plus general data limitations have made it difficult to distinguish among the competing models of growth – and such is the case here.
This analysis adopts a general “endogenous growth” framework, for both conceptual and data reasons. Specifically, in this formulation nations with more human capital tend to continue to make greater productivity gains than nations with less human capital.2 The fact that the rate of technological change and productivity improvement is directly related to the stock of human capital of the nation makes it an endogenous growth model. The relationship between cognitive skills on the one hand and innovations and technology on the other seems to be a natural view of the role of education. At the same time, it is impossible within available data to test this approach against alternatives that do not have this linkage.
Box 1. theories of economic growth
Theoretical models of economic growth have emphasised different mechanisms through which education may affect economic growth. As a general summary, three theoretical models have been applied to the modelling of economic growth, and each has received support from the data. At the same time, it has been difficult to compare the alternative models and to choose among them based on the economic growth data.
The most straightforward modelling follows a standard characterisation of an aggregate production function where the output of the macro economy is a direct function of the capital and labour in the economy. The basic growth model of Solow (1957) began with such a description and then added an element of technological change to get the movement of the economy over time. The source or determinants of this technological change, although central to understanding economic growth, were not an integral part of the analysis. Augmented neoclassical growth theories, developed by Mankiw, Romer and Weil (1992), extend this analysis to incorporate education, stressing the role of education as a factor of production. Education can be accumulated, increasing the human capital of the labour force and thus the steady state level of aggregate income. The human capital component of growth comes through accumulation of more education that implies the economy moves from one steady state level to another; once at the new level, education exerts no further influence on growth. The common approach to estimating this model is to relate changes in GDP per worker to changes in education (and capital). This view of the role of human capital is fairly limited, because there are natural constraints on the amount of schooling in which a society will invest. It also fails to explain patterns of education expansion and growth for many developing countries (cf. Pritchett, 2006).
A very different view comes from the “endogenous growth” literature that has developed over the past two decades. In this work, a variety of researchers (importantly, Lucas, 1988, Romer, 1990a and Aghion and Howitt, 1998) stress the role of education in increasing the innovative capacity of the economy through developing new ideas and new technologies. These are called endogenous growth models because technological change is determined by economic forces within the model. Under these models, a given level of education can lead to a continuing stream of new ideas, thus making it possible for education to affect growth even when no new education is added to the economy. The common way to estimate these models is to relate changes in GDP per worker (or per capita) to the level of education.
A final view of education in production and growth centres on the diffusion of technologies. If new technologies increase firm productivity, countries can grow by adopting these new technologies more broadly. Theories of technological diffusion such as Nelson and Phelps (1966) , Welch (1970), and Benhabib and Spiegel (2005) stress that education may facilitate the transmission of knowledge needed to implement new technologies. In tests involving cross-country comparisons, Benhabib and Spiegel (1994) find a role for education in both the generation of ideas and in the diffusion of technology.
All approaches have in common that they see education as having a positive effect on growth. The latter two stress its impact on long-run growth trajectories.
Empirical growth analyses using school attainment data
The macroeconomic literature focusing on cross-country differences in economic growth has overwhelmingly employed measures related to school attainment, or years of schooling, to test the predictions of growth models.3 Initial analyses employed school enrolment ratios (e.g. Barro, 1991; Mankiw, Romer and Weil, 1992; Levine and Renelt,1992) as proxies for the human capital of an economy. An important extension by Barro and Lee (1993, 2001) was the development of internationally comparable data on average years of schooling for a large sample of countries and years, based on a combination of census and survey data.
The vast literature of cross-country growth regressions has tended to find a significant positive association between quantitative measures of schooling and economic growth.4 To give an idea of the robustness of this association, an extensive empirical analysis by Sala-i-Martin, Doppelhofer, and Miller (2004) of 67 explanatory variables in growth regressions on a sample of 88 countries found that primary schooling was the most robust influence factor on growth in GDP per capita in 1960-96 (after allowing for the faster growth in East Asia).5 However, average years of schooling are a particularly incomplete and potentially misleading measure of education for comparing the impacts of human capital on the economies of different countries. It implicitly assumes that a year of schooling delivers the same increase in knowledge and skills regardless of the education system. For example, a year of schooling in Kyrgyzstan (the country with the lowest performance in the PISA 2006 science assessment) is assumed to create the same increase in productive human capital as a year of schooling in Finland (the country with the highest performance in the PISA 2006 science assessment).6 Additionally, this measure assumes that formal schooling is the primary (sole) source of education and, again, that variations in non-school factors have a negligible effect on education outcomes. This neglect of cross-country differences in the quality of education and in the strength of family, health, and other influences is probably the major drawback of such a quantitative measure of schooling.
Empirical growth analyses considering cognitive skills
Over the past ten years, empirical growth research demonstrates that consideration of cognitive skills dramatically alters the assessment of the role of education and knowledge in the process of economic development. Using data from international student achievement tests, Hanushek and Kimko (2000) demonstrate a statistically and economically significant positive effect of cognitive skills on economic growth in 1960-90. Their estimates suggest that one country-level standard deviation higher test performance would yield around one percentage point higher annual growth rates. The country-level standard deviation is equivalent to 47 test-score points in the PISA 2000 mathematics assessment. Again, in terms of the PISA 2000 mathematics scores, 47 points would be roughly the average difference between Sweden and Japan (the best performer among OECD countries in 2000) or between the average Greek student and the OECD average score. One percentage point difference in growth is itself a very large value, because the average annual growth of OECD countries has been roughly 1.5%.
Their estimate stems from a statistical model that relates annual growth rates of real GDP per capita to the measure of cognitive skills, years of schooling, the initial level of income and a wide variety of other variables that might affect growth including in different specifications the population growth rates, political measures, or openness of the economies. The general concern, described in more detail below, is that things other than human capital are the real causes of some or all of the observed growth and that ignoring them in the statistical analysis artificially inflates the importance of cognitive skills. One solution to this is inclusion of the other factors in the statistical model.
The relationship between cognitive skills and economic growth has now been demonstrated in a range of studies. As reviewed in Hanushek and Woessmann (2008), these studies employ measures of cognitive skills that draw upon the international testing of PISA and of TIMSS (Trends in International Mathematics and
Science Study) (along with earlier versions of these).7 The uniform result is that the international achievement measures provide an accurate measure of the skills of the labour force in different countries and that these skills are closely tied to economic outcomes.8
This analysis follows in the lines of more recent work that measures human capital by cognitive skills instead of school attainment.
Measuring cognitive skills
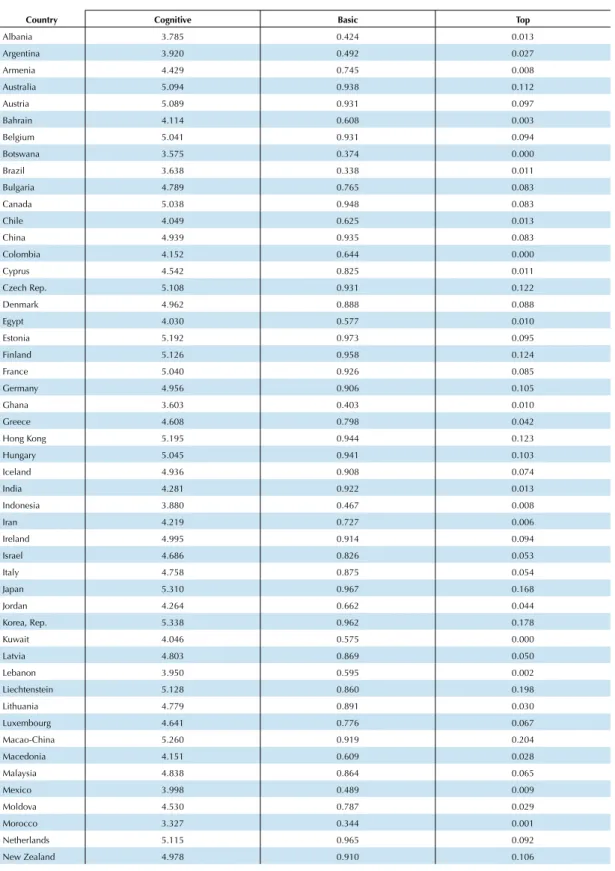
For the analysis here, a central issue is construction of a measure of the skills of a nation’s workforce that can be matched with economic outcomes. With few exceptions, however, direct measures of achievement of individuals in the labour force are unavailable, and analysis instead must rely upon skills measured during the schooling period.9 The analytical approach that underlies this analysis is to combine data from international tests given over the past 45 years in order to develop a single comparable measure of skills for each country that can be used to index skills of individuals in the labour force. As discussed below, this construction causes no problems if the relative performance of individuals in different countries has remained constant, but it could introduce problems if that is not true.
While the PISA tests are now well-known throughout the OECD, the history of testing is less understood. Between 1964 and 2003, 12 different international tests of mathematics, science, or reading were administered to a voluntarily participating group of countries (see Annex Tables A1 and A2). These include 36 different possible scores for year-age-test combinations (e.g. science for students of grade 8 in 1972 as part of the First International Science Study or mathematics of 15-year-olds in 2000 as a part of the Programme on International Student Assessment). Only the United States participated in all possible tests. The assessments are designed to identify a common set of expected skills, which were then tested in the local language. It is easier to do this in mathematics and science than in reading, and a majority of the international testing has focused on mathematics and science. Each test is newly constructed, until recently with no effort to link to any of the other tests. While the analysis here focuses on mathematics and science, these scores are highly correlated with reading test scores and employing just mathematics and science performance does not distort the growth relationship that is estimated; see Hanushek and Woessmann (2009). Also, the narrower measures do not imply that other skills are irrelevant, only that they tend to be closely related to mathematics and science skills at the national level.
The goal here is construction of consistent measures at the national level that will allow comparing performance across countries, even when they did not each participate in a common assessment. This section sketches the methodology. The details of this construction along with the final data are presented in Annex A.
The method of construction of aggregate country scores employed here focuses on transformations of the means and variances of the original country scores in order to put each into a common distribution of outcomes.10
Test-score levels across assessments. Comparisons of the difficulty of tests across time are readily possible in the United States because the country has participated in all assessments and because there is external information on the absolute level of performance of students in the United States of different ages and across subjects. The United States began consistent testing of a random sample of students around 1970 under the National Assessment of Educational Progress (NAEP). By using the pattern of NAEP scores for the United States over time, it is possible to equate student performance in the United States across each of the international tests.
Test-score variance across assessments. Each assessment has varying country participation and has different test construction so that the variance of scores for each assessment cannot be assumed to be constant. The
approach here is built on the observed variations of country means for a group of countries that have well developed and relatively stable educational systems over the time period.11 An “OECD Standardisation Group” (OSG) is created by using the 13 OECD countries that had half or more of the relevant population attaining a secondary education in the 1960s (the time of the first tests). For each assessment, the variance
Box 2. empirical growth models with cognitive skills
The endogenous growth models that are estimated here relate growth rates of GDP per capita to the initial level of GDP per capita, the years of school attainment, and the level of cognitive skills measured by mathematics and science scores on available international exams. Inclusion of initial income reflects the fact that lower income countries just have to imitate more developed countries and will find this easier than innovating with new products, technologies, or production techniques (often called conditional convergence).
The basic estimation employs a sample of 23 OECD countries for which appropriate economic data are available for the period of 1960-2000. (Hanushek and Woessmann (2008) provide estimates for an expanded sample of 50 countries that are very similar to those presented below).
Ideally, one would want the level of test performance for the workers in the economy, and not just the test performance of students who range in age from roughly 10-18 years old. The analysis assumes that the average scores observed for students are a good proxy of labour-force skills. This assumption would clearly be satisfied if the educational outcomes within countries remain roughly constant. There is some indication that this is not the case (see Figure 6), which would tend to introduce some error into these measures. Nonetheless, in one set of tests, scores before 1984 are linked to growth from 1980-2000, thus getting the timing closer to ideal, and the estimated effects are somewhat larger than found for the full period (Hanushek and Woessmann, 2009). In general, this kind of measurement error will tend to lead to estimates of the impact of skills that is biased downward.
The basic model estimated for the 23 OECD countries is:
g = -3.54 - 0.30 GDP/capita1960 + 1.74 C + 0.025 SR2=0.83 (2.0) (5.8) (4.2) (0.3)
where g is the average annual growth rate in GDP per capita between 1960 and 2000,
GDP/capita1960 is initial national income, C is the composite measure of cognitive skills, and S is years of schooling (measured in 1960, but qualitative results are the same when measured as average over 1960-2000). Absolute values of t-statistics are reported in parentheses below coefficients. (The sources of data are found in Annex B along with alternative estimation models.)
The estimated coefficient on cognitive skills implies that an increase of one standard deviation in performance (i.e., 100 on the PISA scale) would yield an annual growth rate that is 1.74 percentage points higher.
As discussed in the text, the estimates presume that GDP/capita1960, C, and S are the systematic determinants of growth rates and that other factors that might explain growth are uncorrelated with these. Moreover, C is assumed to cause g, and not the other way around. See text for analyses supporting these assumptions.
in country mean scores for the subset of the OECD Standardisation Group participating is calibrated to the variance observed on the PISA tests in 2000 (when all countries of the OECD Standardisation Group participate). While it is difficult to judge the accuracy of this estimation approach, it seems plausible that variations in test score construction are more significant than changes in country performance over time. By combining the adjustments in levels (based on the NAEP scores in the United States) and the adjustment in variances (based on the OECD Standardisation Group), it is possible to calculate standardised scores for all countries on all assessments. Each age group and subject is normalised to the PISA standard of mean 500 and individual standard deviation of 100 across OECD countries.
Basic facts of cognitive skills and economic growth
Combining the measures of achievement from the international tests with basic economic statistics permits analysing how skills affect subsequent outcomes. The basic elements of the underlying models are described in Box 2 and in the overview of the outcomes below. More details of the underlying analysis are found elsewhere.12
The extended empirical analysis relates long-term growth to cognitive skills and other aspects of national economies, relying upon an international dataset for 50 countries. These countries have participated in one or more the international testing occasions between 1964 and 2003 and have aggregate economic data for the period 1960-2000.13 The underlying statistical model relates average annual growth rates in real GDP per capita over the 1960-2000 period to GDP per capita in 1960, various measures of human capital (including the cognitive skills measure), and other factors that might influence growth. The inclusion of initial GDP per capita simple reflects the fact that it is easier to grow when one is farther from the technology frontier, because one just must imitate others rather than invent new things. Real GDP is called on a purchasing power parity basis.
The empirical approach is consistent with a basic endogenous growth model. Those models are based on the generation of ideas and new technologies, which seems consistent with the perspective and measurement of cognitive skills. Nonetheless, it is not possible to adequately distinguish among alternative forms of growth models within the limited cross-country data employed here.
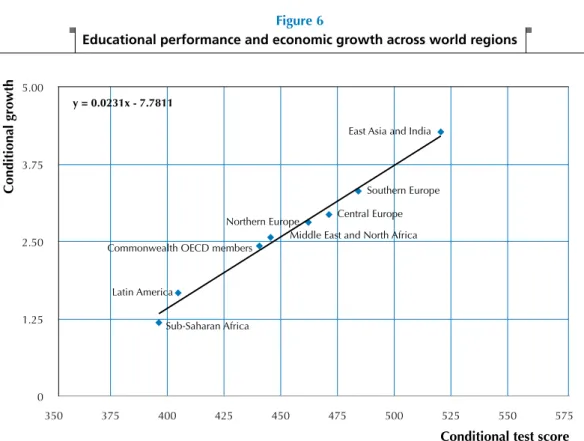
The simplest overview of the relationship is found in Figure 6 that plots regional growth in real per capita GDP between 1960 and 2000 against average test scores after allowing for differences in initial GDP per capita in 1960.14 Regional annual growth rates, which vary from 1.4% in Sub-Saharan Africa to 4.5% in East Asia, fall on a straight line.15 But school attainment, when added to this regression, is unrelated to growth-rate differences. Figure 6 suggests that, conditional on initial income levels, regional growth over the last four decades is completely described by differences in cognitive skills.
This aggregate regional analysis can be done over the same 1960-2000 time period for the 50 countries of the world with both test scores and economic data. Figure 7 also identifies individual OECD countries.16 There are two important messages from this. First, test scores are closely related to growth across the world. Second, the OECD countries fit well within the rest of the world on this plot.
The consistency of growth with test scores seen here with the previous regional picture is quite remarkable. Moreover, once information is included on cognitive skills, school attainment bears no relation to economic growth. In other words, added years of schooling do not affect growth unless they yield greater achievement.17 Of course, much of the observed cognitive skill is developed in schools, so this does not say that schools are irrelevant. It does say that the quality of schools, as determined by increases in student achievement, is very important.
Figure 7 also shows the ability of achievement differences to explain differences in growth rates just within the OECD countries. Some have argued that the differences in performance within the OECD are not large enough to have much impact on other outcomes – but the evidence suggests the opposite.
The underlying statistical estimates indicate a powerful effect of cognitive skills on growth. An improvement of one-half standard deviation in mathematics and science performance at the individual level implies, by historical experience, an increase in annual growth rates of GDP per capita of 0.87%. While more detail is provided about these improvements below, suffice it to say that Finland was approximately one-half standard deviation above the OECD average over the 2000-06 period. This historical impact suggests a very powerful response to improvements in educational quality.
Evidence on causality
Before going into any analysis of the implications of these differences, it is important to know whether to interpret the tight relationship between cognitive skills and growth as reflecting a causal relationship that can support direct policy actions. Work on cross-country growth analysis has been plagued by legitimate questions about whether any truly causal effects have been identified, or alternatively whether the estimated statistical analyses simply pick up a correlation without causal meaning. Perhaps the easiest way to see the problems is early discussion of how sensitive estimated growth relationships were to the precise factors that were included in the statistical work and to the country samples and time periods of the analyses (Levine and Renelt, 1992, Levine and Zervos, 1993). The sensitivity of the estimated models provided prima facie
evidence that various factors were omitted from many of the analyses.
Figure 6
Educational performance and economic growth across world regions
0 1.25 2.50 3.75 5.00
350 375 400 425 450 475 500 525 550 575
y = 0.0231x - 7.7811
Southern Europe East Asia and India
Central Europe Commonwealth OECD members
Latin America
Middle East and North Africa
Sub‐Saharan Africa Northern Europe
Notes: Added-variable plot of a regression of the average annual rate of growth (in percentage) of real GDP per capita in 1960-2000 on the initial level of real GDP per capita in 1960 and average test scores on international student achievement tests (mean of the unconditional variables added to each axis). Own depiction based on the database derived in Hanushek and Woessmann (2009).
Conditional gro
wth
Figure 7
Educational performance and economic growth in the full sample
0 1.75 3.50 5.25 7.00
350 375 400 425 450 475 500 525 550 575
y = 0.0198x - 6.1204
Korea Portugal Finland France United States Belgium Netherlands New Zealand United Kingdom Austria Italy Ireland Sweden Turkey Canada Switzerland Denmark Greece Mexico Norway Japan Australia Spain Iceland
Notes: Added-variable plot of a regression of the average annual rate of growth (in percentage) of real GDP per capita in 1960-2000 on the initial level of real GDP per capita in 1960, average test scores on international student achievement tests, and average years of schooling in 1960 (mean of the unconditional variables added to each axis). OECD countries are labeled by country codes for better readability and non-OECD countries by symbols only. Own depiction based on the database derived in Hanushek and Woessmann (2009).
Conditional gro
wth
Conditional test score
Whether or not this is a causal relationship is indeed a very important issue from a policy standpoint. It is essential to know that, if a country managed to improve its achievement in some manner, it would see a commensurate improvement in its long-run growth rate. Said differently, if the figures simply reflect other factors that are correlated with test scores, a change in test scores may have little or no impact on the economy (unless the other factors also changed). Indeed, analysis of prior estimates of school attainment have been identified as possibly reflecting reverse causality; i.e., improved growth leads to more schooling rather than the reverse (Bils and Klenow, 2000).
It is difficult to develop conclusive tests of causality issues within the limited sample of countries included in the analysis. Nonetheless, Hanushek and Woessmann (2009) pursue a number of different approaches to ruling out major factors that could confound the results and that could lead to incorrect conclusions about the potential impact. In the end, none of the approaches addresses all of the important issues. Each approach fails to be conclusive for easily identified reasons. However, the combination of approaches, with similar
support for the underlying growth models, provides some assurance that the most obvious problematic issues are not driving the results. First, this estimated relationship is little affected by including other possible determinants of economic growth. In an extensive investigation of alternative model specifications, different measures of cognitive skills, various groupings of countries including eliminating regional differences, and specific sub-periods of economic growth, Hanushek and Woessmann (2009) show a consistency of the alternative estimates – both in terms of quantitative impacts and statistical significance – that is uncommon to most cross-country growth modelling. Moreover, these estimates complement prior findings that measures of geographical location, political stability, capital stock, population growth, and school inputs (pupil-teacher ratios and various measures of spending) do not significantly affect the estimated impact of cognitive skills.18 The only substantial effect on the estimates is the inclusion of various measures of economic institutions (security of property rights and openness of the economy) which reduces the estimated impact of cognitive skills by 15%.19 These specification tests rule out some basic problems of omitted causal factors that have been seen in other work, but of course there are other possible omitted factors.20
Second, to tackle the most obvious reverse-causality issues, Hanushek and Woessmann (2009) separate the timing of the analysis by estimating the effect of scores on tests conducted until the early 1980s on economic growth in 1980-2000. In this analysis, available for a smaller sample of countries only, test scores pre-date the growth period. The estimate shows a significant positive effect that is about twice as large as the coefficient used in the simulations here. In addition, reverse causality from growth to test scores is also unlikely because additional resource in the school system (which might become affordable with increased growth) do not relate systematically to improved test scores (e.g. Hanushek, 2002).
Third, the analysis traces the impact on growth of just the variations in achievement that arise from institutional characteristics of each country’s school system (exit examinations, autonomy, and private schooling).21 This estimated impact is essentially the same as previously reported, lending support both to the causal impact of more cognitive skills and to the conclusion that schooling policies can have direct economic returns. Nonetheless, countries that have good economic institutions may have good schooling
Figure 8
Trends in educational performance and trends in economic growth rates
-0.1500 -0.1125 -0.0750 -0.0375 0 0.0375 0.0750 0.1125 0.1500
-0.750 -0.375 0 0.375 0.750 1.125 1.500
y = 0.1339x - 0.0539
New Zealand Netherlands Sweden Australia Belgium Germany Italy United States France Japan Finland United Kingdom
Notes: Scatter plot of trend in the growth rate of GDP per capita from 1975 to 2000 against trend in test scores for countries whose test scores range back before 1972. Own depiction based on the database derived in Hanushek and Woessmann (2009).
Trend in gro
wth r
ate
institutions, so that this approach, while guarding against simple reverse causality, cannot eliminate a variety of issues of omitted factors in the growth regressions.22
Fourth, one major concern is that countries with good economies also have good school systems – implying that those that grow faster because of the basic economic factors also have high achievement. To deal with this, immigrants to the United States who have been educated in their home countries are compared to those who were educated in the United States. Since it is the single labour market of the United States, any differences in labour-market returns associated with cognitive skills cannot arise because of differences in the economies of their home country. Looking at labour-market returns, the cognitive skills seen in the immigrant’s home country lead to higher incomes – but only if the immigrant was educated at home. Immigrants from the same home country schooled in the United States see no economic return to home-country quality, thus pinpointing the value of better schools.23 While not free from problems, this difference-in-differences approach rules out the possibility that test scores simply reflect cultural factors or economic institutions of the home country.24 It also provides further support to the potential role of schools to change the cognitive skills of citizens in economically meaningful ways.
Finally, perhaps the toughest test of causality is reliance on how changes in test scores over time lead to
changes in growth rates. This approach eliminates country-specific economic and cultural factors. Figure 8 simply plots trends in educational performance and trends in growth rates over time for OECD countries.25 This investigation provides more evidence of the causal influence of cognitive skills. The gains in test scores over time are related to the gains in growth rates over time.26 As with the other approaches, this analysis must presume that the pattern of achievement changes has been occurring over a long time, because it is not the achievement of school children but the skills of workers that count. Nonetheless, the consistency of the patterns and the similarities of magnitudes of the estimates to the basic growth models is striking (see Hanushek and Woessmann, 2009).
Again, each approach to providing a deeper look at the issue of causation is subject to its own uncertainty. Nonetheless, the combined evidence consistently points to the conclusion that differences in cognitive skills lead to economically significant differences in economic growth. Moreover, even if some issues of omitted factors or reverse causation remain, it seems very unlikely that these cause all of the estimated effect – something that enters into the interpretation of the projections below.
Since the tests concentrate on the impact of schools, the evidence also suggests that school policy can, if effective in raising cognitive skills, be an important force in economic development. While other factors – cultural, health, and so forth – may affect the level of cognitive skills in an economy, schools also contribute to the relevant human capital.
the economIc costs of low educatIonal achIevement
The historical record on the relationship between cognitive skills and economic growth provides a means of directly evaluating the benefits from any educational reform programmes. Or, read the other way, it can provide an indication of the cost of not improving schools. Without taking a position on how much school improvement is possible, desirable, or likely, the analysis uses several alternative benchmarks to provide country-specific information about the economic impact of change.
Simulation approach
The prior analysis provides an indication of the long-run impact on growth rates of a labour force with varying skills as measured by mathematics and science scores of students enrolled in school. This long-run relationship does not, however, describe the path of benefits from any programme of changing the skills of the population. A variety of programmes, as noted previously, could improve the cognitive skills of
the population – including health programmes, schooling programmes, the introduction of new teaching technologies, and the like. For this analysis, however, the entire focus is schooling programmes, because schools are the locus of a large share of governmental policies today.
It is important to understand the dynamics of economic impacts of programmes. Three elements of the dynamics are particularly important for consideration: first, programmes to improve cognitive skills through schools take time to implement and to have their impact on students. It is simply not possible to change learning over night. Second, the impact of improved skills will not be realised until the students with greater skills move into the labour force. Third, the economy will respond over time as new technologies are developed and implemented, making use of the new higher skills.
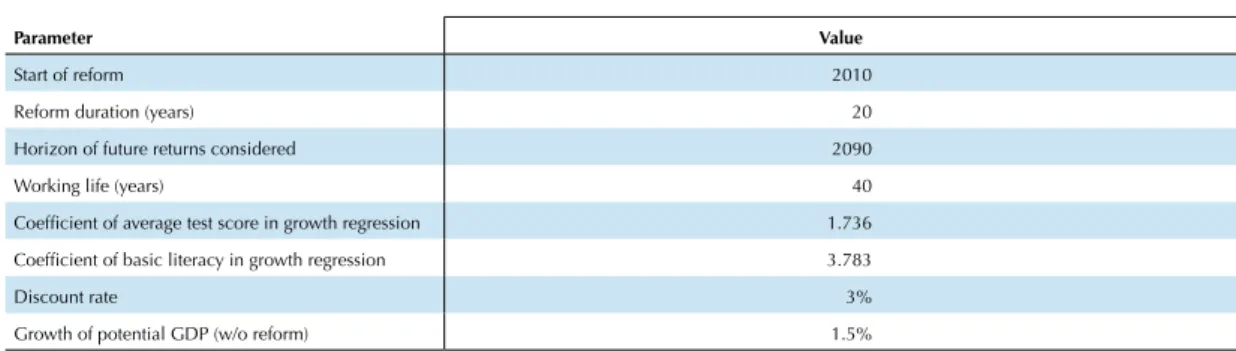
In order to capture these elements, a simple simulation model is employed (the details of the simulation are shown in Annex C). The underlying idea is that moving from one quality level to another of the workforce depends on the shares of workers with different skills. As such, the impact of skills on GDP at any point in time will be proportional to the average skill levels of workers in the economy. The expected work life is assumed to be 40 years, which implies that each new cohort of workers is 2.5% of the workforce. Thus, even after an educational reform is fully implemented, it takes 40 years until the full labour force is at the new skill level. In order to consider the impacts of improvement on OECD countries, the simulations rely on the estimates of growth relationships derived from the 23 OECD countries with complete data. These estimates suggest that a 50-point higher average PISA score (i.e., one-half standard deviation higher) would be associated with 0.87% higher annual growth. This estimate clearly includes some uncertainty, a factor that is also included in the simulations below (see Box 2 and Annex B for details of the underlying models).
The simulations are conducted for all of the OECD countries and assume that each country can simultaneously grow faster. In other words, the higher levels of human capital in each country allow it to innovate, to improve its production, and to import new technologies without detracting from the growth prospects for other countries.27 Further, the estimates ignore any other aspect of interactions such as migration of skilled labour across borders. Of course, one way that a country could improve its human capital would be by arranging for its youth to obtain schooling in another country with better schools – as long as the more educated youth return to their home country to work.
The simulation does not adopt any specific reform package but instead focuses just on the ultimate change in achievement. For the purposes here, reforms are assumed to take 20 years to complete, and the path of increased achievement during the reform period is taken as linear. For example, an average improvement of 25 points on PISA is assumed to reflect a gain of 1.25 points per year. This might be realistic, for example, when the reform relies upon a process of upgrading the skills of teachers – either by training for existing teachers or by changing the workforce through replacement of existing teachers. This linear path dictates the quality of new cohorts of workers at each point in time. To gauge the magnitude of such changes, Poland, the country that displayed the largest improvement in PISA, improved its performance in reading by 29 points between 2000 and 2006. The dynamic nature of reform on the economy implies that the benefits to the economy from any improvement continue to evolve after the reform is completed. This characteristic, again, is an outgrowth of the growth models that are estimated, where improvements in technology and productivity are related to the level of skills of the workforce.
It is possible to summarise these changes in different ways, and it is important to understand the meaning of each. Perhaps the simplest way to see the impact of any improvement in cognitive skills is to trace out the increased GDP per capita that would be expected at any point in the future. The prior estimates of the effect on economic growth of differences in cognitive skills yield a path of relative gains in GDP per capita. Thus,
for example, it is possible to say what percentage increase in GDP per capita would be expected in 2050, given a specific change in skills started today. These changes are relative to the GDP in 2050, since the prior work indicates the marginal changes in growth rates that would be expected from higher skills.
An alternative approach is to summarise the economic value of the entire dynamic path of improvement in GDP per capita. Doing this is more difficult than the previous evaluation because the results will be dependent on a variety of additional factors. The value of improvement in economic outcomes from added growth depends, of course, on the path of economies that would be obtained without educational improvement. The analysis here takes the annual growth of OECD economies in the absence of education reform to be 1.5%. This is simply the average annual growth rate of potential GDP per worker of the OECD area over the past two decades: 1.5% in 1987-96 and 1.4% in 1997-2006 (OECD, 2009a).
The length of the time period over which gains are calculated is somewhat arbitrary and depends in part on the use of the analysis for any policy decisions. The benchmark here considers all economic returns that arise during the lifetime of a child that is born at the beginning of the reform in 2010. According to the most recent data (that refer to 2006), a simple average of male and female life expectancy at birth over all OECD countries is 79 years (OECD, 2009b).28 Therefore, the calculations will take a time horizon until 2090, considering all future returns that accrue until then, but neglecting any returns that accrue after 2090. Finally, because economic benefits accrue at varying times into the future, it is important to recognise that more immediate benefits are both more valuable and more certain than those far in the future. In order to incorporate this, the entire stream is converted into a present discounted value. In simplest terms, the present discounted value is the current dollar amount that would be equivalent to the future stream of returns calculated from the growth model. If we had that amount of funds and invested it today, it would be possible to reproduce the future stream of economic benefits from the principal amount and the investment returns. Thus, this calculation of present discount value allows a relevant comparison for any other current policy actions. In doing so, the discount rate at which to adjust future benefits becomes an important parameter. A standard value of the social discount rate used in long-term projections on the sustainability of pension systems and public finance is 3% (e.g. Börsch-Supan, 2000, Hagist, Klusen, Plate and Raffelhüschen, 2005), a precedent that is followed here.29 By contrast, the influential Stern Review report that estimates the cost of climate change uses a discount rate of only 1.4%, thereby giving a much higher value to future costs and benefits (Stern, 2007). If this practice were followed here, the discounted values of the considered education reforms would be substantially bigger than reported here.30
Scenario I: Increase average performance by 25 PISA points
A simple starting point is to consider the economic impact on OECD countries of a 25-point increase on PISA scores (the country with the largest performance increase in PISA scores between 2000 and 2006 was Poland, with an increase of 29 score points in the reading assessment.)31 The economic models (presented in Annex B) relate this gain (0.25 standard deviation of improvement) to economic growth. (The precise estimates consider a reform policy that is begun in 2010 and that on average yields 25 point higher scores in 2030 that remain permanently at that level for all subsequent students.)32
A policy like this is uniform across countries, so the relative improvement is the same for all countries.33 Figure 9 provides a summary of the impact on GDP for each year into the future. While there are no impacts initially until higher-achieving students start becoming more significant in the labour market, GDP will be more than 3% higher than what would be expected without improvements in human capital as early as 2042. (The figure also shows a 95% confidence bound of 1.5 - 4.6% higher GDP, based on the relevant bounds for the regression coefficient in Box 2.) By the end of expected life in 2090 for the person born in 2010, GDP per capita would be expected to be about 25% above the “education as usual” level.
Figure 9
Improvement in annual GDP with Scenario I
(improve student performance by 25 points on the PISA scale)
0% 15% 30% 45% 60%
2010 2020 2030 2040 2050 2060 2070 2080 2090 2100 2110
Notes: GDP with reform relative to GDP without reform in each year after the reform starts. Main line: point estimate of Scenario I. Gray dotted lines: 95% confidence interval of the point estimate of the growth regression. Authors’ calculations.
% a dd iti on to a nn ua l G D P Year
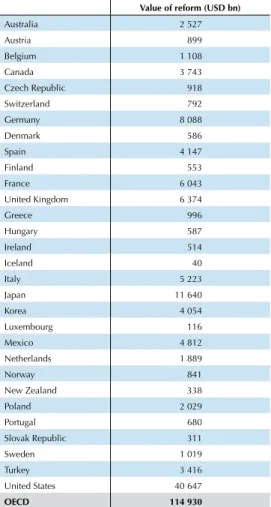
Table 1 Effect on GDP of Scenario I: Increase average performance by 25 points on PISA, or by ¼ standard deviation Value of reform (USD bn)
Australia 2 527
Austria 899
Belgium 1 108
Canada 3 743
Czech Republic 918
Switzerland 792
Germany 8 088
Denmark 586
Spain 4 147
Finland 553
France 6 043
United Kingdom 6 374
Greece 996
Hungary 587
Ireland 514
Iceland 40
Italy 5 223
Japan 11 640
Korea 4 054
Luxembourg 116
Mexico 4 812
Netherlands 1 889
Norway 841
New Zealand 338
Poland 2 029
Portugal 680
Slovak Republic 311
Sweden 1 019
Turkey 3 416
United States 40 647
OECD 114 930