Using the Collegiate Learning Assessment (CLA) to
Inform Campus Planning
Anne L. Hafner
University Assessment Coordinator
CSULA
Using the Collegiate Learning Assessment (CLA) to
Inform Campus Planning
CSULA 2007
The Collegiate Learning Assessment (CLA) is a performance assessment of college students’ critical thinking, analytic reasoning, and problem solving and written communication skills.
Developed by a group of academics with the Council for Aid to Education (CAE), the CLA assesses the “value added” by an institution to key higher order skills of its students. The most common model used by campuses is a cross-sectional one in which a sample of at least 100 freshmen and 100 seniors are tested and compared as to their growth. Students' SAT scores are also collected, to enable comparison of students' “expected” CLA scores (based on a student SAT score) vs. the students’ actual CLA scores. Because the samples of freshmen tested at a particular school may not accurately represent their respective class at each college, CAE makes an adjustment in that a school’s actual CLA score is compared to its expected CLA score,
Differences between actual and expected score are reported in two ways: by points on the CLA scale and by standard errors in terms of five performance levels. The five performance levels are: scores well below expected (actual score greater than 2 standard errors lower than expected score), actual score below expected (actual score greater than 1 standard error but less than 2 standard errors lower than expected score), scores at expected (actual score between -1 s.e. and +1 s.e. from expected score), scores above expected (actual score from 1-2 s.e. above expected score), and scores well above expected (actual score as least 2 s.e. above expected score).
Methods
In fall of 2006, CSULA began its administration of the CLA. Freshman students were recruited to take the test. Because of time constraints and scheduling, the testing period was compressed. Each student took either the performance task or the writing task in 90 minutes. Approximately 110 students were tested. 102 students had complete data. Test data were reported back to CSULA by CAE in February 2007. A data file was compiled that included the CLA subscores, scale scores, performance levels on subtests, and total test, SAT scores, sex, major field, primary language, HSGPA, English Placement Test (EPT) scores, and math placement test (ELM) score.
In addition, the CAE sent an “Interim Institutional Report” for CSULA that included an Executive Summary, background on the tests, information on scores, characteristics of participating
institutions and students, tables, figures and appendices.
Performance Tasks
The first type of test is a performance task that asks students to use a set of critical thinking, analytical reasoning, problem solving and written communication skills to answer open-ended question about a task or situation. The task includes a document library with a range of sources (e.g. letters, memos, articles, photos, charts, etc). Students are asked to use their materials in preparing and answering the performance task within 90 minutes. In the task, students are expected to present ideas clearly and to cite sources in the document library that support the points. According
to CAE, no two performance tasks assess the same combination of abilities. Students may have to weigh different pieces of evidence, evaluate the validity of documents, spot biases, and identify questionable or critical assumptions. “ (Collegiate Learning Assessment Interim Institutional Report, CSULA, Fall 2006).
The other type of test is an analytic writing task. Two types of essay prompts are possible, “make an argument” or “critique an argument”. Both tasks measure a student’s ability to articulate ideas, examine claims, support ideas with reasons and examples, sustain a coherent discussion and use standard written English. Students are given 45 minutes to either address an issue in making an argument or critique an argument.
Findings Institutional Report CLA
The Executive Summary reported that the major question to be answered was “How did our freshmen score after taking into account their academic abilities?”
The average SAT score of the freshman sample was 922. Based on this score, CAE predicted the sample’s average CLA score to be 981. However, the freshmen scored 1041, which was 60 points above expected. Overall, the difference between actual and expected was 1.4 standard error units, thus the sample was found to score at the Above Expected Level.
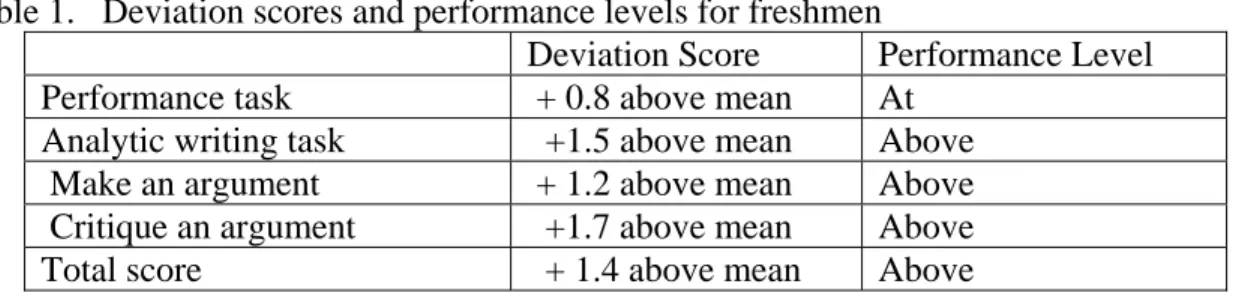
In terms of CSULA student performance on the different CLA tests, results are shown in the table below. In almost all of the cases, CSULA students performed above expected. Only for the performance task did the students perform at expected level. The students performed best on the critique an argument task and at expected level on the performance task. It is likely that students may not have had opportunities to perform similar tasks in high school.
Table 1. Deviation scores and performance levels for freshmen
Deviation Score Performance Level Performance task + 0.8 above mean At
Analytic writing task +1.5 above mean Above Make an argument + 1.2 above mean Above Critique an argument +1.7 above mean Above
Total score + 1.4 above mean Above
The CLA report also presented mean scores for freshmen at CSULA and at all CLA-participating schools. CSULA students scored lower than all schools on the performance task, lower than all students on the analytic writing task, below all students on the make an argument task, below the average total scores, and below the average SAT score for all schools (922 vs. 1067) As such, it should be noted that it is not recommended that such means from individual institutions be compared with all institutions in the population, as colleges differ vastly in their makeup and
characteristics. The focus in using the CLA is to determine value added by a particular institution. It is valid to compare campuses in terms of the value added from freshman year to senior year, as the scale is a standardized one that controls for students’ academic abilities (and by so doing, also controls for selectivity and SES).
CSULA Data File Findings
Data analysis showed that 75% of the sample was female and that about 50% had English as a first language. These percentages are similar to the institution’s percentage of females and English learners. The sample’s average high school GPA was 3.20, its average SAT Verbal score was 455, and average SAT math was 462. The sample’s average on the EPT was 143 and the sample’s average on the ELM was 46. In terms of broad fields of study, 16% were in science or engineering, 10% in social sciences, 6% in humanities, 14% in business, 32% in helping professions and 23% undecided.
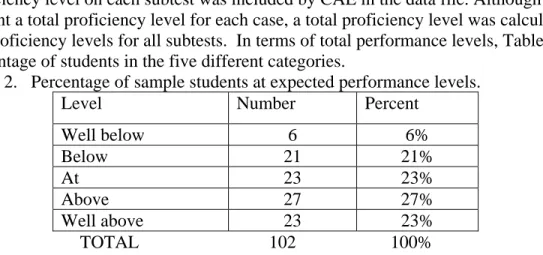
Although not every student took every subtest because of time constraints, each student's proficiency level on each subtest was included by CAE in the data file. Although CAE did not present a total proficiency level for each case, a total proficiency level was calculated by averaging the proficiency levels for all subtests. In terms of total performance levels, Table 2 summarizes the percentage of students in the five different categories.
Table 2. Percentage of sample students at expected performance levels.
Level Number Percent
Well below 6 6%
Below 21 21%
At 23 23%
Above 27 27%
Well above 23 23%
TOTAL 102 100%
To summarize, 27% were below or well below, 23% were at expected level, and 50% were above or well above expected performance level.
The average scores for the SAT Verbal, SAT math, ELM and EPT were compared for the CLA freshman sample and the fall 2006 freshman population at CSULA. Table 3 below shows that the sample scored higher than the population on SAT Verbal and Math, and on the ELM. However, the sample scored only slightly above the population on the EPT (142.9 vs. 141.3).
Table 3. Test scores for CLA sample and 2006 freshman population Test All freshmen fall 2006 CLA sample
SAT Verbal 437 455
SAT Math 452 462
ELM 39.4 45.9
EPT 141.3 142.9
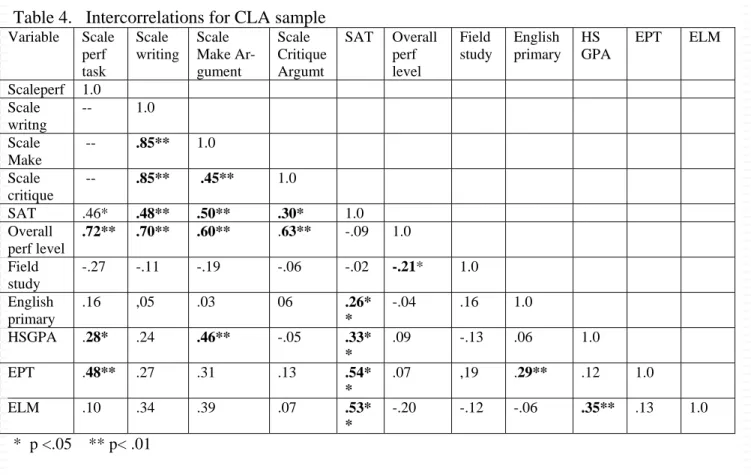
Correlations were run for CLA scale scores, SAT scores, overall performance level, gender, field of study, English as primary language, HSGPA, EPT and ELM scores.
None of the correlations for gender were significant, so they were not included in the following table. Correlations for gender were mostly negative, so males tended to score higher than females.
Table 4. Intercorrelations for CLA sample Variable Scale perf task Scale writing Scale Make Ar-gument Scale Critique Argumt SAT Overall perf level Field study English primary HS GPA EPT ELM
Scaleperf 1.0
Scale writng
-- 1.0
Scale Make
-- .85** 1.0
Scale critique
-- .85** .45** 1.0
SAT .46* .48** .50** .30* 1.0
Overall perf level
.72** .70** .60** .63** -.09 1.0
Field study
-.27 -.11 -.19 -.06 -.02 -.21* 1.0
English primary
.16 ,05 .03 06 .26*
*
-.04 .16 1.0
HSGPA .28* .24 .46** -.05 .33* *
.09 -.13 .06 1.0
EPT .48** .27 .31 .13 .54*
*
.07 ,19 .29** .12 1.0
ELM .10 .34 .39 .07 .53*
*
-.20 -.12 -.06 .35** .13 1.0 * p <.05 ** p< .01
As expected, the CLA writing scale scores were moderately to highly inter-correlated (from .45 to .85). Scale scores for the performance task were not correlated with the writing tasks, as a student took either the performance task or the writing tasks. Scale score on the performance task was significantly correlated with EPT score (.48), with SAT score (.46), and with HSGPA (.28). Scale score performance task correlated significantly and highly with overall performance level (.72)
Students’ SAT score was moderately correlated with scale Critique an Argument (.30), scale Make an Argument (.50) and scale writing task (.48). The SAT was also significantly and moderately correlated with EPT (.54), ELM (.53), HSPA (.33) and English as a primary language (.26).
Interestingly, the overall performance level did not have any significant positive predictors other than with CLA writing and performance scale scores (.60-.72). Overall performance level correlates only .09 with SAT, and -.21 with field of study (students in science, engineering and social sciences were more likely to show high performance levels). Overall performance level correlated -.20 with ELM (low scoring students on ELM showed higher overall proficiency, but was not significant. These all indicate that the CLA is measuring something other than the knowledge and skills measured by the SAT, EPT, ELM and GPA.
Several regressions were carried out to ascertain whether the SAT, HSGPA, EPT, ELM and English primary were predictors of scale score writing, scale score performance task and overall
performance levels. None of the predictors were significant in the regressions.
Several conclusions can be made:
The CLA sample was not equivalent to the CSULA 2006 freshman population in terms of test scores (CAE maintains that this is not a problem)
The CLA sample’s demographics were similar to campus demographics.
The CLA sample scored higher than expected on the CLA tasks and 50% scored above or well above the expected performance level
CLA writing task scale scores were highly inter-correlated
Scale score performance task was moderately correlated w/ EPT(.48), SAT (.46) and HSGPA (.28)
Overall performance level correlated moderately high with CLA writing and performance scale scores, but had no other significant positive correlates
Writing scale scores correlated moderately with SAT (.48)
SAT score was moderately correlated with scale Make an Argument and Critique an Argument.
SAT score was significantly and moderately correlated with EPT, ELM, HSGPA and English as a primary language.
CLA is moderately related to other tests such as EPT and SAT, but appears to be measuring something different from the knowledge and skills measured by the tests and GPA
English as a primary language was not significantly correlated with any of the CLA subscales; however, it was significantly correlated with SAT and EPT scores. Students with English as a primary language score higher on SAT and EPT, but do not score significantly higher than non-English language students on the CLA measures.
There are some implications that can be drawn. CSULA will test its seniors this spring and obtain the data from CAE in summer. We anticipate getting gain scores in points and in standard deviation units. This will inform the campus as to how much value has been added by attending our campus. It is possible to look at gains by task (e.g. performance task. vs. writing tasks) to ascertain whether students perform better on certain types of tasks. In the freshman analysis, student performed better on Critique an Argument (1.7 s. d. above expected) compared with on the performance tasks (0.8 standard error or at expected). It is likely that few freshmen have had opportunities to work on performance tasks similar to those in the CLA.
In the future, it may be preferable to embed the CLA tasks in a freshman-required class such as Introduction to College or Orientation. That way, incentives would not be necessary and a larger, more representative sample could be obtained. At senior year, it would be possible to embed the test into a course such as a capstone course or comprehensive exam course. It could be made a graduation requirement and it would almost surely be a useful measure of GE outcomes including writing, and critical thinking. If possible, junior transfers could be assessed in the fall with the freshmen, as the transfer students may be considerably different from the freshman entrants.
The major burdens on a campus are a) staff time to recruit students and administer the test; b) high cost of enrollment incentives; and c) time required to take the test (90 minutes). The basic cost to administer the test to a student is inexpensive.
The CAE is currently working to create a standards-based framework for the CLA, which will enable it to link standards to performance on subscales or total score to enable judgments on “percent proficient.” This may make the use of the test more desirable and useful to campuses.