4th International Workshop on
Program
Comprehension
through Dynamic
Analysis
co-located with the 15
thInternational Working
Conference on Reverse Engineering (WCRE’08)
October 16
th, 2008 – Antwerp, Belgium
Technical report TUD-SERG-2008-036
Software Engineering Research Group
Delft University of Technology
The Netherlands
Contents
On Execution Traces
Visualizing an Execution Trace as a Compact Sequence Diagram
Using Dominance Algorithms ... 1 Yui Watanabe, Takashi Ishio, Yoshiro Ito, Katsuro Inoue
Using a Sequence Alignment Algorithm to Identify Specific and Common Code
from Execution Traces... 6 Marcelo de A. Maia, Victor Sobreira, Klérisson R. Paixão, Sandra A. de Amo, Ilmério R. Silva
Pattern of feature detection
Behavioral Design Pattern Detection through Dynamic Analysis ... 11 Francesca Arcelli, Fabrizio Perin, Claudia Raibulet, Stefano Ravani
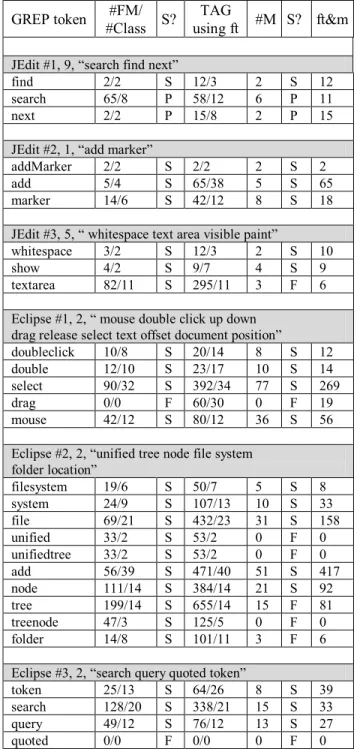
TAG (TrAce+Grep): a Simple Feature Location Approach ... 17 Dapeng Liu, Monica Brockmeyer, Shaochun Xu
Tools
A Cognitively Aware Dynamic Analysis Tool for Program Comprehension... 22 Iyad Zayour, Abdelwahab Hamou-Lhadj
Towards Seamless and Ubiquitous Availability of Dynamic Information in IDEs ... 27 David Röthlisberger and Orla Greevy
Applications of Dynamic Analysis
Using Dynamic Analysis for API Migration ... 32 Lrla ea Haensenberger, Adrian Kuhn, Oscar Nierstrasz
Applying Static and Dynamic Analysis in a Legacy System to Study the
Behaviour of Patterns of Code during Executions: an Industrial Experience ... 37 Rim Chaabane, Françoise Balmas
Program Chairs
Orla Greevy Software Engineering gmbh Switzerland [email protected] Abdelwahab Hamou-LhadjDepartment of Electrical and Computer Engineering Concordia University,
Montreal, Canada [email protected] David Röthlisberger Software Composition Group
Institut fur Informatik und angewandte Mathematik University of Bern
Switzerland
[email protected] Andy Zaidman
Software Engineering Research Group Delft University of Technology The Netherlands
Program Committee
Edna BraunUniversity of Ottawa, Canada Constantinos Constantinides Concordia University, Canada Serge Demeyer
University of Antwerp, Belgium Wim De Pauw
IBM, USA Philippe Dugerdil
Haute école de gestion de Genève, Switzerland Adrian Kuhn
University of Bern, Switzerland Adrian Lienhard
University of Bern, Switzerland Leon Moonen
Visualizing an Execution Trace as a Compact Sequence Diagram
Using Dominance Algorithms
Yui Watanabe, Takashi Ishio, Yoshiro Ito, Katsuro Inoue
Osaka University
1-3 Machikaneyama, Toyonaka, Osaka, 560-8531, Japan
{
wtnb-y, ishio, yito, inoue
}
@ist.osaka-u.ac.jp
Abstract
Visualizing an execution trace of an object-oriented sys-tem as sequence diagrams is effective to understand the behavior of the system. However, sequence diagrams ex-tracted from an execution trace are too large for develop-ers to inspect since a trace involves a large number of ob-jects and method calls. To support developers to under-stand extracted sequence diagrams, it is necessary to re-move the less important details of the diagrams. In this paper, we apply a dominance algorithm to a dynamic call graph among objects in order to detect and remove local objects contributing to internal behavior of dominator ob-jects. The case study shows our approach automatically re-moved about 40 percent of the objects from execution traces on average.
1. Introduction
Visualizing an execution trace of an object-oriented sys-tem as sequence diagrams is effective to understand the be-havior of the system since understanding dynamic bebe-havior of an object-oriented system is more difficult than under-standing its structure [1, 19]. A sequence diagram extracted from an execution trace visualizes actual collaborations of objects that provide a larger unit of program comprehension than classes [14]. Extracted diagrams also enable develop-ers to compare actual behavior of a program with its design. Although several tools supported such UML-based visu-alization [4, 7, 15], a sequence diagram extracted from an execution trace may be too large for developers to inspect since a trace involves a large number of objects and method calls. A simple approach to reducing the size of a sequence diagram is a filter to exclude objects and method calls us-ing their package, class and method names. Such name-based filtering approach is effective to remove well-known library such as JDK classes from sequence diagrams.
How-ever, to filter out objects and method calls in an application, developers have to know important packages, classes and methods before understanding the system. In addition, the approach does not work when a particular set of objects is more important than other instances of the same class. For example, a web application using a database may create a large number of objects representing records in a database but use only few of them to construct an output for users.
In this paper, we propose to apply dominance algorithms to instance-level filtering. While objects shared by several features are important to understand the relationship among features [10],local objectscontributing to only internal be-havior of their dominator objects are less important. We apply dominance algorithms to detect and remove local ob-jects in execution traces. In our approach, we first translate an execution trace to a dynamic call graph whose vertices and edges representing objects and method calls in execu-tion traces. Then, we compute dominance relaexecu-tion among objects. A dominator object and objects dominated by the dominator form a cluster such that objects out of the clus-ter access only the dominator object. We regard objects in a cluster except for the dominator as local objects. A se-quence diagram excluding local objects is still precise; the diagram includes all interactions among dominator objects shown in the diagram.
We have implemented our approach with an iterative dominance algorithm [2] and our sequence diagram extrac-tion tool named Amida [7]. We conducted a case study on four implementations of a web application, and found that 40% of objects are categorized into local objects on average. Although we need further case studies on software in differ-ent domains, our approach is promising to provide a com-pact sequence diagram extracted from an execution trace to developers .
The rest of this paper is organized as follows. Section 2 explains the background of this research. Section 3 de-scribes our approach to filtering local objects from sequence diagrams. Section 4 shows the result of a case study. Sec-tion 5 describes the summary and future work.
2. Background
Visualization of dynamic behavior of object-oriented programs is effective for program understanding and de-bugging. A popular approach is UML-based visualization [1]. For example, JIVE supports object interaction diagram and sequence diagram [4]. Shimba [15] and Amida [7] also support sequence diagram. To draw a compact dia-gram, Shimba can replace objects in the same package as a package object. Amida detects loops and recursive calls in a trace [16]. Several data compression approaches to de-tecting repeated method call sequences are investigated by Reiss [13].
Since UML-based visualization often outputs a large di-agram, several new viewers and summarization approaches are proposed. Pauw proposed a simple left-to-right layout of a call tree that works well with zoom-in/out functionality [11]. Cornelissen proposed Circular Bundle View that vi-sualizes an execution trace as a compact circular view [3]. These approaches are suitable to investigate an overview of a trace but not for developers to investigate the actual be-havior of a program.
To summarize an execution trace before visualization, Hamou-Lhadj proposed a utilityhood function to identify utility methods [6]. Their utilityhood definition is based on a simple idea: many methods depend on utility methods while utility methods depend on few other methods. This approach simply excludes utility-like method calls from traces. Therefore, a summarized sequence diagram may miss method call events connecting objects; such a diagram would be a good overview of a trace but it does not support developers who would like to investigate the precise behav-ior.
Phase detection divides an execution trace into phases that are corresponding to functional units in the trace [12, 18]. Reiss uses statistical information of method calls [12]. Our approach monitors a working set of objects [18]. Although these approaches can divide a large sequence dia-gram into several smaller pieces, resultant diadia-grams may be still large for developers to investigate.
In this paper, we apply dominance algorithms to identify local objects contributing to internal behavior of a particu-lar object. Our approach is based on a dynamic call graph whose vertices and edges represent objects and method calls in an execution trace, differently from utilityhood function based on static fan-in and fan-out of each method [6]. Dom-inance algorithm is already used for visualizing and navigat-ing a program dependence graph [5]. We hypothesized that dominance algorithm would be effective for a dynamic call graph since many temporary objects are created to achieve a task in a system and such objects are locally used and de-stroyed after the task [9, 17].
Our approach is an instance-level filtering approach
ex-cluding objects that are likely not important from an execu-tion trace. A simple name-based filtering approach does not distinguish instances; it simply removes all instances of the class from a trace. Shimba implements another approach that replaces all instances with a single actor representing a class [15]. These class-based approaches are not applica-ble when an instance of a class is more important than other instances of the same class. For example, a web applica-tion using a database may create a large number of objects representing records in a database but use only few of them to construct an output for users. On the other hand, JIVE allows developers to hide member objects that are stored in fields of another object [4]. This approach is also instance-level but developers have to manually specify fields con-taining internal objects. Our approach automatically detects local objects from an execution trace.
3. Visualization of Dominator Objects
We apply dominance algorithms to detect and remove lo-cal objects from an execution trace in order to visualize the execution trace as a compact sequence diagram. Our ap-proach comprises three steps. First, we construct a dynamic call graph from an execution trace. Next, we compute a dominance tree of the dynamic call graph. We regard ob-jects dominated by a dominator as local obob-jects contributing internal behavior of the dominator since only the dominator object interacts with dominated objects. Finally, we exclude local objects from an execution trace and visualize the re-sultant trace as a sequence diagram.
3.1. Dynamic Call Graph Construction In the first step, we construct a dynamic call graph from an execution trace. Vertices and edges of a dynamic call graph represent objects and method calls in an execution trace, respectively. It should be noted that our approach is described based on Java language but applicable to other object-oriented languages.
An execution trace in this paper is a sequence of method call events. A method call event records at least a caller objectcf romand a callee objectcto. To construct a dynamic call graph, first we prepare an empty graph G. For each method call fromcf rom tocto, a directed edge fromcf rom toctois added toG.
We have a rule to deal with static methods such asmain that are not belonging to any instance but a class. We translate each static method call into an individual vertex; for example, if a static method Arrays.sortis called twice in an execution trace, the resultant call graph contains two verticesvArrays.sort[1] andvArrays.sort[2]. We distin-guish these method calls since many static methods in util-ity classes such as ArraysandMathare independently
2 5 6 3
1 2 5 6 3 4 7 8 9
1 4 7 8 9
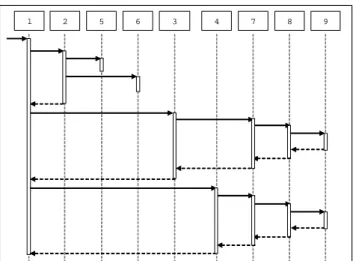
Figure 1. An example trace shown as a se-quence diagram
called from many call sites in general.
The above rule for static methods enables us to obtain a dynamic call graph Gwith a root vertex corresponding to the entry point of a program, i.e., main method. An execution trace shown in Figure 1 is translated to a dynamic call graph shown in the left hand side of Figure 2.
3.2. Dominance Tree Construction
We apply a dominance algorithm to a dynamic call graph in order to computedominance relationamong objects in an execution trace. Dominance relation is a relation between two nodes in a directed graphGthat has a single root node r. A vertexv dominatesanother vertexwinGif and only if every path fromr towcontainsv. Vertexv is the im-mediate dominator ofwifv dominateswand every other dominator ofwdominatesv[8]. Dominance relation in a graph forms a dominance tree; the direct ancestor of noden in a dominance tree is the immediate dominator ofn.
We can compute a dominance tree of a dynamic call graph since a dynamic call graph always has the single root mainas we described in Section 3.1. In implementation, we have used iterative but fast dominance algorithm [2]. The right hand side of Figure 2 is an example of a domi-nance tree that is computed from the left call graph. 3.3. Visualizing Sequence Diagram
A dominance tree for objects involved in an execution trace indicates locality of interaction. Interaction among a dominator object and its descendant objects is invisible from other objects in the execution trace. Therefore, we re-gard descendant objects as local objects of their immediate
5 1 2 4 7 9 8 3 6 9 8 5 2 7 1 3 4 6 5 1 2 4 7 9 8 3 6 5 1 2 4 7 9 8 3 6 9 8 5 2 7 1 3 4 6 9 8 5 2 7 1 3 4 6
Figure 2. A dynamic call graph of a trace in Figure 1 and its dominance tree
2 3 4 7
1 2 3 4 7
1
Figure 3. A reduced sequence diagram ex-cluding local objects from Figure 1
dominator object. A sequence diagram excluding local ob-jects still involves all method calls among non-local obob-jects in the diagram.
To visualize a trace excluding local objects as a sequence diagram, we classify objects into clusters. For each domi-natord, we create a clusterc(d)involving all objects domi-nated byd. The resultant clusters satisfy the following char-acteristics:
• Each clusterc(d)has a single dominator objectd. • A method call from the outside ofc(d)always calls the
dominator objectd.
These characteristics enable us to visualize only dom-inator objects of clusters in a sequence diagram and hide their internal behavior. The hierarchy of a dominance tree
indicates the hierarchy of clusters; it allows developers to interactively visualize and inspect the detail of interesting clusters. Figure 3 visualizes a sequence diagram involving only the root object and its immediate descendant objects in the dominance tree in Figure 2.
4. Case Study
We have implemented our approach as a tool and con-ducted a case study to evaluate our approach. We have ana-lyzed four implementations of an enterprise web application developed by four groups of developers in a training course. Four groups referred to the same specification and design documents but they implement the details of the system in different ways. We have prepared a use-case scenario that executes all features of the system according to the specifi-cation, and executed the scenario on four systems.
To obtain execution traces, we used an implementation of JVMTI, or Amida Profiler [7]. When recording execu-tion traces, we filtered JDK standard classes out because of performance limitation. A call-back from JDK is regarded as an indirect call. In other words, when objecto1 called some JDK object ando2received a call-back, we recorded an indirect method call fromo1too2.
After execution traces are obtained, we applied the tool to each of traces. Using Amida Viewer, we visualized a trace including only objects that are immediately dominated bymain as a sequence diagram. We have compared the resultant diagrams with diagrams directly extracted from traces without our approach.
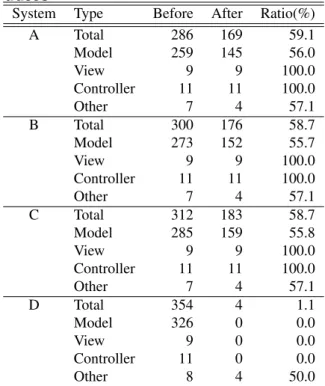
Table 1 and Table 2 shows the number of objects and method calls in each of execution traces before and after applying our approach. Since the target systems are im-plemented in Model-View-Controller architecture, we have categorized objects in traces into four categories: Model, View, Controller and Other. Total row shows the total number of objects in a trace. Model shows the number of objects whose classes represent data model and business logic. View includes only JSP objects. Controller includes Action, Servlet and RequestProcessor objects. Otherincludes other utility objects and static objects. It should be noted that we have regarded a static (class) object as a single object in Table 1, although each static method call is translated to an individual vertex when applying a dominance algorithm. In Table 1, the column Before andAfterrespectively indicate the number of objects in a trace and the number of objects directly dominated by main. In Table 2, the columns indicate the number of method calls shown in sequence diagrams before and after our approach removes local objects. In both tables,Ratio is computed as follows.
Ratio= After
Before×100(%)
Table 1. The number of objects in execution traces
System Type Before After Ratio(%)
A Total 286 169 59.1 Model 259 145 56.0 View 9 9 100.0 Controller 11 11 100.0 Other 7 4 57.1 B Total 300 176 58.7 Model 273 152 55.7 View 9 9 100.0 Controller 11 11 100.0 Other 7 4 57.1 C Total 312 183 58.7 Model 285 159 55.8 View 9 9 100.0 Controller 11 11 100.0 Other 7 4 57.1 D Total 354 4 1.1 Model 326 0 0.0 View 9 0 0.0 Controller 11 0 0.0 Other 8 4 50.0
Table 2. The number of method calls in traces
System Before After Ratio(%)
A 3371 2390 70.9
B 3797 2716 71.5
C 3862 2646 68.5
D 4506 133 3.0
While about 60% of objects are directly dominated by mainin System A, B and C, System D involves only few objects dominated bymain. This is because System D uses a kind of Fac¸ade object representing a system itself. The system object is similar tomainmethod in other systems and immediately dominates about 60% of other objects.
For other three systems, we have investigated objects in-volved in sequence diagrams and local objects filtered out by our approach. Our approach did not removeViewand Controllerobjects such as Action and JSP since these objects interact with one another. These objects are impor-tant to understand the behavior of systems since they im-plement user interface. On the other hand, our approach ex-cluded manyModelobjects from sequence diagrams. The resultant sequence diagrams involve “Data” objects con-taining database records since these objects are short-lived but shared by business logic and user interface. Our ap-proach filtered out data access objects named “DAO” that
construct “Data” objects from database since such data ac-cess objects are locally used by Action objects. Objects for searching database records are also excluded from sequence diagrams since they are only used in a search function.
In the case study, local objects excluded by our approach are the less important implementation details of the target systems, while the resultant diagrams retained important objects such as user interface and business logic. Although we need further case studies on software in different do-mains, our filtering approach is promising to exclude local objects from a trace and provide a compact sequence dia-gram to developers.
5. Conclusion
We have applied dominance algorithms to identify local objects contributing to only internal behavior of their domi-nator objects. Excluding local objects from execution traces simplifies sequence diagrams extracted from the traces. In the case study, we found only 60% objects are directly dom-inated bymainmethod and the other 40% of objects are lo-cal objects. We have confirmed that lolo-cal objects excluded by our approach are the less important implementation de-tails of the target systems. We implemented the algorithm to filter local objects from a sequence diagram in Amida Viewer. The resultant sequence diagrams retain all interac-tions among non-local objects; therefore, the diagrams are suitable for developers to investigate actual behavior of pro-grams.
In future work, we have to conduct further case stud-ies on various software. We would like to evaluate how our approach collaborates with other filtering and visualiza-tion approaches. We are also interested in how architecture and design of software influence the effectiveness of our ap-proach.
Acknowledgements
This research was supported in part by Global COE Pro-gram, Center of Excellence for Founding Ambient Informa-tion Society Infrastructure from MEXT, Japan.
References
[1] L. C. Briand, Y. Labiche, and J. Leduc. Towards the reverse engineering of UML sequence diagrams for distributed java software. IEEE Transactions on Software Engineering, 32(9):642–663, 2006.
[2] K. D. Cooper, T. J. Harvey, and K. Kennedy. A
sim-ple, fast dominance algorithm.http://www.cs.rice.
edu/∼keith/EMBED/dom.pdf, 2001.
[3] B. Cornelissen, D. Holten, A. Zaidman, L. Moonen, J. J. van Wijk, and A. van Deursen. Understanding execution traces
using massive sequence and circular bundle views. In Pro-ceedings of the Int’l Conference on Program Comprehen-sion, pages 49–58, 2007.
[4] J. K. Czyz and B. Jayaraman. Declarative and visual debug-ging in eclipse. InEclipse Technology Exchange, 2007. [5] R. Falke, R. Klein, R. Koschke, and J. Quante. The
dom-inance tree in visualizing software dependencies. In Pro-ceedings of the 3rd International Workshop on Visualizing Software for Understanding and Analysis, page 24, 2005. [6] A. Hamou-Lhadj and T. Lethbridge. Summarizing the
con-tent of large traces to facilitate the understanding of the be-haviour of a software system. InProceedings of the Int’l Conference on Program Comprehension, pages 181–190, 2006.
[7] T. Ishio, Y. Watanabe, and K. Inoue. AMIDA: a sequence diagram extraction toolkit supporting automatic phase de-tection. InCompanion Volume of the Int’l Conference on Software Engineering, pages 969–970, 2008.
[8] T. Lengauer and R. E. Tarjan. A fast algorithm for finding dominators in a flowgraph.ACM Transactions on Program-ming Languages and Systems, 1(1):121–141, 1979. [9] H. Lieberman and C. Hewitt. A real-time garbage collector
based on the lifetimes of objects. Communications of the ACM, 26(6):419–429, 1983.
[10] A. Lienhard, O. Greevy, and O. Nierstrasz. Tracking ob-jects to detect feature dependencies. InProceedings of the Int’l Conference on Program Comprehension, pages 59–68, 2007.
[11] W. D. Pauw, E. Jensen, N. Mitchell, G. Sevitsky, J. M. Vlis-sides, and J. Yang. Visualizing the execution of java pro-grams. InRevised Lectures on Software Visualization, Inter-national Seminar, pages 151–162, 2001.
[12] S. P. Reiss. Dynamic detection and visualization of software phases. InProceedings of the Int’l Workshop on Dynamic Analysis, pages 1–6, 2005.
[13] S. P. Reiss and M. Renieris. Encoding program executions. InProceedings of the Int’l Conference on Software Engi-neering, pages 221–230, 2001.
[14] T. Richner and S. Ducasse. Using dynamic information for the iterative recovery of collaborations and roles. In Pro-ceedings of the Int’l Conference on Software Maintenance, pages 34–43, 2002.
[15] T. Syst¨a, K. Koskimies, and H. M¨uller. Shimba - an envi-ronment for reverse engineering java software systems. Soft-ware Practice and Experience, 31:371–394, 2001.
[16] K. Taniguchi, T. Ishio, T. Kamiya, S. Kusumoto, and K. In-oue. Extracting sequence diagram from execution trace of java program. InProceedings of the Int’l Workshop on Prin-ciples of Software Evolution, pages 148–151, 2005. [17] D. Ungar. Generation scavenging: A non-disruptive high
performance storage reclamation algorithm. InProceedings of Software Engineering Symposium on Practical Software Development Environments, pages 157–167, 1984. [18] Y. Watanabe, T. Ishio, and K. Inoue. Feature-level phase
detection for execution trace using object cache. In Pro-ceedings of the Int’l Workshop on Dynamic Analysis, pages 8–14, 2008.
[19] N. Wilde and R. Huitt. Maintenance support for object-oriented programs. IEEE Transactions on Software Engi-neering, 18(12):1038–1044, 1992.
Using a Sequence Alignment Algorithm to Identify Specific and Common Code
from Execution Traces
Marcelo de A. Maia, Victor Sobreira, Klérisson R. Paixão, Sandra A. de Amo, Ilmério R. Silva
Computer Science Department
Federal University of Uberlândia
Uberlândia, MG, Brazil
{marcmaia,deamo,ilmerio}@facom.ufu.br, {victor.sobreira,klerissonpaixao}@gmail.com
Abstract
Software product lines are an important strategy to im-prove software reuse. However, the migration of a single product to a product line is a challenging task, even when considering only the reengineering task of the source code, not mentioning other management challenges. The reengi-neering challenges are partially due to effort of identifying common code of similar features, even when we know those features in advance. This work proposes the alignment of execution traces in order to discover similar code of similar features, facilitating the reengineering task. We present the architecture of our approach and preliminary results that shows a promising direction.
1 Introduction
Changes are inherent to software systems [4]. Every successful software goes through continuous evolution ei-ther to support new user expectations, hardware changes or operational changes. However, providing software evolu-tion easily, quickly and correctly is still a major challenge for software engineers because applications are increasingly complex. This complexity is consequence of more sophisti-cated non-functional requirements. Most maintenance tasks are originated from new user requests, that is, perfective maintenance tasks [3, 4]. One of the major problems in software maintenance is related to program comprehension. The effort of comprehending of what will be modified is estimated in 40% to 60% of the whole effort of the main-tenance phase[1]. This situation is aggravated when soft-ware documentation is either not updated, unintelligible, or simply does not exist. Another complicating issue is the software size. Reverse engineering techniques are being
de-veloped with relative success, but their scalability to large systems is still a challenge.
This work proposes a reverse engineering technique us-ing a sequence alignment algorithm. Sequence alignment algorithms have been applied in Molecular Biology to com-pare two or more sequences of DNA, RNA or protein in or-der to find out if there exists some similarity between them. For example, if we have two sequences:ATGGATGCCCand
ATGCATCCC, a possible alignment would result in the fol-lowing two sequences, respectively: ATG-GATGCCCand
ATGC-AT-CCC. Note that gaps are introduced in the orig-inal sequences so that ani-thelement of the first sequence can match thei-thelement of the second sequence. The idea of this work is based on aligning similar execution traces in order to find out where the two traces match (common code) and where they mismatch (specific code). The technique is aided by a semi-automated tool to help the identification of specific and common code of similar features. The traces should be captured from similar execution scenarios of the system, otherwise it is not expected to find common code. It is important that the developer knows what are the com-monalities and variabilities between two execution scenar-ios from an observational point of view in order to establish adequate traces for alignment.
2 The Approach
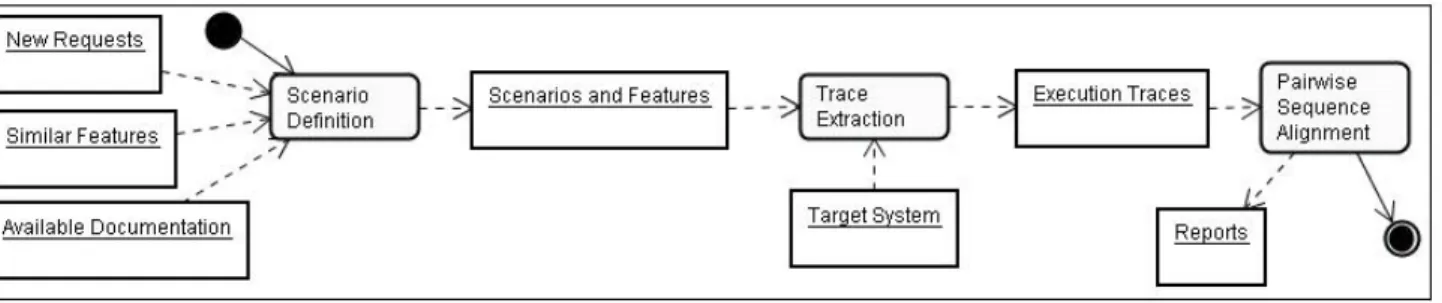
In Figure 1, a general view of our approach is presented using an UML activity diagram.
The first activity is to define suitable scenarios that en-ables extracting relevant information when comparing two executions traces. This is a manual activity, and informa-tion used as input for this activity comprehends new user requests that defines what kind of maintenance will be per-formed, similar features present in the system and the
avail-Figure 1. The proposed approach
able documentation of the system. The result of this activity is the definition of an execution scenario that must be per-formed, and consequently, the input data that enables the desired execution of the target system.
The trace extraction activity is automated. Our trace ex-tractor is implemented in AspectJ. Currently, our target sys-tem must be implemented in Java. During the execution of the target system, the extractor intercepts method calls and writes a text file for each thread launched during the execution. Each line of the file corresponds to a method call whose content is the fully qualified name of the called method.
After the traces are collected, the next step is to perform an automatic pairwise alignment with two selected traces. The expected result of the alignment is the information of what is common to both sequences and what is specific to each sequence.
This information can be used to focus on the source code that is important to desired maintenance task.
3 Related Work
Some ideas of this work were inspired in other works in software maintenance.
Ding and Medvidovic proposes an incremental process for the evolution of object-oriented systems with poor or in-existent documentation. [6]. One phase of the process is the architecture recovery of specific fragments of the system. There are three assumptions for this phase: definition of the desired changes, knowledge of the application properties from the user point of view and the understanding of ba-sic architectural features of the implementation plataform. This work was posteriorly revised with the addition of new heuristics for the phase of identifying components and with new case studies [9]. Our work relates to this, in the sense that the result of alignments helps to focus system under-standing on the desired points of system evolution.
Rajlich and Silva have studied the reuse and the evo-lution of orthogonal architectures, which are code frag-ments organized in layers within the same abstraction level
[11]. They have developed an application domain inde-pendent process aiming at adapting the system architecture to encompass a new requirement set. The authors have concluded that such process have application in small and medium-sized systems, and that the source code modular-ization was not effective for large scale systems. We expect that sequence alignment can be applied to large scale sys-tem in order to help focusing on the most important places to eventually modularize.
Sartipi et al. developed a work that comprehended in re-covering system architecture using patterns defined in the AQL language - Architectural Query Language - and to-gether with data mining techniques. The system is trans-lated from source code to a graph model that is suitable for pattern-matching [13]. In other work[12], a framework that combines static and dynamic information is proposed. We also believe that we will need to combine the dynamic in-formation extracted from sequence alignment and combine it with static information in order to achieve a more robust result.
Vasconcelos et al. [15, 16] presents a set of heuristics for class clustering in object-oriented systems from execution traces, using a similar idea of combining dynamic and static information.
Impact analysis techniques are responsible to identify the parts of the system that will be affected by a change. A well-known technique is program slicing. Binkley e Gallagher have presented a survey about this technique[5]. Our work can be used to provide the slicing criteria for understanding the impact of a software change.
Clustering is a data mining technique used for classi-fying related source code entities using similarity metrics. Wiggerts [17], Anquetil [2] and Tzerpos [14] shows dif-ferent aspects on the clustering algorithms for source code. Feature location is a common task in software evolution ac-tivities. Marcus et al. has presented the application of an in-formation retrieval method -Latent Semantic Indexing (LSI)
that is used to map concepts written in natural language to relevant fragments of source code [8]. Our work also aims at locating source code fragments that are relevant in a
soft-ware evolution or softsoft-ware restructuring context based on external point of view of behavior.
In the Bioinformatics field, comparing sequences has be-came a major activity. The identification of similar regions in DNA, RNA or protein sequences can help mapping se-quences to functional, structural and evolutionary charac-teristics. Several algorithms are presented in [7]. However, it is still a challenge to define and adapt sequence alignment algorithms for the software maintenance field. Surprisingly, at the best of our knowledge, we still could not find the use of alignment algorithms to detect similarities and common-alities of execution traces.
4 Sequence Alignment
Sequence alignment is a well-studied problem. Needle-man and Wunsch have already proposed an algorithm for analyzing protein sequence in early seventies [10]. Several algorithms have been proposed since then. Indeed there are some issues that must be considered when adapting these algorithms for maintenance purposes.
4.1 Characteristics of Execution Traces
Our execution traces normally can present some patterns that can provide us with some information. For example, consider the sequences“XaaaaY”and“XaaaY”. We can suspect that these sequence may be generated from the same code, and they are different just because the method “a”
was called inside a loop that executed four times in one trace and three times in the other. Another example, consider the sequences“XaaaaY”and“XaabaY”. In this case, we can suspect that some condition enabled the execution of the method“b”, possibly inside a conditional command.
4.2 Global Alignment vs Local Alignment
Global alignments attempts to align every element in the sequences. These strategy is most useful when the se-quences are similar and of roughly equal size. A general global alignment technique is the Needleman-Wunsch algo-rithm that is based on dynamic programming. Local align-ments are more useful when we are trying to find a smaller sequence inside a larger one. The Smith-Waterman algo-rithm is a general local alignment algoalgo-rithm and is also based on dynamic programming. There are also hybrid methods that attempt to find the best possible alignment that includes the start and end of one and the other sequence.
In this paper, we have chosen to study the alignment of almost similar sequences. Our goal was to choose similar features and to find out what is common and what is differ-ent between them. In such a situation, a global alignmdiffer-ent strategy seems a reasonable alternative.
4.3 Pairwise Alignment vs Multiple Alignment
Pairwise alignment is used to find local or global align-ments of two sequences. If it is necessary to compare sev-eral sequences, the alignment can only occurs with two se-quences at a time, and the user should proceed with an in-tegration step with another technique. Multiple sequence alignment is a generalization of pairwise alignment, in the sense that the alignment algorithm can take as input several sequences at a time. However, general multiple alignment algorithms tend to lead to NP-complete solutions, and thus are not very practical, unless you provide some heuristics or use a very small input.
In this paper, we have chosen to study the pairwise align-ment because execution traces are normally large.
4.4 Identity and Similarity
In Bioinformatics, identity and similarity are related but different concepts. The identity is a relation of equality in which a nucleotide or aminoacid of one side must be equal to its complement to produce a match. This relation is too restrictive in Biology, so the alignment algorithm may con-sider to match two different elements, if these elements have some level of similarity.
In principle, considering that classes may have a reason-able cohesion, we could consider methods in the same class or in the same package to have some level of similarity, and thus apply the same principles of biology. However, in this work we have chosen to consider only the identity relation-ship as a prerequisite for matching two method calls.
4.5 Gap Penalty
Because in Bioinformatics is reasonable to accept the alignment match between two different elements, a ques-tion may arise when deciding if a match based on similarity is better or not than a gap that is inserted in one of the se-quences.
In this work, we have decided not to penalize the intro-duction of gaps in either of the two sequences for two rea-sons. The first is that since we work only with identity, it seems incoeherent to accept an alignment match with two different elements instead of introducing the gap. The sec-ond reason is that the misalignment gives us also an impor-tant information: it may represent specific method calls of a sequence and thus contribute to identify specific code.
5 Application and Current Results
In this section, we present an application of sequence alignment to report specific and common code between two
Traces Length - Prefix Length - Specific to Rectangle Length - Suffix Rectangle 885 matches and gaps 396 specific to Rectangle 18 matches and gaps
Circle 885 matches and gaps 396 gaps only 18 matches and gaps
Figure 2. Length and Characteristic of Aligned Sequences
features in a small graphical editor shown in Figure 3. The total lines of code of the editor is 387, the number of classes is 9, and the total number of methods is 58.
Figure 3. The target system
We have chosen two similar features to execute the sys-tem: drawing a rectangle and drawing a circle. The exe-cution traces were collected and two threads were launched for each execution. Each pair of corresponding threads were aligned with a Needleman-Wunsch algorithm, considering only identities and zero gap penalty. Below we present the results of the alignments.
5.1 Results
The first thread was responsible for drawing the main frame and there was only 14 method calls perfectly aligned between each other.
The second thread was more interesting. Although the system is small and the execution scenarios are fairly sim-ple, the thread for drawing a rectangle had 1040 method calls and the thread for drawing a circle had 644 method calls, and thus manual alignment seems unfairly hard. Af-ter the gap insertions each sequence had the gaps inserted and grown to 1299 elements.
In Figure 2, we show the tree main subparts of the traces and their correspondence. The interesting alignment is in the first and third part, summing 903 elements. After ana-lyzing manually the traces, we could find out that the 396 el-ements in the second part, corresponds to gaps in the thread of drawing circle, because the size of the drawn rectangle was greater than the size of the circle and thus demanded more screen updates. In Figure 4, we summarize the quan-titative details of the alignment.
After the alignment, we computed the set of common methods between the two features, the set of methods spe-cific to the feature of drawing a rectangle and the set of
Before Alignment
Length of Rectangle Trace 1040
Length of Circle Trace 644
Difference Rect-Circle 396
After Alignment
Length of Rectangle Trace 1299
Length of Circle Trace 1299
#Matches 385
#Gaps in Rectangle Trace 259
#Gaps in Circle Trace 655
#Real Gaps in Circle Trace 259 Length of Interesting Alignment 903
%Matches 0.4263
%Interesting Gaps in Rectangle 0.2868 %Interesting Gaps in Circle 0.2868 Figure 4. Quantitative results
methods specific to the feature of drawing a circle. The results are shown below, respectively. False positives have arised when finding methods specific to draw a rectangle. The reason was that it was not possible to align those 396 method calls with a counterpart in the draw circle feature, as already shown in Figure 2. Nonetheless, the other results seem promising because no false negative has arised and all called methods were present in at least one of the above three sets. // Common methods graphicaleditor.MainFrame$1.paint graphicaleditor.MainFrame.access$0 graphicaleditor.ShapeSet.draw graphicaleditor.MainFrame.access$1 graphicaleditor.MainFrame.processWindowEvent graphicaleditor.MainFrame$4.mousePressed graphicaleditor.MainFrame.drawPanel_mousePressed graphicaleditor.MainFrame.createShape graphicaleditor.Point2D.<init> graphicaleditor.MainFrame$5.mouseDragged graphicaleditor.MainFrame.drawPanel_mouseDragged graphicaleditor.Point2D.getX graphicaleditor.Point2D.getY graphicaleditor.MainFrame$4.mouseReleased graphicaleditor.ShapeSet.add graphicaleditor.MainFrame.drawPanel_mouseReleased graphicaleditor.MainFrame.jMenuFileExit_actionPerformed // Methods specific to draw rectangle
graphicaleditor.MainFrame$1.paint graphicaleditor.MainFrame.access$0 graphicaleditor.ShapeSet.draw graphicaleditor.MainFrame.access$1 graphicaleditor.Rectangle.<init> graphicaleditor.Rectangle.setAnchor graphicaleditor.MainFrame$5.mouseDragged graphicaleditor.MainFrame.drawPanel_mouseDragged graphicaleditor.Rectangle.getAnchorX graphicaleditor.Point2D.getX graphicaleditor.Point2D.getY graphicaleditor.Rectangle.getAnchorY graphicaleditor.Rectangle.draw graphicaleditor.Rectangle.setDimension graphicaleditor.Rectangle.getAnchor
// Methods specific to draw circle graphicaleditor.Circle.<init> graphicaleditor.Circle.getAnchorX graphicaleditor.Circle.setAnchor graphicaleditor.Circle.setDimension graphicaleditor.Circle.getAnchorY graphicaleditor.Circle.getAnchor graphicaleditor.Circle.draw
6 Final Remarks
In this work, we have shown an approach to identify commonalities and variabilities in execution traces. The possibilities of usage of these information are manifold. We can help the introduction new features in the target software based on similar characteristics already present providing information of specific methods that the feature must im-plement. We can help extracting common components from source code based on information provied by commonali-ties between execution traces.
There are many questions that still persist, for instance, how the approach will scale up for larger systems, how the extracted information can be more systematically used by developers, how would be the results when working with different versions of the system, how much the trace com-pression would enhance the approach, and how different alignment methods behave in different situations.
Acknowledgments. We would like to thank CNPq and CAPES for partially funding this research.
References
[1] A. Abran, P. Bourque, R. Dupuis, and L. Tripp. Guide to the software engineering body of knowledge (iron-man version). TR, IEEE Computer Society, 2004. [2] N. Anquetil, C. Fourrier, and T. Lethbridge.
Experi-ments with clustering as a software remodularization method. InWCRE ’99: Proceedings of the Sixth Work-ing Conference on Reverse EngineerWork-ing, page 235, Washington, DC, 1999.
[3] K .Bennett. Software evolution: past, present and future. Information and Software Technology, Vol. 38(11):673–680, November 1996.
[4] K .Bennett and V .Rajlich. Software maintenance and evolution: a roadmap. InConference on The Future of Software Engineering, pages 73–87, New York, NY, USA, 2000. ACM Press.
[5] D. Binkley and K .Gallagher. Program slicing. Ad-vences in Computer, 1(43), July 1996.
[6] L .Ding and N. Medvidovic. Focus: a light-weight, in-cremental approach to software architecture recovery
and evolution. InSoftware Architecture, 2001. Pro-ceedings. Working IEEE/IFIP Conference on, pages 191–200, 28-31 Aug. 2001.
[7] D. Gusfield. Algorithms on Strings, Trees, and Se-quences: Computer Science and Computational Biol-ogy. Cambridge University Press, January 1997. [8] A .Marcus, A .Sergeyev, V .Rajlich, and J .Maletic.
An information retrieval approach to concept location in source code. InWCRE ’04: Proc. of the 11th Work-ing Conference on Reverse EngineerWork-ing (WCRE’04), pages 214–223, Washington, DC, USA, 2004. IEEE Computer Society.
[9] N .Medvidovic and V .Jakobac. Using software evo-lution to focus architectural recovery.Automated Soft-ware Engineering, 13(2):225–256, 2006.
[10] S. Needleman and C. Wunsch. A general method ap-plicable to the search for similarities in the amino acid sequence of two proteins. Journal of Molecular Biol-ogy, 48(3), 1970.
[11] V. Rajlich and J. Silva. Evolution and reuse of or-thogonal architecture. IEEE Transaction on Software Engineering, 22(2):153–157, 1996.
[12] K. Sartipi, N. Dezhkam, and H. Safyallah. An orches-trated multi-view software architecture reconstruction environment. InProc. of 13th Work. Conf. on Reverse Engineering, pages 61–70, Oct. 2006.
[13] K. Sartipi, K. Kontogiannis, and F. Mavaddat. Archi-tectural design recovery using data mining techniques. InProc. of 4th European Conf. on Soft. Maintenance and Reengineering, pages 129–139, March 2000. [14] V .Tzerpos and R. Holt. Software botryology:
Au-tomatic clustering of software systems. In Interna-tional Workshop on Large-Scale Software Composi-tion, pages 811–818, 1998.
[15] A. Vasconcelos, R. Cêpeda, and C. Werner. An ap-proach to program comprehension through reverse en-gineering of complementary software views. In1st Intl. Workshop on Prog. Comprehension through Dy-namic Analysis (PCODA), pages 58–62, 2005. [16] A. Vasconcelos and C. Werner. Software
architec-ture recovery based on dynamic analysis. InSimpósio Brasileiro de Engenharia de Software, 2004.
[17] T. Wiggerts. Using clustering algorithms in legacy systems remodularization. InProc. of the 4th Working Conf. on Reverse Engineering (WCRE ’97), page 33, Washington, DC, 1997. IEEE Computer Society.
Behavioral Design Pattern Detection through Dynamic Analysis
Francesca Arcelli, Fabrizio Perin, Claudia Raibulet, Stefano Ravani
DISCo – Dipartimento di Informatica Sistemistica e Comunicazione,
Università degli Studi di Milano-Bicocca
{arcelli, raibulet}@disco.unimib.it, {fabrizio.perin, stefano.ravani}@gmail.com
Abstract
The recognition of design patterns in an existing system provides additional information related to the rationale behind the design of the system which is very important for the system comprehension and re-documentation. Several approaches and tools have been proposed for design patterns detection, some approaches are based only on static analysis of the code, other use both static and dynamic analysis.
In this paper we present our approach to the recognition of design patterns based on dynamic analysis of Java software. The idea behind our solution is to identify a set of rules capturing information necessary to identify a design pattern instance. Rules are characterized by weights indicating their importance in the detection of a specific design pattern. The core behavior of each design pattern may be described through a subset of these rules forming a macrorule, which defines the main traits of a pattern. JADEPT (JAva DEsign Pattern deTector) is our prototype for design pattern identification based on this idea. It captures static and dynamic aspects through a dynamic analysis of software by exploiting JPDA (Java Platform Debugger Architecture).
1. Introduction
The information related to the presence of design patterns [3] in a system is useful not only to better comprehend the system, but also to discover the rationale of its design. This has a significant implication for further improvement or adaptive changes, with various advantages for the overall maintenance process.
In the context of design patterns detection, it is possible to use different approaches both for the identification logic (e.g., searching for subcomponents
design pattern at once) and for the information extraction method (e.g., static, dynamic, or both).
Problems raised by the identification of design patterns are related not only to the search aspects, but also to the design and development choices. There are at least three important decisions that should be taken when developing a design pattern detection tool. These decisions may influence significantly the final results. The first issue regards the evaluation of how to extract the interesting data from the examined software, including the type of the analysis to be performed. The second issue considers the data structure in which to store the gathered information; one important risk is related to the loss of knowledge at the data or the semantic level: this would generate inferences about something that is no more the analyzed software, but an incorrect abstraction of it. The third one highlights the importance to find a way to process the extracted data and to identify design pattern instances. Independently of the adopted data structure for the extracted information (e.g., a text file, XML, database), the following three aspects should be considered: memory occupation, processing rate and, most important, the effective recognition process of design patterns with a minimum rate of false positives and false negatives. While the first two issues could be solved through an upgrade of the machine on which elaboration is performed, the last is strictly related to the efficiency of the recognition logic applied for design pattern detection due to the significant number of possible implementation variants.
In this paper, we present a new approach based on the analysis of dynamic information caught during the execution of the software under analysis in order to detect behavioral design patterns. We consider behavioral design patterns because they are particularly appropriate for dynamic analysis. In fact, their traces may be better revealed at runtime by analyzing all the dynamic aspects including: object instantiation,
design pattern and its behavior. Thus, it is possible to assert that a piece of software represents not only the structure of a design pattern, but its behavior, too. Through dynamic analysis it is possible to observe objects, their creation and execution during their entire life-cycle and overcome part of the limitations of the static analysis which may be determinant in pattern recognition.
JADEPT (JAva Design Pattern deTector) is the software prototype we are developing for design pattern detection which collects structural and behavioral information through dynamic analysis of Java software by exploiting JPDA (Java Platform Debugger Architecture). We validated our approach on canonical design pattern implementations and on the JADEPT itself.
There are various approaches that aim to detect design patterns based on a static analysis of source code such as: FUJABA RE [6], SPQR [12], PINOT [11], PTIDEJ [4] or MAISA [14]. The design pattern detection mechanisms search for information defining an entire pattern or sub-elements of patterns which can be combined to build patterns [1] or evaluate the similarity of the code structure with higher-level models as UML diagrams [2] or graph representations [13]. Other approaches exploit both static and dynamic analysis as in [5, 9] or only dynamic analysis as in [10, 15]. The approach we use in JADEPT is different from the other solutions, but a comparison with the other tools is not possible, since a real benchmark is not yet available.
The paper is organized through the following sections. Section 2 presents the identification rules and an example of their application on a behavioral design pattern. Section 3 describes the overall architecture and the functionalities of the JADEPT prototype. Section 4 introduces several aspects concerning the validation of JADEPT. Conclusions and further work are dealt within Section 5.
2. JADEPT
To detect design pattern in JADEPT we defined a set of rules describing the properties of each design pattern. Properties may be either structural or behavioral and may describe relationships between classes or families of classes. We defined a family of classes as a group of classes implementing the same interface or extending a common class. Weights have been associated to rules indicating how much a rule is able to describe a specific property of a given design pattern. The rules have been defined independently of
Nevertheless part of the extracted information can be obtained by a static analysis of the software, JADEPT extracts all the information during the execution of the software adopting an approach based exclusively on dynamic analysis. The extracted information is stored in a database. The advantages of having information stored in database are: (1) the possibility to perform statistics and (2) the possibility to memorize information about various executions of the same software. A rule may be implemented by one or more queries to the database. The database has been designed to model concepts of a generic object-oriented language. The presence of a design pattern is verified through the validation of its associated rules. 2.1. Rules for design pattern detection
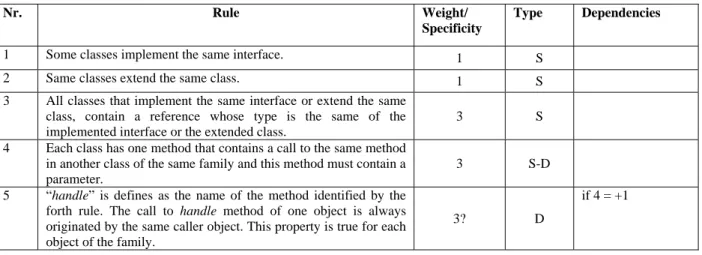
We present how rules, weights and macrorules have been defined for the detection of design patterns, and we introduce them through an example for the Chain of Responsibility pattern (see Table 1). First, the identification rules are written using natural language (see Table 1 – Second column). This approach avoids introducing constraints regarding the implementation of rules. In JADEPT, rules are translated into queries, but they can be used also outside the context of our tool and hence, represented through a different paradigm (e.g., graphs).
Then weights have been added to the rules to determine the probability of the pattern presence in the examined code, weights denote the importance of a rule in the detection process of a pattern (see Table 1 – Third column). Weights’ range is 1 to 5. A low weight value denotes a rule that describes a generic characteristic of a pattern like the existence of a reference or a method with a specific signature. A high weight value denotes a rule that describes a specific characteristic of a pattern like a particular method call chain that links two class families. Even if each behavioral design pattern has its own particular properties, an absolute scale for the weights value has been defined based on our design pattern detection experience which can be obviously further improved or modified. Rules whose weight value is equal to 1 or 2 describe structural and generic aspects of code (e.g., abstract class inheritance, interface implementation or the presence of particular class fields). Rules whose weight value is equal to 3 or higher, describe a specific static or dynamic property of a pattern. For example, the fifth rule of Chain of Responsibility in Table 1, specifics that each call to the handle() method has always the same caller-callee objects pair. This is the
The next step regards the definition of the relationship between rules [8]. There are two types of relationships. The first one is logical: if the check of a rule does not have a positive value, it does not make sense to proof the rules related to it. For example, the fifth rule in Table 1 cannot be proved if the fourth rule has not been proved first. The second one is informative: if a rule depends on another one, and the latter is verified by the software detector, its weight increases. The second type of relationship determines those rules which are stronger for the identification of design patterns.
Finally we have introduced macrorules. A macrorule is a set of rules which describes a specific behavior of a pattern which they refer to (see an example in Table 2). If the rules that compose a macrorule are verified, the core behavior of a pattern has been detected so the final probability value increases. The value added to the probability is different for each pattern. This is because the number of rules which belongs to a macrorule varies from one macrorule to another.
A question mark after a weight value indicates a variable weight. For example, the fifth rule has a variable weight because of its relation with rule number four. If the fourth is verified then the weight of the fifth rule is increased by one, hence associating a higher probability to the pattern instance recognition.
The fourth column indicates the type of information needed to verify a rule. If a rule describes a static property, which can be verified through an analysis of static information, then the value in this column is S (indicating static). If a rule describes a dynamic property, which can be verified through an analysis of dynamic information, then the value in this column is D (indicating dynamic).
Table 1. Detection rules for the Chain of Responsibility design pattern
In the case we have to verify a property by performing analysis of static and dynamic information, then the value specified is S-D (indicating static and dynamic). However, in JADEPT both static and dynamic information are extracted through a dynamic analysis of the software under inspection.
A relationship of dependency among two or more rules is indicated in the fifth column. A logical dependency is between rule four and five. Rule five cannot be proved if rule four is not previously verified. The informative dependency we have defined for this pattern involves the fourth and the fifth rules. Rule 5 can increment by one its weight if rule 4 is verified. Table 2. The Macrorule for the Chain of Responsibility Pattern
Macrorule Rules Sequential redirection 4, 5
3. JADEPT architecture
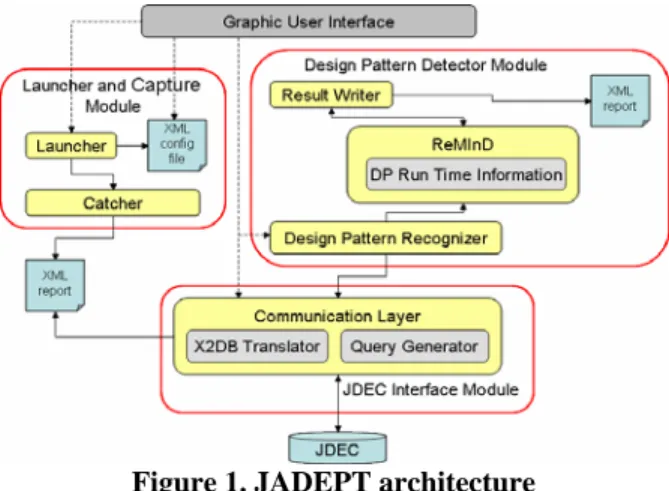
JADEPT is a Java application composed of four main modules [7]: Graphic User Interface (GUI), Launcher and Capture Module (LCM), Design Pattern Detector Module (DPDM) and JDEC Interface Module (see Figure 1).
3.1. Graphic User Interface
JADEPT's GUI allows users: (1) to set up a JADEPT XML configuration file, (2) to launch the software to be monitored, (3) to start the analysis on the stored information and (4) to create the JDEC database.
Nr. Rule Weight/
Specificity
Type Dependencies
1 Some classes implement the same interface. 1 S
2 Same classes extend the same class. 1 S
3 All classes that implement the same interface or extend the same class, contain a reference whose type is the same of the implemented interface or the extended class.
3 S 4 Each class has one method that contains a call to the same method
in another class of the same family and this method must contain a parameter.
3 S-D 5 “handle” is defines as the name of the method identified by the
forth rule. The call to handle method of one object is always
Figure 1. JADEPT architecture
The set up of the configuration file is obviously the first operation to be performed to start a new work session and it is also necessary to create a JDEC database instance to store the extracted information if this operation has never been performed before. After these operations, JADEPT is able to run the user application and to launch the design pattern detector on the collected information.
JADEPT GUI has been designed using the Command pattern [3]. In this way both the management of the operations of all graphical components and the structure of the entire GUI becomes simpler.
3.2. Capture and Launcher Modules
The Capture and Launcher Module is composed of two following modules:
- the LauncherModule which starts the execution of the software under analysis, as well as the execution of the Catcher Module. The Launcher uses the XML configuration file to read all the information needed to run the user application. When the Launcher is invoked from the GUI a new Java Virtual Machine (JVM) is created and configured to execute the user application in the debug mode. Finally, the Catcher is invoked.
- the Catcher Module uses JPDA to capture events occurred in the JVM created by the Launcher. Essentially, events regard classes and interfaces loading, method calls, field accesses and modifications. Through these events JADEPT extracts various types of information exploited in the detection process (e.g., the loaded classes provide information about their field names and types or about their methods). Using JPDA the extraction of information is simplified but the monitored software pays in terms of performance. This performance reduction is caused by the JVM
At the end of user's software execution the Catcher Module writes the XML Report File containing all the collected information and invokes the Communication Layer insertion method. Thus, the XML Report File is inserted in the JDEC database. The XML Report File will not be deleted at the end of the insertion, in this way it is possible to keep traces of the software executions independently of the database.
3.3. JDEC and its Interface Module
To store the extracted information we use the JDEC database. In this way, information is available to the Design Pattern Detector Module (DPDM). The JDEC structure models both the object oriented code structure and its behavior (e.g., the class fields and methods, the method calls and its containing operations). The JDEC structure can be divided in two main parts: the first one is composed of those relations which contain static information (classes, interfaces, fields, methods and their arguments); the second one contains dynamic information as method calls, accessed fields or modified and instantiated objects. For example, this type of information allows the recognition of different design patterns having very similar structures, but different behaviors such as the State and Strategy design patterns.
4. Validation
JADEPT has been validated using different implementation samples of design patterns more or less closer to their definitions given in [3]. The results for the Chain of Responsibility design pattern are shown in Table 3.
The first column of the table contains the identification name for the implementations considered. The remaining columns show the results provided by the Chain of Responsibility, Observer and Visitor detectors. The last two detectors have been used to verify if they provide false negatives. The `-' symbol means that JADEPT has not detected any instance for a given design pattern. The `X' symbol indicates that the considered sample does not provide any implementation of a specific pattern.
JADEPT recognizes the Chain of Responsibility pattern in three implementations with reliable values. The Chain implementation in fluffycat is detected as a false negative because JADEPT is not able to find a good handle() candidate in this pattern instance. This argument indicates the request that should be managed by one of the classes which implements the interface.
interface. The successor element in the chain is assigned to this field during execution.
Table 3. Chain of Responsibility implementation analyzed by three design pattern detectors
CoR CoR Detector Observer Detector Visitor Detector composite X X x composite3 X X X cooper 100% 10% 17% earthlink 76% - - earthlink2 X X X fluffycat 7% - - kuchana 69% - - sun X X X vis1 X X X visitorcontact X X X
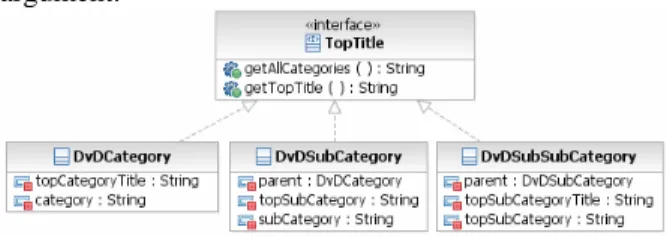
Figure 2 shows the class diagram related to the implementation of the Chain of Responsibility in the fluffycat example. According to the GoF’s definition, this pattern should define a common interface (e.g., called Chain) which is implemented further by two or more classes. The interface defines a method (e.g., called sendToChain(String)) which accepts only one argument.
Figure 2. The Chain of Responsibility pattern in the fluffycat implementation example
The fluffycat implementation is not closed to the GOF's definition: it defines a common interface called TopTitle, but this interface declares methods which accept no arguments. This aspect does not comply with GoF definition and it is reflected in the low values associated to the fluffycal implementation in Table 3.
Table 4 shows the results of JADEPT that analyzes itself. JADEPT is composed of 151 classes. Analysis reveals the presence of Chain of Responsibility and Observer, which are actually implemented in the code. In JADEPT there are no Visitor instances, and this analysis was performed only to test if any false positives are revealed.
Table 4. JADEPT analyzed by JADEPT
System
To summarize, there are two main reasons why JADEPT cannot perform analysis on some implementations. The first is related to the quality of implementations themselves because they are very different from the UML structure of patterns defined by GoF. For example, classes do not implement the same interface or extend the same class. We mean that such implementations cannot be retained as valid instances of design patterns. Common interfaces and classes are used to easily extend software and their use is a principle of good programming as much as other design pattern features.
The second problem concerns the information partitioning technique of JADEPT. Our tool can work on families retrieved from the information collected in JDEC. Before starting the analysis, JADEPT identifies all the possible families and assigns to each family a specific role, according to the design pattern it is looking for. If the analyzed system is unstructured, meaning that common interfaces or classes are absent, JADEPT cannot build correctly the families and perform further analysis.
5. Conclusions and future work
In this paper we have presented our approach to detect design patterns in Java applications through dynamic analysis to extract all the information needed in the detection process. The defined rules focus on the behavior of the patterns and not on their static aspects. Rules capturing static properties have been introduced because they express pre-conditions for the dynamic ones. Further we have defined logical and informative dependencies among rules, established the importance of rules in the detection process through scores, and identified a group of rules characterizing the particular behavior of each pattern through macrorules.
We have validated our idea through the implementation of the JADEPT prototype. JADEPT has been developed for Java software, while the rules and the database are language-independent. Thus, it is possible to apply and reuse these concepts in other object-oriented languages. Modularity is one of the main characteristic of the JADEPT architectural model. It may use alternative ways to extract information or to perform analysis. It is possible to exclude the database and to use another approach to detect design patterns due to existence of the XML Report file. Moreover, the database model can be used in another design pattern detector or a software architecture reconstruction tool.
The decision to use a database to store the extracted information is due to two main reasons. The first is