The Earned Income
Tax Credit and the
Volunteer Income Tax
Assistance Program
HOW ELECTED OFFICIALS CAN
GET INVOLVED IN OUTREACH
THE EARNED INCOME TAX CREDIT AND THE
VOLUNTEER INCOME TAX ASSISTANCE
PROGRAM: HOW ELECTED OFFICIALS CAN GET
INVOLVED IN OUTREACH
INTRODUCTION. . . 3
CHAPTER 1: EITC BACKGROUND AND DOCUMENTS . . . 5
About the Federal EITC . . . 6
About State EITCs . . . 10
About the Volunteer Income Tax Assistance Program . . . 13
EITC Q&A . . . 18
CHAPTER 2: IDEAS FOR ELECTED OFFICIALS . . . 21
Ideas for Elected Officials. . . 22
Sample Newsletter Article and Website Ideas. . . 24
Template Op-Ed . . . 26
Template Media Advisory for Elected Official’s Site Visit. . . 28
Template Press Release for Elected Official’s Site Visit . . . 29
Talking Points . . . 30
CHAPTER 3: HOW OTHERS ARE GETTING INVOLVED IN EITC OUTREACH . . . 33
How Elected Officials are Getting Involved . . . 34
Media Coverage. . . 62
CHAPTER 4: EITC STATISTICS . . . 89
EITC Receipt by State. . . 90
EITC Receipt by Congressional District . . . 92
Community Volunteer Income Tax Assistance Results by State . . . 112
CHAPTER 5: EITC RESOURCES AND CONTACTS . . . 115
ACKNOWLEDGMENTS. . . 119
To find a VITA site near you, call 1-800-829-1040 or visit the National Community Tax Coalition’s website
at http://www.tax-coalition.org/programs.cfm
Dear Elected Official,
Thank you for taking the time to explore how you can work with your constituents to help
them build economic security for their families and in their community. The federal Earned
Income Tax Credit (EITC), which is also available as a state tax credit in 24 states, helps low
and middle income working families keep more of the money they earn so they can afford needed
food and other necessities. Unfortunately, many eligible families aren’t aware of the EITC and
aren’t receiving the credit. As an elected official, you can help raise awareness of the program
and connect with your constituents – a win-win situation.
The National Community Tax Coalition (NCTC), a nationwide network of community tax
preparation programs and The Hatcher Group, a public affairs and communications firm that
connects nonprofits and foundations to policymakers and the media, have come together with
the generous support of the Kellogg Foundation to raise awareness of the EITC, the importance
of Volunteer Income Tax Assistance (VITA) sites, and the need to build support for EITC
benefit expansions and program funding increases.
One of the most effective ways to achieve these goals is for local, state, and federal elected
officials to help educate their constituents about the availability of the EITC, free tax assistance
sites, and to work in support of the program. You have a valuable “bully pulpit” that allows you
to reach more people in your community and educate them about building economic security. In
this troubling economy filled with news of job layoffs, rising gas and food prices, and home
foreclosures, it’s more important than ever that families in need know about the programs that
exist to help.
Many members of Congress, governors and state legislators are already conducting EITC
outreach, as you’ll see in the Examples of Outreach Chapter. We’re proud of the EITC’s long
history of bipartisan support. We encourage you to take a look at what others are doing and see
how you can get involved. While an average of 75 percent of eligible people receive the EITC,
there are many families in your state that are missing out on benefits that could help them climb
the economic ladder.
We’ve put together this toolkit, and an accompanying version specifically for EITC advocates, to
help make your job easier. Included in the guide, you’ll find new and unique EITC outreach ideas
for working with your constituents, and template materials such as press releases, newsletter
articles and opinion-editorials. We’ve also packed it full of EITC data and resource materials so
you have all the facts at your fingertips on how important the EITC is to America’s families and
why it should be supported and expanded.
Thank you for your interest in this guide and support for this valuable program. If you have any
questions or would like any assistance in conducting a site visit to a VITA site or being
connected with EITC advocates in your state, please contact:
Amy Battjer, Senior Associate, The Hatcher Group, amy@thehatchergroup.com, 301-656-0348
Laura Hayes, Senior Associate, The Hatcher Group, laura@thehatchergroup.com, 301-656-0348
Lucy Mullany, NCTC Field Organizer, lmullany@economicprogress.org, 312-252-0280 x. 270
An electronic version of this toolkit can be found at
http://www.thehatchergroup.com/EITCoutreach.html
Sincerely,
David Marzahl
Ed Hatcher
Executive Director
President
Chapter 1
EITC
BACKGROUND
AND
DOCUMENTS
N
About the Federal EITC
N
About State EITCs
N
About the Volunteer Income
Tax Assistance Program
N
EITC Q&A
ABOUT THE
FEDERAL EARNED INCOME TAX CREDIT
The Earned Income Tax Credit (EITC) is a federal tax credit for low-income working
individuals and families. It is intended to reduce the tax burden on low-income workers,
supplement their wages, and help families make ends meet. Even workers whose income is too
small to pay taxes can receive a refund though the EITC. In tax year 2006, the EITC provided
$43.7 billion in reduced or eliminated tax liability and cash refunds to more than 22 million
low-income families.
The EITC is one of the most successful federal anti-poverty programs ever developed. The
impact of the EITC on a working family’s income can be considerable. For example, in 2009, a
single parent raising two or more children and earning between $12,050 and $18,750 is eligible
for the maximum EITC of $4,824—a full 25 to 40 percent increase in the family’s income.
Taxpayers with one child can claim a maximum EITC of $2,917. Claiming the Child Tax Credit
in addition can provide up to $1,000 per child to eligible families.
More than four million people – roughly half of them children – escape poverty each year as a
result of the EITC. A study by The Brookings Institution found the EITC reduces poverty among
young children by nearly one-fourth.
2The EITC significantly increases the number of single parents who join the workforce. One
study found the proportion of single mothers who worked increased dramatically between 1984
and 1996 due to legislative increases in federal EITC benefits.
31
EI
TC
BA
C
KG
RO
UN
D
A
N
D
D
O
C
UM
EN
TS
6
Who is eligible?
Working families with children
that have annual incomes
below approximately $34,000
to $41,000 (depending on
marital status and the number
of children in the family) are
eligible for the EITC. Also,
low-income workers without
children who have incomes
below approximately $13,000
($16,000 for a married couple)
can receive a very small EITC.
11Eligibility description and chart provided by Center on Budget and Policy Priorities, “Policy Basics: The Earned Income Tax Credit” (http://www.cbpp.org/cms/index.cfm?fa=view&id=2505)
2 Sawhill, I. & Thomas, A. (2001). A hand up for the bottom third: Toward a new agenda for low-income working families. Washington, DC: The Brookings Institution.
3 Meyer, B. D. & Rosenbaum, D. T. (2001). Welfare, the Earned Income Tax Credit, and the labor supply of single mothers. Quarterly Journal of Economics, 116(3), pp. 1063–1114.
Interviews with EITC recipients find that they use their refunds to pay off debt, invest in
educa-tion, and secure decent housing, thus enhancing economic well-being and promoting
commu-nity revitalization in their neighborhoods.
A
MERICAN
R
ECOVERY AND
R
EINVESTMENT
A
CT
In the 2009 American Recovery and Reinvestment Act (ARRA), the Earned Income Tax Credit
was temporarily expanded for two specific groups: families with three or more children and
married couples. Effective for the 2010 and 2011 filing seasons, the EITC will support these
tax-payers by:
N Creating a new “third tier” of the EITC for families with three or more children. In this
tier, the credit would phase in at 45 percent of income (up from 40 percent under current
law), effectively increasing the maximum credit for these families by almost $600.
N Increasing marriage penalty relief by raising the income threshold at which the EITC
be-gins to phase out for married couples to $5,000 above the amount for unmarried filers (an
increase of $2,000).
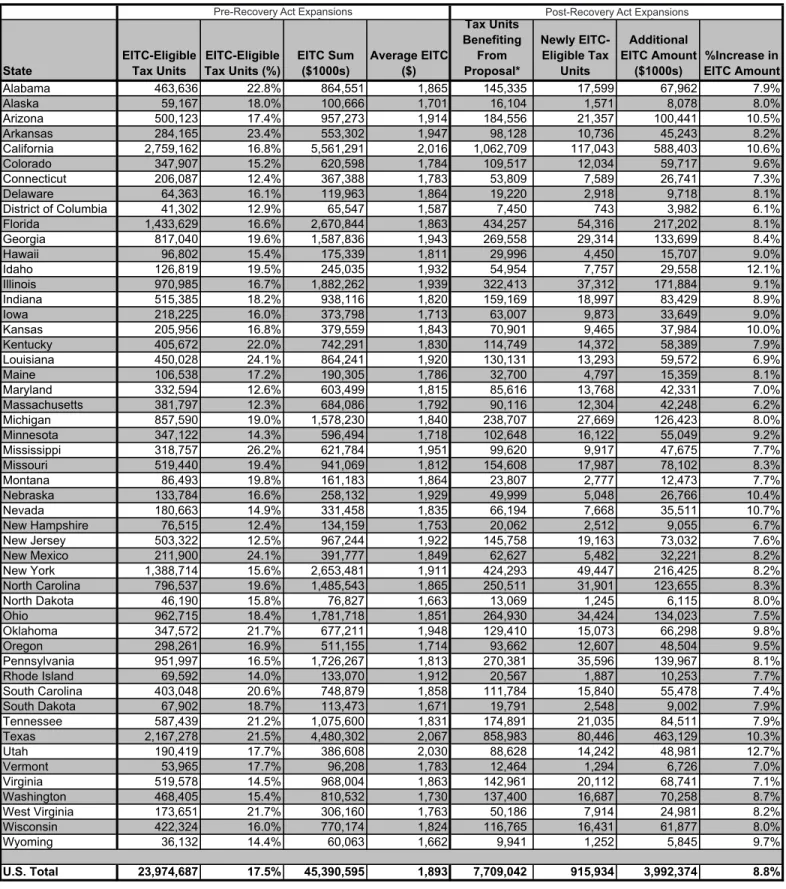
These changes will benefit an estimated 7.7 million families nationwide by increasing the
amount of EITC for which they are eligible and make 900,000 families newly eligible for the
credit. The amount of EITC dollars going to American families will increase by $4 billion – an
8.8 percent increase from current law. President Obama’s budget includes a proposal to make
these temporary changes to the EITC permanent, and U.S. Senator Max Baucus recently
intro-duced legislation that would make these improvements permanent.
H
OW TO
I
MPROVE THE
E
ARNED
I
NCOME
T
AX
C
REDIT
By reducing poverty and encouraging work, the EITC is viewed as one of the most successful
policies enacted in recent history. Yet the EITC could do more to close the gap between what
families earn and what they need to make ends meet. While the American Recovery and
Rein-vestment Act made significant improvements to the federal EITC, those changes are temporary
and additional changes could be made to improve the EITC even further. A few options have
been developed by legislators, think tanks and public policy organizations, including:
Expand the credit for childless workers
The EITC is available to childless workers, but only for individuals with incomes of up to
$13,000 ($16,000 for married couples). However, these low-income workers still face a high
federal tax burden and many of these tax filers are non-custodial parents that provide child
support to their children’s custodial parent.
Further, labor force participation among lesser-skilled men is declining and an expansion to the
1
EIT
C
BA
C
KG
RO
UN
D
A
N
D
D
O
C
UM
EN
TS
7
4See The Brookings Institution. 2008. “The Scouting Report: Decrease Poverty and Increase Opportunity.” November 26, 2008EITC could provide an additional incentive to work.
4The EITC could be expanded for these
low-income workers by increasing the income limits for which they are eligible for the credit,
increasing the maximum credit amount, and reducing the age at which they can claim the credit
(currently an individual must be 25 to be eligible for the EITC).
Further reducing the “marriage penalty”
The American Recovery and Reinvestment Act slightly reduced the “marriage penalty” built into
the EITC. Currently, families with two earners must report both incomes – a policy which
results in lower EITC benefits for married couples. However, there remains a significant
marriage penalty even after the ARRA adjustment. Proposals include allowing the couple to
disregard half of the earnings of the lower earning spouse if that would provide a larger EITC
5or
allowing the primary worker to claim the child-based EITC and the secondary earner to claim a
smaller credit for low-earning spouses.
61
EI
TC
BA
C
KG
RO
UN
D
A
N
D
D
O
C
UM
EN
TS
8
5 Center for American Progress. 2007. “From Poverty to Prosperity: A National Strategy to Cut Poverty in Half.” Washington, D.C. (April, 2007), http://www.american¬progress.org/issues/2007/04/pdf/poverty_report.pdf, accessed March 25, 2009; Berube, Alan, David Park, and Elizabeth Kneebone. 2008. “Metro Raise: Boosting the Earned Income Tax Credit to Help Metropolitan Workers and Families.” Washington, D.C.: Policy Program, Brookings Institution (June).
1
EIT
C
BA
C
KG
RO
UN
D
A
N
D
D
O
C
UM
EN
TS
9
Table 1. EITC-Eligible Tax Units and Credit Amounts Pre-Recovery Act Expansions and Post-Recovery Act ExpansionsPre-Recovery Act Expansions Pre-Recovery Act Expansions
State EITC-Eligible Tax Units Tax Units (%)EITC-Eligible EITC Sum ($1000s) Average EITC ($)
Tax Units Benefiting From Proposal* Newly EITC-Eligible Tax Units Additional EITC Amount
($1000s) EITC Amount%Increase in
Alabama 463,636 22.8% 864,551 1,865 145,335 17,599 67,962 7.9% Alaska 59,167 18.0% 100,666 1,701 16,104 1,571 8,078 8.0% Arizona 500,123 17.4% 957,273 1,914 184,556 21,357 100,441 10.5% Arkansas 284,165 23.4% 553,302 1,947 98,128 10,736 45,243 8.2% California 2,759,162 16.8% 5,561,291 2,016 1,062,709 117,043 588,403 10.6% Colorado 347,907 15.2% 620,598 1,784 109,517 12,034 59,717 9.6% Connecticut 206,087 12.4% 367,388 1,783 53,809 7,589 26,741 7.3% Delaware 64,363 16.1% 119,963 1,864 19,220 2,918 9,718 8.1% District of Columbia 41,302 12.9% 65,547 1,587 7,450 743 3,982 6.1% Florida 1,433,629 16.6% 2,670,844 1,863 434,257 54,316 217,202 8.1% Georgia 817,040 19.6% 1,587,836 1,943 269,558 29,314 133,699 8.4% Hawaii 96,802 15.4% 175,339 1,811 29,996 4,450 15,707 9.0% Idaho 126,819 19.5% 245,035 1,932 54,954 7,757 29,558 12.1% Illinois 970,985 16.7% 1,882,262 1,939 322,413 37,312 171,884 9.1% Indiana 515,385 18.2% 938,116 1,820 159,169 18,997 83,429 8.9% Iowa 218,225 16.0% 373,798 1,713 63,007 9,873 33,649 9.0% Kansas 205,956 16.8% 379,559 1,843 70,901 9,465 37,984 10.0% Kentucky 405,672 22.0% 742,291 1,830 114,749 14,372 58,389 7.9% Louisiana 450,028 24.1% 864,241 1,920 130,131 13,293 59,572 6.9% Maine 106,538 17.2% 190,305 1,786 32,700 4,797 15,359 8.1% Maryland 332,594 12.6% 603,499 1,815 85,616 13,768 42,331 7.0% Massachusetts 381,797 12.3% 684,086 1,792 90,116 12,304 42,248 6.2% Michigan 857,590 19.0% 1,578,230 1,840 238,707 27,669 126,423 8.0% Minnesota 347,122 14.3% 596,494 1,718 102,648 16,122 55,049 9.2% Mississippi 318,757 26.2% 621,784 1,951 99,620 9,917 47,675 7.7% Missouri 519,440 19.4% 941,069 1,812 154,608 17,987 78,102 8.3% Montana 86,493 19.8% 161,183 1,864 23,807 2,777 12,473 7.7% Nebraska 133,784 16.6% 258,132 1,929 49,999 5,048 26,766 10.4% Nevada 180,663 14.9% 331,458 1,835 66,194 7,668 35,511 10.7% New Hampshire 76,515 12.4% 134,159 1,753 20,062 2,512 9,055 6.7% New Jersey 503,322 12.5% 967,244 1,922 145,758 19,163 73,032 7.6% New Mexico 211,900 24.1% 391,777 1,849 62,627 5,482 32,221 8.2% New York 1,388,714 15.6% 2,653,481 1,911 424,293 49,447 216,425 8.2% North Carolina 796,537 19.6% 1,485,543 1,865 250,511 31,901 123,655 8.3% North Dakota 46,190 15.8% 76,827 1,663 13,069 1,245 6,115 8.0% Ohio 962,715 18.4% 1,781,718 1,851 264,930 34,424 134,023 7.5% Oklahoma 347,572 21.7% 677,211 1,948 129,410 15,073 66,298 9.8% Oregon 298,261 16.9% 511,155 1,714 93,662 12,607 48,504 9.5% Pennsylvania 951,997 16.5% 1,726,267 1,813 270,381 35,596 139,967 8.1% Rhode Island 69,592 14.0% 133,070 1,912 20,567 1,887 10,253 7.7% South Carolina 403,048 20.6% 748,879 1,858 111,784 15,840 55,478 7.4% South Dakota 67,902 18.7% 113,473 1,671 19,791 2,548 9,002 7.9% Tennessee 587,439 21.2% 1,075,600 1,831 174,891 21,035 84,511 7.9% Texas 2,167,278 21.5% 4,480,302 2,067 858,983 80,446 463,129 10.3% Utah 190,419 17.7% 386,608 2,030 88,628 14,242 48,981 12.7% Vermont 53,965 17.7% 96,208 1,783 12,464 1,294 6,726 7.0% Virginia 519,578 14.5% 968,004 1,863 142,961 20,112 68,741 7.1% Washington 468,405 15.4% 810,532 1,730 137,400 16,687 70,258 8.7% West Virginia 173,651 21.7% 306,160 1,763 50,186 7,914 24,981 8.2% Wisconsin 422,324 16.0% 770,174 1,824 116,765 16,431 61,877 8.0% Wyoming 36,132 14.4% 60,063 1,662 9,941 1,252 5,845 9.7% U.S. Total 23,974,687 17.5% 45,390,595 1,893 7,709,042 915,934 3,992,374 8.8% Source: Brookings Institution MetroTax Model
*Units "benefit" from an expansion proposal if (A) their EITC credit amount increases; or (B) they become eligible for the EITC under the new param Note: This analysis uses the 2007 American Community Survey PUMS. "Current Law" is based on tax year 2007 eligibility criteria.
"House Expansion Proposal" includes a third tier for families with three or more qualifying children that follows the income guidelines for families with two children, but phases in at 45%; it also includes a marriage penalty relief provision that phases out $2,000 after TY2007 levels for married couples.
Post-Recovery Act Expansions Pre-Recovery Act Expansions
ABOUT STATE EARNED INCOME TAX CREDITS
Twenty-four states (counting the District of Columbia) have created a state version of the
Earned Income Tax Credit (EITC) to reduce the tax burden on low- and moderate-income
working families. The state EITC supplements the federal credit and works as a rebate for state
taxes paid by low-income working people. In addition, local governments in Montgomery
County, Md., San Francisco and New York City offer their own version of EITCs.
Almost all state EITCs are
“refundable,” meaning that if
the size of the family’s credit
exceeds the amount of state
income tax it owes, the
fam-ily receives the difference in
the form of a refund check.
States with EITCs use the
same eligibility rules as the
federal EITC, meaning only
people who work can qualify
for the credit. To simplify
the process for states, most
states typically use a fixed
percentage of the federal
credit to calculate the state
credit. State credits range from 3.5 percent of the federal credit to 40 percent of the federal
credit.
The first state EITCs were enacted in the 1980s and a few states picked up the policy in the
1990s. But in recent years, state EITCs have become increasingly popular with eight states
enacting a state-level EITC and 11 states expanding existing credits since 2002. A number of
fac-tors contribute to the increased interest in adopting state EITC:
N
CONTINUED CHILD POVERTY AND ECONOMIC HARDSHIP
Millions of children in working families live in poverty, and millions of families with
incomes modestly above the poverty line have difficulty affording food, housing and other
necessities. The federal EITC now lifts about 4.4 million peopleo — over half of them
children — out of poverty each year, making it the nation’s most effective antipoverty
program for working families. State EITCs supplement the federal credit, lifting more
fam-ilies out of poverty and helping near-poor famfam-ilies make ends meet.
N
S
LOW WAGE GROWTH
Wage and salary growth has been weak in recent years. Concern about low wages has led
a number of states and the federal government to raise their minimum wages, but even
1
EI
TC
BA
C
KG
RO
UN
D
A
N
D
D
O
C
UM
EN
TS
10
with those increases, many low-wage jobs don’t provide a sufficient income on which to
live. Refundable state EITCs provide low-income workers with a needed income boost.
N
REGRESSIVE TAX SYSTEMS
States rely heavily on “regressive” taxes such as sales, excise and property taxes, which hit
poorer families harder than wealthier ones when measured as a share of a family’s income.
Since a state EITC is aimed only at low- and moderate-income families, it helps offset the
impact of regressive taxes, making state tax systems more fair.
N
E
XTENSIVE EVIDENCE THAT
EITC
S ENCOURAGE WORK
Studies have shown that EITCs encourage families to obtain jobs and remain employed.
N
EVIDENCE THAT
EITCS ARE USED FOR ASSET-BUILDING EXPENDITURES
Many people use their EITC refunds to make the kinds of investments that enhance
eco-nomic security and promote ecoeco-nomic opportunity, such as paying off debt and investing
in education.
N
E
ASE OF ADMINISTRATION
A state EITC requires adding just one line to a state income tax form and the calculation is
very simple. States with EITCs report very low additional administrative costs with the
credit – typically a fraction of one percent.
71
EIT
C
BA
C
KG
RO
UN
D
A
N
D
D
O
C
UM
EN
TS
11
7 List of reasons for increased interest taken from Center on Budget and Policy Priorities, “Policy Basics: Sate Earned Income Tax1
EI
TC
BA
C
KG
RO
UN
D
A
N
D
D
O
C
UM
EN
TS
12
TABLE 1: STATE EARNED INCOME TAX CREDITS BASED ON THE FEDERAL EITC
State*
(Tax Year 2008 Except as Noted)
Percentage of Federal Credit
Refundable?
Workers Without
Qualifying
Children Eligible?
Delaware
20%
No
Yes
District of Columbia
40%
Yes
Yes
Indiana
6% (to 9% in 2009)
Yes
Yes
Illinois
5%
Yes
Yes
Iowa
7%
Yes
Yes
Kansas
17%
Yes
Yes
Louisiana
3.5%
Yes
Yes
Maine
5% (partially refundable in 2010)
Partially
aYes
Maryland
b25%
Yes
Yes
Massachusetts
15%
Yes
Yes
Michigan
10% (to 20% in 2009)
Yes
Yes
Minnesota
cAverage 33%
Yes
Yes
Nebraska
10%
Yes
Yes
New Jersey
22.5% (to 25% in 2009)
Yes
Yes
New Mexico
10%
Yes
Yes
New York
d30%
Yes
Yes
North Carolina
e3.5% (to 5% in 2009)
Yes
Yes
Oklahoma
5%
Yes
Yes
Oregon
f6%
Yes
Yes
Rhode Island
25%
Partially
gYes
Vermont
32%
Yes
Yes
Virginia
20%
No
Yes
Washington
5% in 2009 (to 10% in 2010)
Yes
Yes
Wisconsin
4% — one child
14% — two children
43% — three children
Yes
No
*Notes: From 1999 to 2001, Colorado offered a 10 percent refundable EITC financed from required rebates under the state’s “Tax-payer Bill of Rights” amendment. Those rebates, and hence the EITC, were suspended beginning in 2002 due to lack of funds and again in 2005 as a result of a voter-approved five-year suspension of TABOR. Under current law, the rebates will resume in 2011, but a recent income tax cut that also depends on the rebates is likely to exhaust the funds, leaving the EITC unfunded.
aMaine's EITC was made partially refundable during the 2009 legislative session. For tax years 2010 and beyond the EITC will be refundable up to $150 for taxpayers filing married joint returns and $125 for all other taxpayers.
bMaryland also offers a non-refundable EITC set at 50 percent of the federal credit. Taxpayers in effect may claim either the refund-able credit or the non-refundrefund-able credit, but not both.
cMinnesota’s credit for families with children, unlike the other credits shown in this table, is not expressly structured as a percentage of the federal credit. Depending on income level, the credit for families with children may range from 25 percent to 45 percent of the federal credit; taxpayers without children may receive a 25 percent credit.
dShould the federal government reduce New York’s share of the TANF block grant, the New York credit would be reduced automati-cally to the 1999 level of 20 percent.
eNorth Carolina's EITC is scheduled to expire in 2013. fOregon's EITC is scheduled to expire at the end of 2013.
gRhode Island made a very small portion of its EITC refundable effective in Tax Year 2003. In 2006, the refundable portion was in-creased from 10 percent to 15 percent of the nonrefundable credit (i.e., 3.75 percent of the federal EITC)
hWashington’s EITC is worth five percent of the federal EITC or $25, whichever is greater. When the matching rate rises to ten per-cent in 2010, the minimum value will rise to $50.
1
EIT
C
BA
C
KG
RO
UN
D
A
N
D
D
O
C
UM
EN
TS
13
ABOUT THE VOLUNTEER INCOME TAX
ASSISTANCE PROGRAM
BUILDING
FINANCIAL
SECURITY FOR
LOW-INCOME
FAMILIES
Community Volunteer Income Tax Assistance (VITA) programs offer free tax help and related
financial services to low-income individuals and families. During the 2009 filing season, VITA
programs directly served more than
one million underserved taxpayers, including low-wage
workers, persons with disabilities, the elderly, Native Americans, rural populations, and those
with limited English-language skills. VITA clients often have the opportunity to open bank
ac-counts and to invest their refunds in safe financial products such as U.S. Savings Bonds, while
avoiding the high fees charged by paid preparers and refund anticipation loans (RALs).
Due to high unemployment rates, reduced wages and scaled-back hours, many additional
work-ers will qualify for VITA services over the next two years. For families living on tight budgets, it
is now more important than ever to have access to free tax services and the opportunity to take
advantage of the new tax benefits enacted as part of the American Recovery and Reinvestment
Act.
8At a time when VITA programs are poised to ramp-up services, sources of local funding
have started to dry up. State and local governments are cutting back, while private foundations
are beginning to limit grant-making.
Funding from state and local governments, private foundations and individual donors in
combi-nation with in-kind contributions from volunteers and community organizations enabled VITA
programs to dramatically increase the number of returns prepared over the past five years. Many
VITA programs are firmly established in their communities, but struggle to balance the need to
meet growing demand with the desire to reach underserved populations where there are no
VITA sites or other alternatives to paid preparers. The 2008 Consolidated Appropriations Act
9created an $8 million competitive matching grant program to enable grant recipients to assist
underserved populations living and working in hard-to-reach rural, Native, urban and suburban
communities.
Congress can help VITA programs meet the tax and financial service needs of underserved
communities by continuing to increase the appropriation for the VITA Grant Program.
Ad-ditional funding, beyond the original $8 million appropriation, would make it possible for VITA
programs to effectively serve and reach more working families hit hard by the recession.
THE
IMPACT OF
COMMUNITY
VITA
Community VITA programs are well worth the additional investment. For underserved
work-ers, the program offers free tax preparation and serves as a gateway to mainstream financial
serv-ices. To the volunteers who dedicate tens of thousands of hours during tax season, VITA
8Pub. L. 111-5, Sep. 30, 2009.
1
EI
TC
BA
C
KG
RO
UN
D
A
N
D
D
O
C
UM
EN
TS
14
programs are an opportunity to give back to their communities. For the federal government,
VITA programs are a way to improve taxpayer services and to ensure that workers receive the
tax benefits they have earned. A substantial increase in federal funding for the VITA Grant
Pro-gram will enable community VITA proPro-grams to strengthen and expand their role as:
N
One Piece of the Economic Recovery Puzzle:
VITA programs help low-income workers
to access tax benefits, such as the Earned Income Tax Credit and Child Tax Credit.
N
A Smart Alternative to Paid Preparers:
VITA program clients keep 100 percent of their
tax refunds and avoid high-cost loan products.
N
A Bridge to Financial Security:
Many VITA programs offer clients the opportunity to
open bank accounts, invest in U.S. Savings Bonds and access public benefits.
THE
VITA GRANT
PROGRAM
While VITA programs have been in existence for 40 years, which is as long as the federally
funded Tax Counseling for the Elderly (TCE) and Low-Income Taxpayer Clinic (LITC)
programs combined, the program did not receive federal funding until the 2008 Consolidated
Appropriations Act
10authorized an $8 million competitive matching grant program.
The 2009 Omnibus Appropriations Act
11extended funding by $8 million through September 30,
2010. And the President’s FY 2010 budget proposes to continue funding by an additional $8
mil-lion through September 30, 2011.
Congress created the matching grant program to help VITA programs achieve the
follow-ing objectives:
N Enable the VITA programs to extend services to underserved populations in
hardest-to-reach areas, both urban and non-urban
N Increase the capacity to file returns electronically
N Heighten quality control
N Enhance training of volunteers
N Significantly improve the accuracy rate of returns prepared at VITA sites.
F
IRST
-Y
EAR
R
ESULTS
From July to September 2008, 379 VITA programs applied for $30 million in funding with 111
first-year applicants receiving a grant. Grant amounts ranged from $731 to $600,000 with a
median grant of $56,000. Of the $8 million available in FY 2008, the IRS allocated $7.4 million
10 Pub. L. 110-161, Dec. 26, 2007 (121 Stat. 1975). 11 Pub. L. 111-8, Mar. 11, 2009 (123 Stat. 634).
1
EIT
C
BA
C
KG
RO
UN
D
A
N
D
D
O
C
UM
EN
TS
15
for grants and retained the remaining $600,000 to cover a portion of the $2.1 million it cost to
administer the program in its first year.
12Diverse organizations received funding, including community-based organizations, local United
Ways, asset-building coalitions, national nonprofits, AARP, community action agencies, local
and tribal governments and public universities. Programs serving rural populations received
one-fourth of the grant funding, while organizations serving Native American communities and
disabled persons received 5 and 3 percent of the funding, respectively.
During the 2009 filing season, the IRS conducted its first rigorous evaluation of VITA tax
prepa-ration accuracy.
13The study, which will serve as a baseline for future evaluations, is expected to
be released in late 2009.
VITA programs file more than 90 percent of tax returns electronically. During filing season
2009, approximately half of all VITA clients requested direct deposit with nearly 3,000 choosing
the split refund option (a substantial increase from the 2008 filing season) that enables
taxpay-ers to direct refunds toward multiple accounts. VITA programs view direct deposit and split
refunds as a way to promote asset-building at tax sites. For example, in 2009, numerous
programs allowed clients to direct a portion of their refund toward the purchase of U.S. Savings
Bonds.
THE
COST OF
PAID
TAX
PREPARATION AND
REFUND
ANTICIPATION
LOANS
Low-income workers and their families have benefited from the creation and expansion of
refundable tax credits, such as the EITC and the Child Tax Credit. However, these and other tax
credits continue to increase tax code complexity, making it nearly impossible for low-income
workers to complete their tax returns unassisted. The majority of Americans need help
prepar-ing their tax returns. In 2007, paid tax preparers completed nearly 87 million tax returns – 63
percent of all returns filed. The percent of low-income taxpayers relying on paid tax preparers is
even higher: for example, nearly three-fourths of the 23 million EITC recipients rely on a paid
preparer.
H&R Block, one of the more competitively-priced tax preparers, charged an average of $187 per
return in 2009. Meanwhile, consumer advocates estimate that in 2007, 5.4 million EITC
recipi-ents took out a refund anticipation loan (RAL) at an average cost of $96 per loan. As VITA
programs plan how to help clients take advantage of next filing season’s expanded tax benefits,
many paid preparers will be looking for ways to profit from expected large tax refunds.
In 2008, the average VITA client earned $18,800 before taxes or about $9 per hour. At this hourly
rate, a person must work 21 hours just to cover the average cost of tax preparation at H&R
Block. This same person needs to work nearly 6.5 additional hours to purchase an H&R Block
refund anticipation loan.
12 During a May 20, 2009 meeting at the Center for Economic Progress’s office in Chicago, IL, the Internal Revenue Service’s Stakeholders, Partnerships, Education, and Communication office provided information on the fiscal year 2008 administrative ex-penses and indicated that the IRS would increase the allocation of grant funds toward administrative exex-penses in fiscal year 2009. 13 The Treasury Inspector General for Tax Administration (TIGTA) conducts an evaluation each year. Although the study includes a statistically valid sample of tax sites and tax returns, it islimited to a small number of tax sites. Further, the 2008 audit examined only 36 returns between VITA and the Tax Counseling for the Elderly programs.
1
EI
TC
BA
C
KG
RO
UN
D
A
N
D
D
O
C
UM
EN
TS
16
REFUND
ANTICIPATION
LOANS
14Refund Anticipation Loans (RALs) are one- to two-week loans secured by a taxpayer’s expected
tax refund. For a steep price, RALs provide taxpayers near-instant access to their tax refunds.
Unfortunately, many taxpayers do not understand the true cost of RALs or know that by
choos-ing direct deposit they can receive their tax refund in as little as 10 days. Paid tax preparation
and RALs are an enormous drain on federal programs like the EITC and Child Tax Credit. Every
dollar spent on high-cost services and products is one less dollar hard-working taxpayers have
available to spend or save.
N 8.7 million taxpayers purchased a RAL during the 2007 filing season
N Taxpayers paid an estimated $833 million in RAL fees
N The cost of a $3,000 RAL ranges from $62 to $110
N 63 percent of RAL customers receive the EITC
N RAL fees drain $523 million from the EITC program
C
OST OF
P
AID
T
AX
P
REPARATION AND
RAL
S TO THE
EITC P
ROGRAM
15Source: Fox, Jean Ann and Chi Chi Wu, Big Business, Big Bucks: Quickie Tax Loans Generate Profits for Banks and Tax Preparers While Putting Low-Income Taxpayers At Risk, National Consumer Law Center and Consumer Federation of America, Washington, DC: Feb. 2009 http://www.consumerlaw.org/issues/refund_anticipation/content/2009_RAL_Report.pdf.
COMMUNITY
VITA
AND
ASSET-BUILDING
SERVICES
Tax preparation remains the cornerstone of VITA programs. But in recent years, more VITA
pro-grams have offered financial services and products to help clients save and invest their tax
refunds.
Total federal tax refunds
returned to VITA clients reached
$1.4 billion
in 2009,
mak-ing tax season the time for workers to take account of their family’s finances and invest in their
children’s futures.
A recent survey of National Community Tax Coalition member organizations found that two
out of three programs offer clients the opportunity to open checking and saving accounts at tax
Type of fee
Cost to taxpayer
Drain on EITC Program
Tax preparation fee
$183
$996 million
RAL loan fee (including dummy account fee)
$58 or $107.50
$523 million
Add-on RAL Fee (for 20%)
$40
$44 million
Total Cost
$281 or $330.50
$1.56 billion
14 Fox, Jean Ann and Chi Chi Wu, Big Business, Big Bucks: Quickie Tax Loans Generate Profits for Banks and Tax Preparers While Putting Low-Income Taxpayers At Risk, National Consumer Law Center and Consumer Federation of America, Washington, DC: Feb. 2009, http://www.consumerlaw.org/issues/refund_anticipation/content/2009_RAL_Report.pdf.
15 Fox, Jean Ann and Chi Chi Wu, Big Business, Big Bucks: Quickie Tax Loans Generate Profits for Banks and Tax Preparers While Putting Low-Income Taxpayers At Risk, National Consumer Law Center and Consumer Federation of America, Washington, DC: Feb. 2009, http://www.consumerlaw.org/issues/refund_anticipation/content/2009_RAL_Report.pdf.