Indigenous Australians and the
National Disability Insurance Scheme:
The extent and nature of disability,
measurement issues and service
delivery models
Authors
Nicholas Biddle*, Fadwa Al-Yaman**, Michelle Gourley**, Matthew
Gray*, J. Rob Bray*, Brendan Brady**, Le Anh Pham**, Emma
Williams*, Maxine Montaigne*
* Australian National University
ISSN ……… ISBN ………
This work is copyright. Apart from any use as permitted under the Copyright Act 1968, no part may be reproduced by any process without prior written permission from the Commonwealth available from the Commonwealth Copyright Administration, Attorney-General’s Department. Requests and inquiries concerning reproduction and rights should be addressed to the Commonwealth Copyright Administration, Attorney-General’s Department, Robert Garran Offices, National Circuit, Barton, ACT 2600 or posted at <http://www.ag.gov.au/cca>.
The opinions, comments and/or analysis expressed in this document are those of the authors and do not necessarily represent the views of the Minister for Families, Housing, Community Services and Indigenous Affairs or the Australian Government Department of Families, Housing,
Community Services and Indigenous Affairs, and cannot be taken in any way as expressions of Government policy.
Acknowledgements
In the process of developing this paper a number of individuals and groups were consulted including Aboriginal Medical Services Alliances NT (AMSANT), Carpentaria Disability Services, Damian Griffis (First Peoples Disability Network), Anthony Hogan (ANU), Boyd Hunter (ANU), Sven Silburn (Menzies School of Health Research), and John Wakerman (Centre for Remote Health, Flinders University). Comments were also provided by officials from the Commonwealth Department of Families, Housing, Community Services and Indigenous Affairs (FaHCSIA) and relevant State/Territory Departments. Research assistance was provided by Mandy Yap.
i
Contents
Contents ... i
List of Tables ... iv
List of Figures ... vi
Executive summary ... viii
1. Introduction ... 1
P
ARTI—B
ACKGROUND... 3
2. Overview of the NDIS ... 3
2.1 Brief history of the development of the NDIS ... 3
2.2 Overview and key characteristics of the NDIS—eligibility and assessment ... 5
2.3 Overview and key characteristics of the NDIS—Type and method of support ... 6
2.4 Productivity Commission Report recommendations specifically related to Indigenous Australians ... 8
3. The demographic and geographic context ... 11
3.1 Indigenous age structure and projected growth of the Indigenous population... 11
3.2 The geographic distribution of the Indigenous population ... 14
4. Indigenous notions of and approaches to disability ... 18
4.1 Disability, health and community participation ... 18
4.2 The care of Indigenous people with a disability ... 20
4.3 Demand for disability services ... 20
5. Frameworks for disability and other service delivery models ... 22
5.1 The Other Invisible Hand—Trust; targets and performance management; voice; and choice and competition. ... 22
5.2 Direct payments and disability service provision ... 25
P
ARTII—T
HE EXTENT AND NATURE OF DISABILITY IN THEI
NDIGENOUS POPULATION... 29
6. Measuring disability ... 30
6.1 Measuring disability in surveys ... 30
6.2 Estimates from the Census, NATSISS ... 34
7. Profile of disability among Indigenous Australians ... 36
7.1 Number of persons with a disability ... 36
7.2 Age profile of Indigenous persons with disability ... 36
7.3 Where do Indigenous people with a disability live? ... 38
7.4 What types of disability are experienced by Indigenous people? ... 40
7.5 Impact on education and employment ... 43
7.6 Has disability among the Indigenous population changed over time? ... 44
7.7 Socioeconomic characteristics of Indigenous persons with a disability ... 45
7.8 The health and wellbeing of Indigenous persons with a disability ... 49
8. Profile of Indigenous people receiving specialist disability services ... 52
ii
8.2 Disability groups ... 55
8.3 Type of assistance provided ... 56
8.4 Amount of assistance provided by disability support services ... 58
8.5 Income and employment status of Indigenous specialist disability service users .. 59
8.6 Met need for disability support services ... 59
9. Barriers to accessing services ... 63
10. Current dataset gaps and limitations ... 69
10.1 Census and Survey data on disability prevalence ... 70
10.2 Administrative data on disability services ... 72
10.3 Other community service data collections which include an Indigenous identifier73 10.4 Current plans for improving disability data ... 74
11. Suggestions for addressing data gaps/improved methods of data collection ... 76
P
ARTIII:
I
SSUES IN THE DELIVERY OF DISABILITY SERVICES AND POSSIBLE SERVICE DELIVERY MODELS... 78
12. Implications of the nature of Indigenous disability for service delivery ... 79
13. Current disability service delivery models and systems in states and territories 81 14. The context of service delivery ... 87
14.1 Remote communities... 87
14.2 Cost of providing services according to Indigenous status and geographic remoteness ... 88
14.3 Estimating current and projected demand for NDIS in NPARSD locations ... 90
14.4 Primary health care system in remote communities... 91
14.5 Models for the delivery of family and relationship services in regional, rural and remote areas ... 93
14.6 Existing evaluations of service delivery models ... 97
14.7 Examples of disability services models ... 100
15. Providing a disability workforce ... 105
15.1 Introduction ... 105
15.2 The current disability workforce ... 106
15.3 Current labour shortages ... 107
15.4 Indigenous Australians in the disability workforce... 110
15.5 Indigenous carers as a potential workforce ... 111
16. Key issues for disability service delivery models for remote Indigenous communities ... 114
16.1 Screening and assessment of disability ... 114
16.2 Provision of disability services ... 115
17. Concluding comments ... 117
References ... 122
Appendix A: Projection methodology for Remote Service Delivery areas ... 126
Appendix B: How Indigenous persons with a disability were identified in the NATSISS, Census and SDAC ... 134
17.1 National Aboriginal or Torres Strait Islander Social Survey (NATSISS) 2008 .. 134
17.2 Census 2006 ... 135
iii
Appendix C: Key questions to inform NDIS and mapping to available data ... 140 Appendix D: Data sources on disability for the Indigenous population—scope, definitions, data items and data quality/gaps ... 141 Appendix E: Attachment Tables ... 145
iv
List of Tables
Table 1: Number of discrete Indigenous communities and population by remoteness area, 2006 ... 16 Table 2: Data sources on disability prevalence among the Indigenous population ... 34 Table 3: Need for Assistance compared with Severe/Profound Core Activity Limitation, by
age, 2006 and 2008 ... 35 Table 4: Number and proportion of Indigenous persons with a core activity need for
assistance, age-group, by remoteness, 2006 ... 37 Table 5: Number and proportion of Indigenous persons with a core activity need for
assistance, state/territory by remoteness, 2006 ... 39 Table 6: Indigenous Australians aged 15–64 with severe or profound core activity
limitations, disability group, 2008 ... 41 Table 7: Indigenous Australians aged 15 years and over with disability or long-term health
condition, by remoteness, 2008 ... 41 Table 8: Indigenous persons with a disability or long-term health condition aged 15–64
years, by whether they had an education restriction due to disability, by age group, 2008 ... 43 Table 9: Indigenous persons with a disability or long-term health condition aged 15–64
years, by whether they had an employment restriction due to disability, by age group, 2008 ... 44 Table 10: Severity of disability, Indigenous Australians aged 15 years and over by
remoteness, 2002 and 2008 ... 45 Table 11: Employment status by Indigenous status and need for assistance, aged 15–64
years, 2006 ... 47 Table 12: Principal source of income by disability level and Indigenous status, 2006 and
2008 ... 47 Table 13: Indigenous Australians aged 15–64 years, health risk factors by disability status,
2008 ... 51 Table 14: Users of disability support services, by Indigenous status and age group, 2009–10 ... 54 Table 15: Users of disability support services, by Indigenous status and location, 2009–10 55 Table 16: Characteristics of Indigenous and non-Indigenous service users of disability
support services, 2009–10 ... 56 Table 17: Disability service use rates for persons aged 0–64 years, by age and Indigenous
status, 2009–10 ... 61 Table 18: Indigenous Australians aged 18–64 years, problems accessing service providers,
by disability, 2008 ... 63 Table 19: All Australians aged 18–64 years, problems accessing service providers, by
v
Table 20: Problems accessing services, Indigenous persons aged 15 years and over, by age group, 2008 (per cent) ... 64 Table 21: Community service data collections ... 73 Table 22: Disability service models operating in Australia ... 82 Table 24: Estimated average spending on comparable Indigenous and non-Indigenous people
($) ... 89 Table 23: Potential NDIS demand in 29 priority communities ... 91 Table 25: Review of service provider models in regional, rural and remote areas of Australia ... 94 Table 26: Distribution of disability and related workers by remoteness area—2006 ... 108 Table 27: Average number of disability and related workers in the area by Indigenous status
and remoteness area, 2006 ... 109 Table 28: Per cent of Indigenous and non-Indigenous Australians who provided unpaid
vi
List of Figures
Figure 1: Age distribution of the Indigenous and non-Indigenous population, 2011 ... 12 Figure 2: Indigenous age distribution, 2006 (estimates) and 2031 (projections) ... 14 Figure 3: Geographic distribution of the Indigenous population, 2011 ... 15 Figure 4: Need for assistance with core activities by Indigenous Australians: rate compared
to non-Indigenous Australians, 2006 ... 38 Figure 5: Need for assistance with core activities, by state/territory and Indigenous status,
2006 ... 40 Figure 6: Need for assistance with core activities, by remoteness and Indigenous status,
2006 ... 40 Figure 7: Type of disability, Indigenous persons aged 15 years and over in non-remote
areas, by age-group, 2008 ... 42 Figure 8: Persons aged 15 years and over in non-remote areas, by type of disability, 2006
(Non-Indigenous) and 2008 (Indigenous) ... 43 Figure 9: Whether has an education or employment restriction due to disability, Indigenous
persons aged 15–64 years, 2008 ... 44 Figure 10: Disability status(a) by equivalised gross household income, Aboriginal and Torres
Strait Islander people aged 15 years and over, 2008 ... 46 Figure 11: Highest school attainment, by disability and Indigenous status, age 18–64 years,
2006 and 2008 ... 48 Figure 12: Self-assessed health, by disability and Indigenous status, age 18–64 years, 2006
and 2008 ... 49 Figure 13: Number of stressors experienced in the previous 12 months, Indigenous
Australians, 2008 ... 50 Figure 14: Disability support services, Indigenous service users, by state/territory, 2005–06 to
2009–10 ... 53 Figure 15: Disability support services, Non-Indigenous service users, by state/territory, 2005– 06 to 2009–10 ... 54 Figure 16: of disability support services by type and Indigenous status, 2009–10 ... 57 Figure 17: of disability support services, by type, 2005-06 to 2009–10 ... 58 Figure 18: Users of Disability support services per 1,000 potential population, by Indigenous
status and state/territory, aged 0–64 years, 2009–10 ... 60 Figure 19: Indigenous users of disability support services per 1,000 potential population, by
Indigenous status and state/territory, aged 0–64 years, 2005–06 to 2009–10 ... 61 Figure 20: Indigenous users of disability support services per 1,000 potential population, by
vii
Figure 21: Types of services had problems accessing, Indigenous persons aged 15 years and over, by presence of a disability and remoteness, 2008 ... 65 Figure 22: Types of barriers to accessing services, Indigenous persons aged 15 years and
over, by presence of a disability and remoteness, 2008 ... 67 Figure 23: Remoteness cost gradient for police, schools and general services ... 89 Figure 24: Summary of key issues for Indigenous Australians and the National Disability
Executive summary
The National Disability Insurance Scheme (NDIS) is a major policy initiative that has the potential to transform the lives of many Australians with a disability, as well as those who care for them. Because of Indigenous Australians’ high rate of disability and frequently poor access to existing services, the program has considerable potential to improve outcomes for this community and contribute to closing the gap on Indigenous disadvantage. However, to be successful in achieving this, careful consideration will need to be given so as to ensure that Indigenous Australians have appropriate and equal access to the scheme and that the scheme be adaptable to the needs of Indigenous participants.
The Centre for Aboriginal Economic Policy Research (CAEPR) at the Australian National University (ANU) and the Australian Institute of Health and Welfare (AIHW) were commissioned by the Commonwealth Department of Families, Housing, Community Services and Indigenous Affairs (FaHCSIA) to produce a report which brings together a wide range of research and data which may help inform an understanding of disability amongst Indigenous Australians and more broadly on the approaches which may be adopted to address Indigenous disability issues.
As such this report aims to provide information to help inform the design and implementation of the NDIS, in order to meet the needs of Indigenous Australians with a disability and their carers. Two broad issues are addressed, disability incidence, and service approaches. In Part II, existing quantitative data sets are used to provide an analysis of the extent and nature of disability in the Indigenous population, currently and in coming decades. The report in Part III provides an overview of potential models of disability services delivery that could help overcome current barriers experienced by Indigenous Australians. In addition the report contains specific recommendations on how data gaps may be addressed through both quantitative and qualitative research, and summarises findings from promising service delivery practices.
Prevalence and nature of disability in the Indigenous population
Estimating the number of Indigenous Australians with a disability and their support needs faces a number of conceptual, logistical and methodological obstacles. These include the relatively small proportion of the Australian population who identify as being Indigenous, higher concentration of Indigenous Australians in rural and remote areas and the level of economic and social disadvantage faced by Indigenous Australians. All of these mean that the quality of data drawn from household surveys and similar approaches is often relatively poor. In addition data can be affected by different conceptualisations of disability amid some groups of Indigenous Australians,
ix as well as a reluctance of other Indigenous Australians with a disability to identify as such either in survey data or to service providers.
These issues notwithstanding, analysis of existing data sources suggest that Indigenous Australians experience profound or severe core activity limitations at more than double the rate of non-Indigenous Australians. This is in part due to a constellation of risk factors, such as poverty, discrimination, lower rates of education, and higher rates of risky behaviours such as smoking, substance abuse and poor nutrition. Indigenous people with a disability are also relatively more likely to have an intellectual disability than are non-Indigenous Australians.
In addition there is a higher incidence of complex needs and issues which span health, disability and other issues among Indigenous Australians.
There are a number of data issues that need to be resolved in order to obtain an improved understanding of the nature and prevalence of disability in the Indigenous community. However, there are several concrete steps which can be taken. These include the inclusion of standard modules of questions about disability and carers in Indigenous-specific surveys and the undertaking of further work on improving the identification of Indigenous Australians in administrative collections related to disability. The sample size for Indigenous Australians in the Survey of Disability and Carers could be increased to enable reliable estimates for the Indigenous population at the national, state/territory and remoteness levels.
Demographic and geographic characteristics of the Indigenous population and implications for the NDIS
There are a number of demographic factors that will have an impact on the interaction between Indigenous Australians and the NDIS, including the age profile of the Indigenous population. Because the Indigenous population is relatively young a relatively large proportion of the Indigenous population with a disability will be in scope of the NDIS, as opposed to the aged-care system. At the same time, the Indigenous population is ageing and this trend is projected to accelerate in coming decades. As disability rates increase with age, the incidence of disability amongst the Indigenous population is projected to grow substantially, an effect magnified by the faster growth rate of the Indigenous population. A consequence of this is that the proportion of the NDIS population who are Indigenous Australians will increase over time. As such caution needs to be exercised in using current levels of Indigenous needs as the benchmark for the program as it develops.
The geographic location of Indigenous people who are more likely to live in remote and very remote Australia, relative to the non-Indigenous population, raises a number of questions about the delivery of disability services to this group. There is a lack of disability services and supports such as disability-friendly housing and transport in remote areas. The lack of services and facilities in regional and remote areas not only restricts choice but sometimes means people are forced to leave their communities in
x
order to access services and support. Experience of other programs suggests that the cost of service delivery in remote areas is significantly above those in other locations. In addition the extent to which many Indigenous people live in very small communities, which usually comprise very few people (in absolute terms) with disabilities, raises a major challenge regarding the ability of the NDIS to rely upon market mechanisms to meet the needs of the Indigenous population with a disability across remote Australia. Furthermore in some of the larger remote communities, the introduction of the NDIS may lead to a significant inflow of funds as services that are currently not being offered or are being provided informally begin to be provided on a fee for service basis.
Despite this relative concentration in remote areas, the majority of Indigenous Australians still live in urban areas. According to population estimates from the 2006 Census, 75% of Indigenous Australians live in a major city or regional area. Initial estimates from the 2011 Census suggest that the Indigenous population has become more urban since then and will become increasingly urban over the next few decades. Although there are likely to be a range of services available to Indigenous Australians in urban areas, not all may be culturally responsive to the needs of Indigenous people with a disability and there are still a number of characteristics shared by Indigenous Australians across the country that will impact on the NDIS.
Key issues for Indigenous Australians and the NDIS
The following figure summarises the key issues for Indigenous Australians and the NDIS that are raised in this report.
xi The higher rates of intellectual disability, the complex nature of Indigenous disability and the prevalence of dual diagnoses have two important consequences for the NDIS. First, the screening for and assessment of disability in the Indigenous population is more complex, will take additional time, and is likely to require further specialist expertise. Secondly, while seeking to address a set of specific disability related needs, the implementation of the NDIS cannot necessarily assume that adequate services are in place to meet health and other needs outside the scope of the NDIS.
The lack of confidence and the level of fear or distrust that some Indigenous people have towards services, particularly those funded or provided by government, means that it will be important to invest in community relations and building trust with the community. Taking account of these issues is important in developing appropriate
xii
mechanisms which ensure that service quality and cultural responsiveness is effectively monitored and managed.
Many communities will not have sufficient people living in the community with the skills and knowledge required for the assessment of whether an individual meets the NDIS criteria and their needs. This means either that people with a disability will need to travel to a larger town for assessment or that professionals with the necessary skills will be required to visit the communities. The medical model of outreach services consisting of hub-and-spoke regionally-located facilities or a fly-in, fly-out arrangement may be appropriate. There will also be a limited number of circumstances in which technology based models will be useful in the assessment process.
The introduction of the NDIS provides an opportunity to improve the employment prospects and the level of community infrastructure in remote and regional communities. Providing attendant care and community access does not require a high level of training. In remote communities there is a large potential workforce of capable individuals from which to draw, many of whom are already providing informal unpaid care. The workforce for the provision of attendant care and community access in these communities will therefore almost certainly derive from within the local community. However, many Indigenous people with a disability are themselves caring for one or more other persons with a disability, placing additional burdens on them.
While the focus of the NDIS is on meeting needs arising from long-term disability, and largely assumes that health care needs are being met, the relationship between the NDIS and health services in the case of Indigenous Australians is more complex. The first is the extent to which many Indigenous people with a disability also suffer from a range of often quite severe health problems with their care needs in this regard frequently having considerable gaps. The second is that the health care system in remote areas is in general far better developed than disability services. For reasons of scale, including accessing expensive and limited infrastructure in many communities, and for providing professional support and backup to service workers, the option of building disability services on the health care system is one which may need to be considered, especially where these community health services have developed strong community bonds. However, careful consideration would need to be given to the means of ensuring that the services which are provided are appropriate to the specific needs of people with a disability and are acceptable to them, that disability support does not follow a simple ‘medical model’, nor that inappropriate stress is placed on already stretched services which often cannot fully meet existing demand.
1
1.
Introduction
The Australian Government is in the process of developing a National Disability Insurance Scheme (NDIS) for Australia. The NDIS will help to cover the costs of support for people with significant and permanent disabilities. The NDIS will commence in mid-2013 in a limited number of launch sites in order to test the operation of the scheme and to allow for the design of the NDIS to be informed by feedback from people with a disability, their families and carers, service providers and community organisations.1
The best available data suggests that the Indigenous population experiences profound or severe core activity limitations at more than double the rate of non-Indigenous Australians. These higher rates of disability mean that the NDIS is likely to be of significant benefit to Indigenous Australians.
Not only are rates of disability higher for Indigenous Australians, but many Indigenous people also face significant barriers to accessing disability planning and support services. In part this is due to the substantially higher proportion of the Indigenous population living in remote and very remote areas which generally lack disability services; that services are not always responsive to or compatible with the cultural values of some Indigenous people; and that Indigenous Australians disproportionately experience barriers associated with socio-economic factors such as low income and low levels of literacy and numeracy.
Addressing these barriers, and indeed the whole question of addressing Indigenous disability are further complicated by the fact that while across ‘mainstream Australia’ there has been a developing understanding of the notion of ‘disability’ and its impact on people’s lives, across Australia, and particularly in remote parts of the country, there are a number of differences in the way in which Indigenous Australians view disability. This reflects both questions of how many Indigenous people and communities view disability and the extent to which they have been participants, or more frequently non-participants, in wider community change. That there is no simple conception or cultural view of disability is an important starting point, and one which is recognised in the preamble to the United Nations Convention on the Rights of Persons with Disabilities which notes “that disability is an evolving concept” (UN 2006). Over recent years this evolution has been impacted by many factors, including the work of advocacy groups, events such as the 1981 International Year of Disabled Persons and the introduction of the Disability Discrimination Act 1992, as well as evolving community attitudes.
1
The launch sites will be South Australia (for children 0-14 years), Tasmania (young people aged 15-24 years), ACT (all age groups), Barwon region (all age groups) and the Hunter region (all age groups).
2
According to the First Peoples Disability Network (2011), many Indigenous people with disabilities do not identify as having a disability. This may be due in part to a reluctance to adopt additional labels of disadvantage, as well as a markedly different cultural perception of disability.
The terms of reference for the project outline two distinct but related pieces of work. The first part of the project aims to identify and assess the range of disability service delivery models available in order to overcome the barriers to accessing disability support services experienced by Indigenous Australians. The second part analyses existing quantitative data sets to ascertain the extent and nature of disability in the Indigenous population, and how the nature and extent of disability varies according to geographic remoteness and key population groups. The work is intended to inform future policy development of a national scheme, and thereby assist Indigenous Australians in accessing support services appropriate to their cultural and geographic needs; sharing in opportunities available to the general Australian population; and participating fully in the economic and social life of their community.
The paper is in three parts. Part I provides background and contextual information which is relevant to the disability service needs of the Indigenous population and how the NDIS can best meet the needs of Indigenous Australians. Part II considers the existing statistical evidence regarding the extent and nature of disability in the Indigenous population, the data gaps and how these gaps can best be filled. Part III of the report focuses on issues concerning the delivery to Indigenous Australians of disability services as part of the NDIS. Some possible models and approaches to service delivery are discussed and, drawing upon the available evidence base, the advantages and disadvantages of different models are outlined. The final section integrates the conclusions drawn from each section and offers recommendations.
3
Part I—Background
2.
Overview of the NDIS
This section provides a brief overview of the history and proposed design of the NDIS. While the details of how the NDIS will operate are currently being developed, the Terms of Reference which inform this paper follow the design proposed by the Productivity Commission. 2
2.1 Brief history of the development of the NDIS
In April 2008, the then Parliamentary Secretary for Disabilities and Children’s Services, Bill Shorten, established the Disability Investment Group (DIG). The Group’s role was to explore innovative funding ideas from the private sector that would help people with disabilities and their families’ access to increased current support and life-long security.
The possible model proposed by the DIG was a National Disability Insurance Scheme (NDIS) that would fund individuals based on their needs, replacing the current system of capped programs and services. It was proposed that the scheme be funded from general revenue or a levy similar to the funding arrangements for Medicare. The first recommendation from the DIG (2009: 6) was that ‘the Commonwealth Government, in consultation with States and Territories, immediately commission a comprehensive feasibility study into a National Disability Insurance Scheme (NDIS).’
In early 2010, the Productivity Commission was asked by the Australian Government to inquire into the feasibility and structure of a cost-effective ‘National Disability Long-term Care and Support Scheme.’ The Terms of Reference for the Productivity Commission inquiry ask that the Productivity Commission consider an approach that:
provides long-term essential care and support for eligible people with a severe or profound disability, on an entitlement basis and taking into account the desired outcomes for each person over a lifetime;
is intended to cover people with disability not acquired as part of the natural process of ageing;
calculates and manages the costs of long-term care and support for people with severe and profound disability;
2
There have been further developments of the NDIS since the work for this paper was undertaken. Most importantly, the way in which the scheme is intended to operate in the NDIS launch sites is described in the draft National Disability Insurance Scheme (NDIS) Bill introduced into Parliament on Thursday November 29th.
4
replaces the existing system of funding for the eligible population;
ensures a range of support options is available, including individualised approaches;
comprises a coordinated package of care services which could include accommodation support, aids and equipment, respite, transport, and a range of community participation and day programs available for a person's lifetime;
assists the person with disability to make decisions about their support; and
offers support for people to participate in employment where possible.
The Productivity Commission identified four key issues with regards to the system of disability services operating in Australia at the time of its report:
First, it argued that the disability system is significantly underfunded and that as a consequence individuals with a disability who are in need of a particular service or support, (e.g., wheelchairs), are either unable to obtain the service they need or are subject to excessive waiting periods due to what is termed the rationing of services.
Second, there is uncertainty in how services are allocated, which can make it very difficult for people with a disability or their carers to effect long-term planning decisions. Part of this uncertainty is due to a lack of integration across agencies and jurisdictions.
Third, differences between states and territories in the nature, timing and coverage of services provided mean that when individuals cross state/territory borders the services they are entitled to receive may change.
Fourth, people with a disability and their carers lack choice or control over the services they receive.
It is argued by the Productivity Commission that although a significant injection of funds would alleviate rationing and supply issues, the three factors of uncertainty, lack of consistency across states, and lack of choice would cause significant limitations to persist.
For this reason the Productivity Commission proposed a new NDIS which would not only substantially increase the level of funding for disability services, but would also combine the funding under a single, national framework. While this framework would be consistent across jurisdictions, the aim would be to provide much greater choice and control at the individual level. The scheme would be established alongside a new, no-fault National Injury Insurance Scheme (NIIS), which would cover individuals who acquire a disability through catastrophic injury.
In the 2012–13 Federal budget $1 billion was set aside for the development of the first stage of an NDIS. The NDIS launch will take place in mid-2013, with services provided to around 10,000 people with significant and permanent disabilities in select
5 locations across the country. The draft Bill for the NDIS launch has been introduced into Parliament.
As noted above, the Terms of Reference for this project are that the Productivity Commission-proposed design of the NDIS be used as the starting point for this report. Key aspects of the Productivity Commission’s proposed design are summarised in the remainder of this section.
2.2 Overview and key characteristics of the NDIS—eligibility and assessment
The Productivity Commission proposal is for a system comprising three tiers of beneficiaries. The first tier of beneficiaries covers all Australians, including those without a disability or who are not carers. The NDIS is designed to provide reassurance for all Australians that in the event of themselves or someone they care for acquiring a significant or permanent disability they will be able at obtain assistance under the NDIS if they are not covered by another scheme such as workers compensation or motor vehicle accident compensation.
The second tier of beneficiaries are all those with a disability or who are carers, but who do not receive financial support under the NDIS. The Productivity Commission estimates that this includes approximately four million Australians and, in addition, 800,000 carers (Productivity Commission, 2011: 15). This second tier of recipients would receive information and referral services, and general information regarding the most effective care and support services for their particular needs.
The third tier of beneficiaries consists of people with significant care and support needs due to a permanent disability and who would receive financial support from the NDIS. Permanent disabilities include episodic and chronic disabilities. Also covered would be those with significant and enduring psychiatric disability. This tier would not include people covered by other schemes, but may include: those acquiring new catastrophic injuries who are covered by the NIIS; those with certain health conditions for which the publicly funded healthcare system is better suited; and those acquiring a disability after commencement of the age pension.
The two main groups within the Tier 3 group are people with ‘significantly reduced functioning in self-care, communication, mobility or self-management’ who ‘require significant ongoing support’, and people who fall within an ‘early intervention group’ (Productivity Commission, 2011: 14). It is estimated that the former comprises roughly 330,000 individuals, whereas the latter totals 80,000 people, for whom ‘intervention would be safe, significantly improve outcomes and would be cost-effective.’ It is also pointed out by the Productivity Commission that ‘eligibility would be determined by functional limitations, not conditions.’
6
This focus on need as opposed to disabling conditions adds a significant degree of complexity to assessing eligibility. The proposed screening mechanism is that at the first stage when individuals approach the newly created agency responsible for the scheme they will be administered a short assessment module designed to identify whether they are likely to be eligible for a funded package. Those assessed as ineligible will then fall into Tier 2 of the scheme and, if necessary, be directed towards appropriate services not funded by the NDIS.
For those who are assessed as likely to be eligible a more detailed assessment process will then be triggered. As summarised in Productivity Commission (2011: 336), this includes the completion of a more detailed self-reported questionnaire; review by a trained assessor, including review of medical certificates; a meeting between this assessor and a local area coordinator; and a review and costing of the assessment by the National Disability Insurance Agency (NDIA). While the assessment process is expected to be resource intensive, it is necessary in order to implement targeted and limited eligibility criteria.
This strict distinction between Tier 2 individuals—who receive minimal funding— and Tier 3 individuals—who receive an extensive range of support as documented below—places pressure on the operation of the assessment mechanism, a crucial aspect of the scheme.
Once assessed as being in Tier 3, a draft support package will be developed that is either accepted by the relevant person or their carer/family member, or sent for further review.
2.3 Overview and key characteristics of the NDIS—Type and method of support
Type of support provided
The Productivity Commission Report proposes that the following types of support be provided to people with a significant and permanent disability who are covered by the NDIS (Productivity Commission, 2011; Box 2: 23):
Aids and appliances, as well as home and vehicle modifications;
Personal care that supports an individual to take care of themselves in their home and community;
Community access supports. These are designed to provide opportunities for people to enjoy their full potential for social independence, and include facility and home-based activities, as well as supervision and physical care;
Respite to provide a short-term and time-limited break for people with disabilities, families and other voluntary carers of people with a disability;
7
Specialist accommodation support, such as group homes and alternative family placement;
Domestic assistance to enable individuals to live in the community and live on their own, such as meal preparation and other domestic tasks; banking and shopping; assistance with selecting and planning activities, and attending appointments;
Transport assistance to provide or coordinate individual or group transport services;
Supported employment services and specialist transition to work programs that prepare people for jobs;
Therapies such as occupational and physiotherapy, counselling, and specialist behavioural interventions;
Local area coordination and development. These are broad services, including individual or family-focused case management and brokerage;
Crisis/emergency support; and
Guide dogs and assistance dogs.
Methods of providing support
The Productivity Commission proposed two broad approaches to how the package of support is to be provided. The first is self-directed funding, where individuals or their carers ‘cash out their individualised package of supports and manage their own budget’ (Productivity Commission, 2011: 346). The second is through choice of provider, where individuals are given an individualised package of support items, rather than a budget, with the ability to choose the service provider from whom the items will be sourced. There is also considerable scope in the proposed model for individuals to opt for self-directed funding for some types of services, but choice of provider for other aspects.
The self-directed funding model places a greater degree of risk onto the individual. However, this comes with the potential benefit of being able to make savings in one area which will lead to scope for additional expenditure in another area. There are likely to be differences in the extent to which people are able to realise the potential efficiency gains from a self-directed funding model. For example, individuals or carers with a high level of education are more likely to be able to negotiate or obtain low-cost services. People living in highly urbanised and more socioeconomically advantaged areas are likely to have a broad range of services available to them, and will therefore benefit from the self-directed funding model. The Productivity Commission Report notes that for those in regional—and to a lesser extent, remote— areas with practical, everyday needs, it will not be difficult to find the required
8
services. However, this is less likely to be true for those with complex needs, a group into which Indigenous Australians disproportionately fall (see Part II).
There are a number of eligibility restrictions for self-directed funding proposed by the Productivity Commission. Chief among these is an assessment that the individual is able to make the complex decisions required for such an approach. Where this is not possible, there is the option of guardians, including parents or partners, acting as the individual’s agent. However, this not only places an additional burden on these carers—hence the voluntary nature of the self-directed funding—but also opens up the possibility of financial and other abuse. The Productivity Commission proposes a number of safeguards to mitigate these risks.
One of these safeguards or restrictions is that money from self-directed funding cannot be used to hire close family members. While it is important to minimise the risk that a close family member who is being paid to care for a person with a disability does not provide adequate care, the risk of this occurring needs to be weighed against the potential negative consequences of the restriction. In many regional and remote areas there may be few other available options than family members. Problems resulting from such a restriction are likely to be exacerbated in an Indigenous context in which kinship networks do not fit the standard model of the nuclear family. The Productivity Commission Report (2011: 382) proposes a trial for employment of family members: if undertaken such a trial is likely to provide important data. However, it proposes a number of restrictions—including a decrease of the individual budget and a six-month limitation on paying family members—that may need to be reconsidered in regional and remote areas.
2.4 Productivity Commission Report recommendations specifically related to Indigenous Australians
The Productivity Commission Report identifies a number of issues related to Indigenous Australians that need to be considered in designing and implementing the NDIS. Specifically, Chapter 11 of the Productivity Commission Report focuses on the prevalence of disability within the Indigenous community, and how a future NDIS might address a number of other issues specific to Indigenous disability.
One of the issues identified by the Productivity Commission as requiring further consideration is whether in certain circumstances Indigenous people with a disability should be able to pay family members to provide disability support services.
According to the Productivity Commission Report, the Australian government spends 30% more per capita on Indigenous Australians with disabilities than non-Indigenous Australians. However, considering the considerably higher costs of providing services in remote areas as well as the underreporting of Indigenous disability, it is likely that disadvantage in terms of access to services still exists.
9 A number of socio-economic factors are relevant to the high rate of disability observed among Indigenous Australians, and a large gap in disability rates persists between Indigenous and non-Indigenous Australians. The Productivity Commission (2011) describes this relationship as which poor socio-economic outcomes greatly increase rates of disability, which further compound socio-economic disadvantage. Greater exposure to certain risk factors such as smoking and obesity contributed almost half of the difference in disability adjusted years of life between Indigenous and non-Indigenous Australians (Productivity Commission, 2011: 539).
Compounding these higher rates of disability are barriers that may prevent Indigenous Australians from accessing necessary disability services. Mistrust of—and lack of information about—government services is one of the primary barriers identified in the report. This mistrust might stem from negative past experiences, or simply from a feeling that government services are not applicable to a given individual’s circumstances or cannot meet their needs. We will expand on these issues in a later section of this paper. However, the important point to note is that these cultural differences might be preventing some Indigenous Australians in seeking assistance from government service providers.
A further barrier to service use among Indigenous Australians with a disability is geographic; in 2006 around a quarter of Indigenous Australians were living in remote or very remote areas, while only one per cent of non-Indigenous Australians did so. Geographical remoteness not only reduces the scope of services available to Indigenous communities, but also greatly increases the cost. Scarcity and proximity were found to be a bigger problem than cultural barriers, with half of Indigenous Australians seeking health services reporting having no available service in their area, and 45% reporting distance and lack of transport as a barrier to accessing services (Productivity Commission, 2011: 548).
A complicating factor is the age distribution of the Indigenous population. According to ABS (2012a), 97% of Indigenous Australians are aged 64 years and under, compared to 86% of non-Indigenous Australians. This means that if the threshold was applied universally, Indigenous Australians would be more reliant on the NDIS as opposed to the aged care system. However, in Recommendation 3.6 of Productivity Commission (2011: 200) it is stated that ‘a younger age threshold than the Age Pension age should apply to Indigenous people given their lower life expectancy, as is recognised under existing aged care arrangements.’ However, this creates equity issues if the NDIS provides a higher level of support than the aged care system. It is important, therefore, that Indigenous Australians under the age of 65 be allowed to opt in or opt out of the NDIS (as opposed to the aged care system) based on their individual circumstances and assessment of needs.
The Productivity Commission Report recommends a lower level of NDIS funding for those aged less than 15 years compared to those aged 15 years or over. The recommendation for the lower level of funding for children is based on the
10
assumption that “that families provide most care to children between the ages of 0–14 years, regardless of disability, and that care should be provided predominantly to support parents in their role of caring for a child with a disability.” and also the assumption that the education system is responsible for providing some supports to children with a disability (Productivity Commission, 2011: 767). and/or the child’s family. However, this assumption may be problematic in an Indigenous context in which: (a) many Indigenous Australians do not participate as intensively in formal schooling, in part because of their disabilities; (b) many regional and remote schools may not be able to provide the same degree of support to students with a disability as can be provided by larger urban schools and an associated network of special schools (c) the level of income and wealth of the households in which Indigenous Australians live is substantially lower; and (d) Indigenous Australians are more likely to be cared for by non-family members. The validity of the assumptions about the need for NDIS funding for children for the Indigenous population is particularly important given that 36% of the Indigenous population is aged less than 15-years compared to 18% of the non-Indigenous population.
While the NDIS for the most part will be based on a self-directed funding model, the feasibility of this in rural and remote communities is something that cannot be assumed. In some cases it is possible that a different approach is likely to be needed in these locations, with this having particular implications for providing disability services for Indigenous Australians who disproportionately live in these locations. Block-funding services constitute one way to overcome the problem of incomplete markets for disability services in remote communities. Productivity Commission (2011) proposes a number of forms that this block-funding could take, including funding new or existing community organisations to provide services. Where such organisations are lacking, however, it might be necessary to fund larger organisations to provide managerial oversight and mentoring to build capacity over the longer term. In order to ensure services are meeting the needs of Indigenous communities, the Productivity Commission (2011) proposes a number of strategies, including embedding these services within the community, employing Indigenous staff, and providing cultural awareness training to staff. The strategies clearly pose challenges of their own, including lack of existing expertise within the community, the difficulty of recruiting Indigenous staff, and the reservations individuals might have in accepting care from outsiders when this is necessary. These problems can be mitigated by adequate language and cultural awareness training, and by allowing for increased flexibility in working conditions in order to attract Indigenous employees.
11
3.
The demographic and geographic context
This section summarises key demographic and geographic features of the Indigenous population that are of particular relevance to the design and implementation of the NDIS.
3.1 Indigenous age structure and projected growth of the Indigenous population
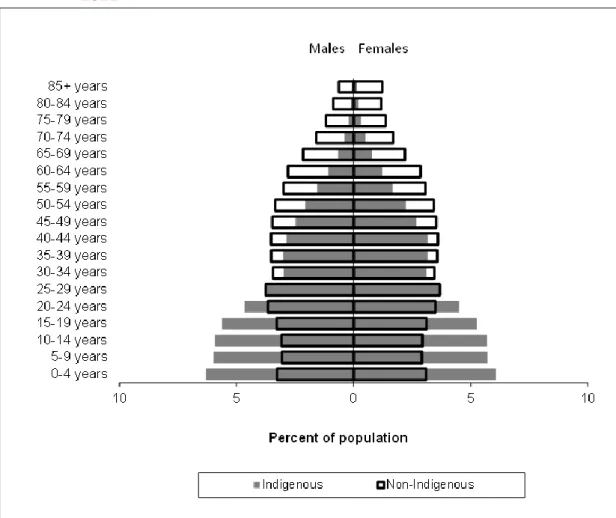
According to the preliminary 2011 Census-based population estimates, the median age of the Indigenous population is about 21 years for males and about 23 years for females. This is compared to 37 years and 39 years for non-Indigenous males and females respectively. The Indigenous population has a much younger age structure than that of the non-Indigenous population, as demonstrated in Figure 1. The figure overlays the age distribution of the Indigenous and non-Indigenous populations, according to the percentage present in each age group; the grey bars indicate the age distribution of the Indigenous population and the hollow bars the non-Indigenous population.
In comparing the two populations, it is clear that a much higher proportion of the Indigenous population is aged 24 years or less. Across males and females, these age groups represent 56% of the total Indigenous population, compared to 32% of the total non-Indigenous population. At the other end of the age distribution, 14% of the total non-Indigenous population is aged 65 years and over, compared to 3% of the Indigenous population.
12
Figure 1: Age distribution of the Indigenous and non-Indigenous population, 2011
Source: ABS (2012a), based on data from the 2011 Census.
The Indigenous population has been increasing at a faster rate than the non-Indigenous population. The preliminary population estimate for the non-Indigenous population in 2011 (ABS 2012a) was 30% higher than the 2006 population estimate. By comparison, the non-Indigenous population estimate grew by only 7.3% over the period. There are two main reasons as to why the Indigenous population has and will continue to grow at faster rate than the non-Indigenous population. First, Indigenous women have a higher fertility rate than their non-Indigenous counterparts with an Indigenous female expected to have 2.7 children over her reproductive life compared to the total female population who is expected to have 1.9 (ABS 2012c).
The second reason for higher growth rates is that, in addition to those children born to an Indigenous mother, a substantial number of Indigenous children have non-Indigenous mothers and non-Indigenous fathers. Nationally, 31% of non-Indigenous children born in 2011 had two Indigenous parents and a further 42% had an Indigenous mother and a non-Indigenous father. These births will have been captured by the Indigenous fertility rate mentioned in the previous paragraph. However, a further 27% of Indigenous children had a non-Indigenous mother and an Indigenous father. These births represent an additional contribution to the Indigenous population.
13 While it is clear that the Indigenous population will grow at a faster rate than the non-Indigenous population, it is very difficult to predict this growth accurately. For example, in using the 2006 Census, Biddle and Taylor (2009) projected that the Indigenous population would grow from just over 517,000 in 2006 to 848,000 in 2031 and that this trajectory would result in the Indigenous population being around 575,000 in 2011. However, the preliminary 2011 estimate (ABS 2012a) is that in 2011 the Indigenous population was around 670,000, approximately 17% higher than the projections of Biddle and Taylor (2009).
Although the current Indigenous population is relatively young, in part due to increasing longevity, it is likely that it will age noticeably in the future. While there is still a large gap in life expectancy between Indigenous and non-Indigenous Australians, age-specific mortality rates of the Indigenous population appear to be falling.
Figure 2 indicates the projected age distribution of the Indigenous population in 2006 and 2031, assuming convergence between Indigenous and non-Indigenous fertility and mortality rates over the period. The 2006 age distribution is shown by the grey bars and the projected age distribution in 2031 by the hollow bars. The proportion of the Indigenous population aged 0 to 24 years is projected to fall from 57% in 2006 to 46% in 2031. Correspondingly, the proportion of the population aged 50 years and over is projected to increase from 12% to 20% between 2006 and 2031.
While we do not yet have projections based on the 2011 Census, it should be noted that the fastest rate of growth in the Indigenous population between 2006 and 2011 was among those aged 50 years and over. Specifically, in comparison with 2006 estimates there were 47.6% more Indigenous Australians aged 50 years and over in 2011. The projected increase in the number of Indigenous people aged 50–64 years, the upper end of the age distribution covered by the NDIS, combined with increasing rate of disability with age (see Part II of this paper) means that the number of Indigenous Australians within scope of the scheme will increase in coming decades.
14
Figure 2: Indigenous age distribution, 2006 (estimates) and 2031 (projections)
Source: Biddle and Taylor (2009).
3.2 The geographic distribution of the Indigenous population
While the majority of the Indigenous population lives in major cities (32%), inner regional (21%) and outer regional (22%) areas, a substantial proportion live in remote (10%) and very remote areas (16%). Overall, Indigenous Australians are much more likely to live in remote parts of the country relative to the non-Indigenous population. For example, while in 2006 (the most recent year for which we have remoteness estimates), 2.5% of the total Australian population was estimated to be Indigenous, in major cities, 1.2% of the population are Indigenous. In remote areas 15% of the population are Indigenous and in very remote areas 47.5% of the population are Indigenous.
Using a region-based geography, Figure 3 shows the proportion of the total Indigenous population estimated to live in each Indigenous Region (IREG) in 2011.3 The differences between IREGs can be highlighted by comparing the central-Australian town of Apatula with Sydney. Apatula has a surface area of around 548,000 square kilometres and, in 2011, a total estimated population of 10,174. 81% of the population were Indigenous, the highest percentage outside of the Torres Strait Indigenous Region. The Sydney-Wollongong IREG has a surface area of around
3 Official Indigenous Region population estimates will not be available until late 2013. The results in Figure 3 apply the state-specific undercount (from ABS, 2012) to Indigenous Region-specific census counts. 10 5 0 5 10 0-4 years 5-9 years 10-14 years 15-19 years 20-24 years 25-29 years 30-34 years 35-39 years 40-44 years 45-49 years 50-54 years 55-59 years 60-64 years 65+ years Percent of population
2006 estimate 2031 Series B projection Indigenous males Indigenous females
15 11,500 square kilometres and an estimated population in 2011 of 4,555,865, of whom just 1.1% were Indigenous.
Clearly, Apatula is much more Indigenous in its population makeup than Sydney. However, at the time of the 2011 Census, there were estimated to be 6.2 times as many Indigenous Australians living in Sydney as there were in Apatula. Indeed, 29% of the total Indigenous population was estimated to live on the Eastern Seaboard between Sydney and Brisbane. This is 2.8 times as many as the whole of the Northern Territory (10% of the Indigenous population) and more than the combined Indigenous populations of Western Australia, South Australia and Tasmania.
What the results summarised in Figure 3 make clear is that, even if rates of Indigenous disability were much lower in major cities and regional centres compared to remote parts of the country, the sheer weight of population means that the majority of the disability services provided to the Indigenous population as part of the NDIS will need to be provided in urban centres. On the other hand, however, most of the disability services in remote parts of the country will be used by Indigenous Australians. This geographic distribution also has clear service delivery and workforce implications, as discussed in Part III of this report.
Figure 3: Geographic distribution of the Indigenous population, 2011
Source: Customised calculations using ABS (2012a) and the 2011 Census.
It is anticipated that the Indigenous population will become more urbanised over the next few decades. This is driven by two factors. First, there has been a steady
out-16
migration of the Indigenous population from remote areas to regional centres and major cities that shows no sign of abating in the future (Biddle, 2009). Secondly, while Indigenous female fertility rates tend to be evenly spread across the country, most of the births of Indigenous children to non-Indigenous mothers occur in urban parts of the country. This is mainly due to the relatively high rates of intermarriage in these areas (Heard, Birrell and Khoo, 2009).
Using data from the 2006 Census, Biddle and Taylor (2009) estimate that the Indigenous population in major cities will grow by 34% between 2006 and 2016, compared to 9% in very remote areas. While it is projected that the non-Indigenous population will increase in remote and very remote areas at a slower rate than in major cities and regional areas, the non-Indigenous population is projected to decline in remote and very remote Australia over the period 2006–2016, meaning that the proportion of the Indigenous population in these parts of the country will be higher in 2016 than it was in 2006. Early results from the 2011 Census suggest that, if anything, these trends are intensifying.
A feature of the Indigenous population in remote and very remote areas is that it is spread throughout a very large number of small, discrete, largely Indigenous communities. This means that the absolute number of people in most discrete Indigenous communities that will be covered by the NDIS is quite low.
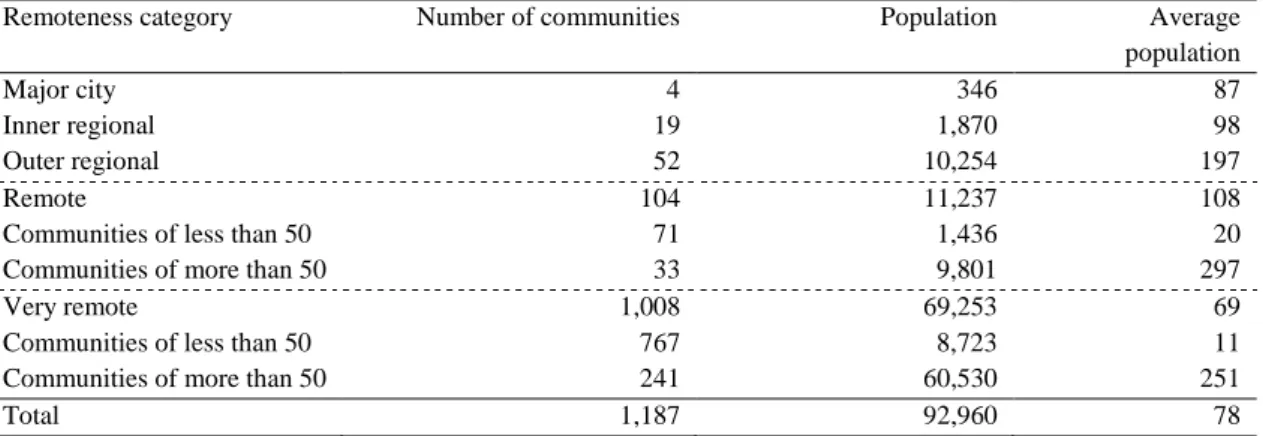
Analysis of the ABS Housing and Infrastructure in Aboriginal and Torres Strait Islander Communities Survey 2006 by the Australian National Audit Office (ANAO) provides useful information on the number of discreet Indigenous communities, the population in these communities, and the average population of the communities according to geographic remoteness. Overall, 20 per cent of the 2006 Indigenous population lived in these identifiable discrete communities, mostly in non-urban locations. This information is reproduced in Table 1.
Table 1: Number of discrete Indigenous communities and population by remoteness area, 2006
Remoteness category Number of communities Population Average
population
Major city 4 346 87
Inner regional 19 1,870 98
Outer regional 52 10,254 197
Remote 104 11,237 108
Communities of less than 50 71 1,436 20
Communities of more than 50 33 9,801 297
Very remote 1,008 69,253 69
Communities of less than 50 767 8,723 11
Communities of more than 50 241 60,530 251
Total 1,187 92,960 78
Source: Derived from ANAO (2012), Table 1.3.
This data, as shown in Table 1 highlights the large number of small Indigenous communities which exist in remote and very remote Australia. The first is that there
17 were 1,187 discrete Indigenous communities in 2006 in which 92,960 Indigenous people were counted (20% of the Indigenous population). The average population of these communities was 78. The vast majority of the discrete communities are in very remote areas (1,008), with an additional 104 such communities in remote areas. Of the 1,008 discrete communities in very remote areas, 767 have less than 50 people living in them, and 241 have a population of 50 or more. The communities in very remote areas with a population of less than 50 people have a total population of 8,723 and an average population of just 11. The communities with a population of greater than 50 have a total population of 60,530 and an average population of 251.
18
4.
Indigenous notions of and approaches to
disability
4.1 Disability, health and community participation
As with non-Indigenous Australians, the lived experience of Indigenous people with disabilities is complex and personal. Further, as discussed previously, the cultural concept of disability is one which continues to evolve. This complexity is further nuanced by the diversity of cultures and traditions among Indigenous Australian communities. However, there are particular cultural and historical factors that play an important role in how Indigenous Australians approach disability as a concept, and how it is experienced by the individual and by the community.
It has often been observed that there is no word for disability in many Indigenous languages. Ariotti (1999) notes that the Pitjantjatjara language has no single word that captures the idea of disability; instead, specific words are used for particular ailments, such as kuru pati (blind), pina pati (deaf), witapitjara (to have back pain) or lurpani (to hobble around) (Ariotti 1999: 218). The lack of an abstract concept of disability goes beyond language, as found by King (2010) in her interviews of Indigenous users of a respite centre in Brisbane. Despite being regular users of disability services, and requiring assistance with a range of day-to-day tasks, the women she interviewed simply did not identify themselves or the people around them as having a disability. When asked if they could remember people from their communities with a disability, few could recall any such individuals. Furthermore, even when disability is recognised, it is mostly not considered a salient issue when compared with problems such as unemployment, poverty, discrimination and chronic disease. A further factor is that the higher rate of disability in the Indigenous population may “normalise” perceptions of disability.
In order to understand how disability is conceptualised by Indigenous Australians today, it is important to understand both the history of disability in Indigenous Australia, and more generally the history of Indigenous people in their interface with other elements of Australian society and in particular their relationship with government and welfare services, including the extent to which the Indigenous community has had voice in the wider conceptualistion of disability within Australian society.
One attempt to do this has been by Ariotti (1999) who describes three broad phases in this history: impairment; oppression; and empowerment. In the impairment phase, ‘[d]isability did not exist’ (Ariotti 1999: 217). This is not to say that no members of the Indigenous population had physical or mental impairments; rather, there was no concept of disability that separated those individuals from the rest of their community.