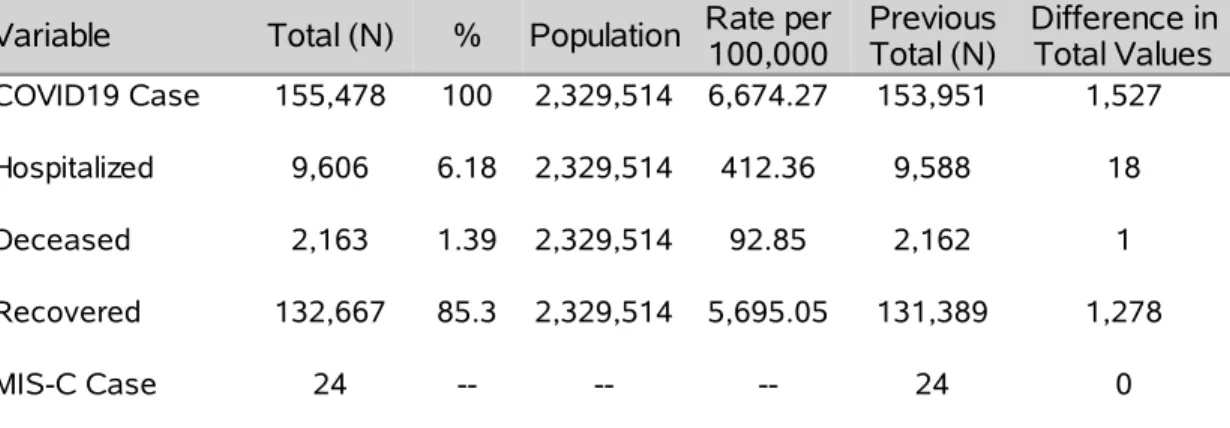
Table 1: COVID19 Cases, Hospitalizations, Deaths, and Recovered
Variable Total (N) % Population Rate per100,000 PreviousTotal (N) Difference inTotal Values
COVID19 Case 155,478 100 2,329,514 6,674.27 153,951 1,527 Hospitalized 9,606 6.18 2,329,514 412.36 9,588 18
Deceased 2,163 1.39 2,329,514 92.85 2,162 1
Recovered 132,667 85.3 2,329,514 5,695.05 131,389 1,278
MIS-C Case 24 -- -- -- 24 0
Note1: Recovered Criteria: A case must be alive, not currently hospitalized (or at least 7 days past the hospital discharge date), have completed quarantine or isolation, and/or be 14 days past event onset date.
Note2: Population data source for calculating rate estimates: 2019 ASRHO Estimates and Projections Summary for 2020, Office of the State Demographer for Nevada.
Note3: Previous Total includes the total values (n) reported by the aggregate daily report from the previous day. Note4: MIS-C is COVID19-Associated Multisystem Inflammatory Syndrome in Children.
Reporting through 20DEC2020
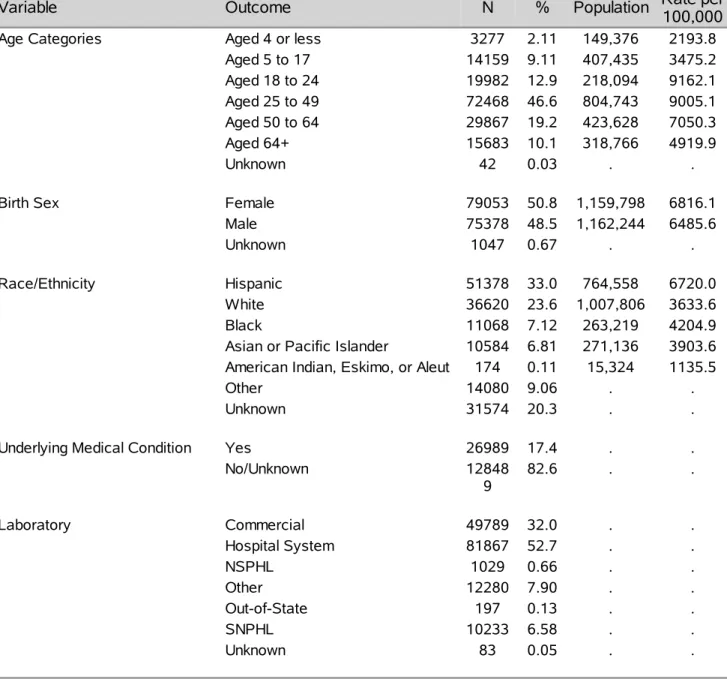
Investigations are ongoing; data are subject to change. Table 2: COVID19 Cases
Variable Outcome N % Population Rate per100,000
Age Categories Aged 4 or less 3277 2.11 149,376 2193.8
Aged 5 to 17 14159 9.11 407,435 3475.2 Aged 18 to 24 19982 12.9 218,094 9162.1 Aged 25 to 49 72468 46.6 804,743 9005.1 Aged 50 to 64 29867 19.2 423,628 7050.3 Aged 64+ 15683 10.1 318,766 4919.9 Unknown 42 0.03 . .
Birth Sex Female 79053 50.8 1,159,798 6816.1
Male 75378 48.5 1,162,244 6485.6
Unknown 1047 0.67 . .
Race/Ethnicity Hispanic 51378 33.0 764,558 6720.0
White 36620 23.6 1,007,806 3633.6
Black 11068 7.12 263,219 4204.9
Asian or Pacific Islander 10584 6.81 271,136 3903.6 American Indian, Eskimo, or Aleut 174 0.11 15,324 1135.5
Other 14080 9.06 . .
Unknown 31574 20.3 . .
Underlying Medical Condition Yes 26989 17.4 . .
No/Unknown 12848 9 82.6 . . Laboratory Commercial 49789 32.0 . . Hospital System 81867 52.7 . . NSPHL 1029 0.66 . . Other 12280 7.90 . . Out-of-State 197 0.13 . . SNPHL 10233 6.58 . . Unknown 83 0.05 . .
Note1: Breakdown of Race is exlusively non-Hispanic.
Note2: Underlying Medical Condition is any identified health condition.
Note3: Population data source for calculating rate estimates: 2019 ASRHO Estimates and Projections Summary for 2020, Office of the State Demographer for Nevada.
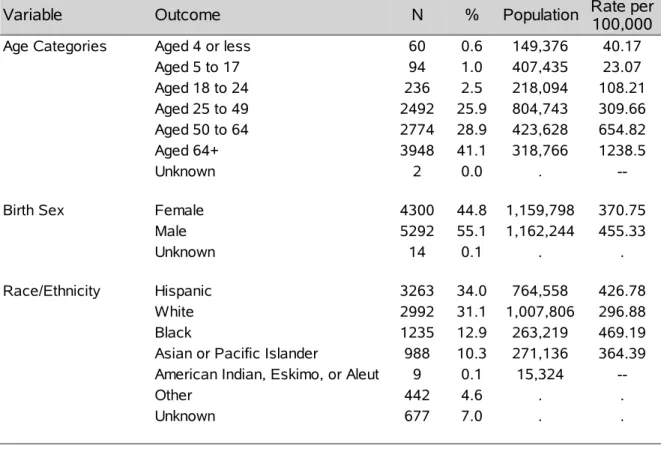
Table 3: COVID19 Hospitalizations - General Characteristics
Variable Outcome N % Population Rate per100,000
Age Categories Aged 4 or less 60 0.6 149,376 40.17
Aged 5 to 17 94 1.0 407,435 23.07 Aged 18 to 24 236 2.5 218,094 108.21 Aged 25 to 49 2492 25.9 804,743 309.66 Aged 50 to 64 2774 28.9 423,628 654.82 Aged 64+ 3948 41.1 318,766 1238.5 Unknown 2 0.0 .
--Birth Sex Female 4300 44.8 1,159,798 370.75
Male 5292 55.1 1,162,244 455.33
Unknown 14 0.1 . .
Race/Ethnicity Hispanic 3263 34.0 764,558 426.78
White 2992 31.1 1,007,806 296.88
Black 1235 12.9 263,219 469.19
Asian or Pacific Islander 988 10.3 271,136 364.39 American Indian, Eskimo, or Aleut 9 0.1 15,324
--Other 442 4.6 . .
Unknown 677 7.0 . .
Note1: Breakdown of Race is exlusively non-Hispanic.
Note2: Population data source for calculating rate estimates: 2019 ASRHO Estimates and Projections Summary for 2020, Office of the State Demographer for Nevada.
Reporting through 20DEC2020
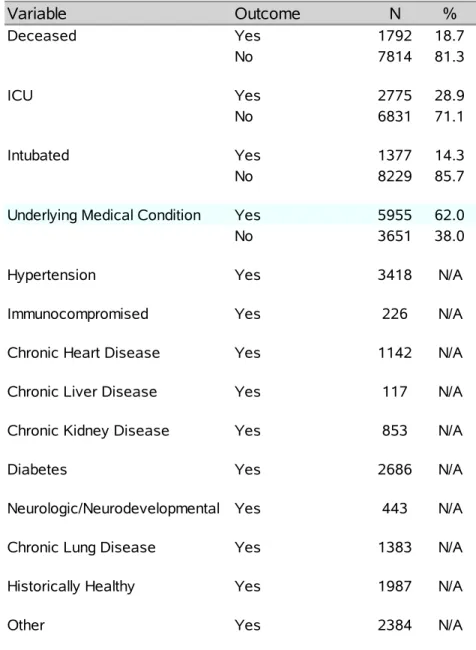
Investigations are ongoing; data are subject to change. Table 4: COVID19 Hospitalizations - Morbidity
Variable Outcome N % Deceased Yes 1792 18.7 No 7814 81.3 ICU Yes 2775 28.9 No 6831 71.1 Intubated Yes 1377 14.3 No 8229 85.7
Underlying Medical Condition Yes 5955 62.0
No 3651 38.0
Hypertension Yes 3418 N/A
Immunocompromised Yes 226 N/A
Chronic Heart Disease Yes 1142 N/A
Chronic Liver Disease Yes 117 N/A
Chronic Kidney Disease Yes 853 N/A
Diabetes Yes 2686 N/A
Neurologic/Neurodevelopmental Yes 443 N/A
Chronic Lung Disease Yes 1383 N/A
Historically Healthy Yes 1987 N/A
Other Yes 2384 N/A
Note1: Underlying Medical Condition is any identified health condition.
Note2: The breakdown of health conditions are not mutually exlusive (i.e., a person can have more than one risk factor).
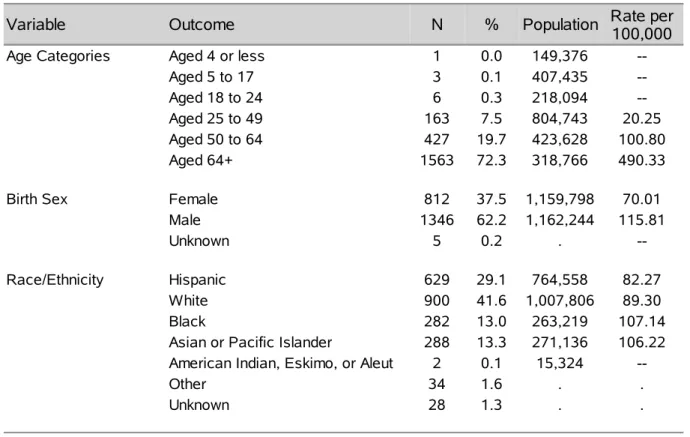
Table 5: COVID19 Deaths - General Characteristics
Variable Outcome N % Population Rate per100,000
Age Categories Aged 4 or less 1 0.0 149,376
--Aged 5 to 17 3 0.1 407,435
--Aged 18 to 24 6 0.3 218,094
--Aged 25 to 49 163 7.5 804,743 20.25
Aged 50 to 64 427 19.7 423,628 100.80
Aged 64+ 1563 72.3 318,766 490.33
Birth Sex Female 812 37.5 1,159,798 70.01
Male 1346 62.2 1,162,244 115.81
Unknown 5 0.2 .
--Race/Ethnicity Hispanic 629 29.1 764,558 82.27
White 900 41.6 1,007,806 89.30
Black 282 13.0 263,219 107.14
Asian or Pacific Islander 288 13.3 271,136 106.22 American Indian, Eskimo, or Aleut 2 0.1 15,324
--Other 34 1.6 . .
Unknown 28 1.3 . .
Note1: Breakdown of Race is exlusively non-Hispanic.
Note2: Population data source for calculating rate estimates: 2019 ASRHO Estimates and Projections Summary for 2020, Office of the State Demographer for Nevada.
Reporting through 20DEC2020
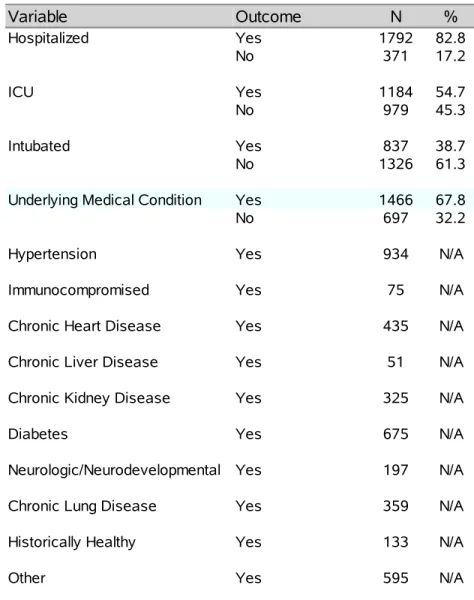
Investigations are ongoing; data are subject to change. Table 6: COVID19 Deaths - Morbidity
Variable Outcome N % Hospitalized Yes 1792 82.8 No 371 17.2 ICU Yes 1184 54.7 No 979 45.3 Intubated Yes 837 38.7 No 1326 61.3
Underlying Medical Condition Yes 1466 67.8
No 697 32.2
Hypertension Yes 934 N/A
Immunocompromised Yes 75 N/A
Chronic Heart Disease Yes 435 N/A
Chronic Liver Disease Yes 51 N/A
Chronic Kidney Disease Yes 325 N/A
Diabetes Yes 675 N/A
Neurologic/Neurodevelopmental Yes 197 N/A
Chronic Lung Disease Yes 359 N/A
Historically Healthy Yes 133 N/A
Other Yes 595 N/A
Note1: Underlying Medical Condition is any identified health condition.
Note2: The breakdown of health conditions are not mutually exlusive (i.e., a person can have more than one risk factor).