WHY TEENS
TAKE RISKS
...
A Neurocognitive Analysis of Developmental Changes and
Individual Differences in Decision-Making
ISBN 978-90-9024953-7 © 2009 Linda van Leijenhorst All rights reserved
WHY TEENS
TAKE RISKS
...
A Neurocognitive Analysis of Developmental Changes and
Individual Differences in Decision-Making
under Risk.
PROEFSCHRIFT
ter verkrijging van
de graad van Doctor aan de Universiteit Leiden,
op gezag van Rector Magnificus prof. mr. P. F. van der Heijden, volgens besluit van het College voor Promoties
te verdedigen op dinsdag 19 januari 2010 klokke 15.00 uur
door
Linda van Leijenhorst geboren te Middelburg
PROMOTIECOMMISSIE
PROMOTOREN Prof. Dr. E. A. Crone Prof. Dr. P. M. Westenberg
OVERIGE LEDEN
Prof. Dr. H. Bekkering (Radboud Universiteit Nijmegen) Prof. Dr. J. Jolles (Vrije Universiteit)
Contents
Chapter 1 General introduction 7
Chapter 2 Neural correlates of developmental differences in risk estimation and feedback processing 19
Chapter 3 What motivates the adolescent? Brain regions mediating reward sensitivity in adolescence 45
Chapter 4 A developmental study of risky decisions on the Cake Gambling Task; Age and gender analyses
of probability estimation and reward evaluation 69
Chapter 5 A heart rate analysis of risky decision-making, reward sensitivity and outcome monitoring in adolescence 89
Chapter 6 Adolescent risky decision-making: neurocognitive development of affective and control regions 113
Chapter 7 Developmental trends for object and spatial working memory: A psychophysiological analysis 147
Chapter 8 Summary and conclusions 175
Summary in Dutch 185
References 199
Propositions 223
! Curriculum Vitae ! ! ! ! 225
1.
General introduction
1.1 The scope of this thesis
importance of understanding the developmental changes that characterize adolescent risky behavior.
Even though the development of risk-taking behavior has been studied from different perspectives, and using different methods (for an extensive review see Boyer, 2006), the stereotypical adolescent risky behavior has been difficult to capture in experiments. The development of non invasive neuroimaging techniques such as Magnetic Resonance Imaging (MRI) and functional MRI (fMRI) have enabled us to study structural and functional brain maturation in children, adolescents and adults in vivo. These techniques have transformed both our understanding of the neurological changes that occur during adolescence and the way in which we think about adolescent development. Neuroimaging data can reveal age related changes in brain function, which are not always apparent based on behavioral measures. When combined with behavioral experiments, the ability of these imaging techniques to increase our understanding of the development of risk-taking behavior is promising. However, because this approach is new, many questions still need to be answered. In addition to behavioral measures (accuracy, choice and reaction time data), we used measures of heart rate changes and fMRI to gain insight into the development of the neural correlates of decision-making during development. In the absence of differences in behavior, these measures can reveal age related differences in the processes that underlie this behavior. The remainder of this chapter will give a short overview of the theoretical background of the studies that are presented in this thesis.
1.2 Imaging the developing brain
a peak at the beginning of adolescence; from this point on the amount of gray matter will decrease. The adolescent brain begins to change, neurons and connections that are not necessary disappear, and important connections are strengthened, allowing the brain to function more efficiently. In contrast, the volume of white matter, which is made up of myelin that supports communications between neurons, shows a linear increase which continues into adulthood (Giedd et al., 1999). Importantly, the rate at which the brain matures differs between brain regions (Shaw et al., 2008). Regions in the prefrontal cortex (PFC) and parietal cortex are among the last regions in which gray matter volume reaches its peak. These regions continue to change throughout adolescence, which is much later than was previously thought (Caseyet al., 2005; Gogtay et al., 2004; Sowell et al., 2004).
insight into developmental changes in cognitive processes that underlie age related changes in behavior. Even when participants from different age groups show similar behavior, the patterns of brain activation associated with this behavior can differ. Because of this, fMRI holds the potential to reveal differences between children, adolescents and adults in experimental tasks of decision-making in the absence of behavioral differences in risk-taking. Differences in brain activation patterns between children and adolescents from different ages may provide insight into the seemingly conflicting findings from observation and experimental studies on risk-taking in adolescence.
1.3 Examining decision-making development to understand risk-taking
While studies using self-report and observation methods report a peak in risk-taking and sensation seeking in adolescence (Arnett, 1996; Furby & Beyth-Marom, 1992; Steinberg, 2004; Zuckerman, 1994), studies using experiments have provided almost no evidence of this peak. In contrast, the results from these studies generally show a decrease in risk-taking from childhood to adulthood (Boyer, 2007). It has been argued that during development learning to avoid excessive risks is one of the most important skills that has to be acquired (Byrnes, 1998; Boyer, 2007; Garon & Moore, 2004; Steinberg & Scott, 2003). An influential approach to the study of human behavior in risky or uncertain situations is the study of decision-making. In this thesis, decision-making is defined as the process of choosing between competing courses of action. Often these choice alternatives are associated with possible undesirable consequences, and therefore involve risk. These undesirable consequences can range from mild (e.g. not winning 5 cents in a gambling task) to severe (being in a traffic accident). Decision-making is a complex construct and age-related changes in numerous cognitive abilities contribute to its development. This thesis will focus on the development of three abilities that are requirements for mature decision-making. First, the probabilities of positive and negative outcomes associated with a risk have to be judged.
The development of these three abilities has been studied by developmental psychologists, using different experimental paradigms. The literature on the development of the ability to judge probabilities shows mixed results. Piaget and Inhelder argued that children are unable to use probability information in their decisions until they reach the stage of formal operations around early adolescence (Piaget and Inhelder, 1975). However, the results of more recent studies suggest that well before puberty children, as young as 5 years old, have at least a basic understanding of probabilities, and can use this information when making decisions (Acredolo, O'Connor, Banks & Horobin, 1989; Schlottmann, 2001). In contrast, the ability to weigh short-term rewards against long-term rewards has been shown to improve throughout adolescence (Crone & Van der Molen, 2004; Hooper, Luciana, Conklin & Yarger, 2004) in studies in which participants were asked to complete age appropriate versions of the Iowa Gambling Task (IGT). The IGT is a widely used neuropsychological task that simulates real-life decision making in the way rewards, punishments and future consequences of decisions need to be considered. Young children’s behavior has been shown to be primarily driven by the magnitude of immediate rewards (Crone & Van der Molen, 2004). In sum, the behavioral literature to date suggests that in straightforward risky situations children as young as 5 years of age can accurately estimate risks when making decisions, but decision-making in more complex situations increases gradually during development, which suggests that mature decision-making emerges over the course of adolescence. With age, participants are more able to choose the behavior that is most advantageous in the long run and focus on their long term goals.
decisions and control impulses. As a consequence, the development of cognitive control would lead to a decrease in risk-taking with age.
1.4 The insufficient cognitive control hypothesis of adolescent risk-taking
risky behavior. However, few fMRI studies examined the role of these PFC regions in the development of risk-taking directly. The studies that did have not included children; May et al. (2004) examined the neural correlates of decision-making in a group of adolescents, and Ernst et al. (2005) and Bjork et al. (2004) compared adolescents to adults. However, these studies focused on brain regions that were implicated in the processing of rewards, not on regions associated with cognitive control. A limitation of the insufficient cognitive control account of risky behavior is that it would predict that children, who have the least mature reasoning skills and cognitive control abilities, should show
even more risk-taking behavior than adolescents. This would be in contrast to the self-report data which suggest an increase in risk-taking in adolescents compared to children. Therefore, the cognitive control hypothesis can only account for the change in behavior that occurs with the transition from adolescence to adulthood, but cannot explain why risk-taking would increase from childhood to adolescence. A second view explains adolescent risky behavior not as a consequence of the ability to control behavior, but emphasizes the increased sensation-seeking that has been reported by adolescents.
1.5 The increased arousal hypothesis of adolescent risk-taking
more sensitive to appetitive stimuli in adolescents, this would make them more sensitive to the potential benefits associated with a risk, and as a consequence, adolescents would be more willing to try something new, and explore their environment. On the one hand, this gives them the opportunity to develop skills they need as adults (Kelley et al., 2004), but on the other hand leaves them vulnerable to risks. Because these hormonal changes are specific to adolescence, the increasing emotion and arousal hypothesis predicts a non linear pattern of risk-taking behavior, with a peak in adolescence, which is consistent with the findings from self-report and observation studies.
situation. For example, the task used by Bjork and colleagues was more difficult compared to the tasks used by May et al (2004) and Ernst et al. (2005), in that it required more cognitive control. Taken together, these findings show that we cannot explain adolescent risk-taking when we study the development of reward related brain regions, or neuroimaging results in isolation. The studies described in this chapter suggest that in order to fully understand adolescent risky behavior the development of risk estimation, reward processing, cognitive control and age related changes in brain regions associated with these functions should be studied separately, and once it is possible to investigate how these processes can be isolated, it is important to examine how they work together.
Real-world adolescent risk-taking behavior is sometimes extreme and potentially fatal, but usually more subtle. Most adolescents engage in more accepted forms of risky behavior, such as listening to loud music, wearing "extreme clothing", engaging in dangerous sports, or studying for a test at the very last minute. In addition to experiments that can capture subtle age related differences in risk-taking in the scanner, fMRI studies require testable hypotheses on the development of the neural correlates of cognitive processes that underlie the changes observed in behavioral ad self-report studies. The studies discussed in this chapter form a starting point to tackle these questions.
1.6 Outline of this thesis and publications
and young adults (10-12, 14-15, and 18-25 years old) were studied in response to rewards. This study examined the hypothesis that adolescence is characterised by a peak in the brain's responsiveness to rewards, and aimed to resolve conflicting findings of earlier studies.
While these first two chapters each focus on one of the processes that underlie decision-making; Chapters 4, 5 and 6 describe experiments in which these processes were combined and participants had to weigh risks against potential rewards. Chapter 4 describes a behavioral study on the development of decision-making under risk, using a modified version of the Cake Gambling Task that was introduced in Chapter 2. Children, adolescents and adults from five age groups (8-9, 11-12, 14-15, 17-18, and 25-30 years old) participated in this study, in which both the probability of winning and the size of the reward that could be gambled with were manipulated. The results from this study motivated the experiments described in Chapter 5 and 6, in which we examine the relative contributions of reward sensitivity and cognitive control to decision-making under risk. In the study described in Chapter 5 we used behavioral and psychophysiological measures to test the hypothesis that adolescent decision-making is biased towards taking risks because of an increased sensitivity to possible rewards paired with immature cognitive control. Adolescent participants from three age groups (11-12, 14-15, and 17-18 years-old) were included, and the Cake Gambling task was modified to enable us to measure heart rate changes. In addition, we introduced monetary rewards. Chapter 6 describes the third developmental fMRI study in which we directly test the hypothesis that brain regions associated with reward processing and cognitive control follow different developmental trajectories, and underlie adolescent risk-taking. Children, adolescents and young adults from 4 age groups (8-10, 12-14, 16-17 and 19-26 years old) gambled for monetary reward in an adapted version of the Cake Gambling Task. In addition, this study examined the relation between brain activation patterns and individual differences in risk-taking behavior.
The final empirical chapterdoes not focus on decision-making directly.
cognitive processes. Finally in Chapter 8 the findings described in the empirical chapters are summarized and discussed.
All empirical chapters that this thesis consists of have been published in, or submitted to peer reviewed journals, to acknowledge the contributions of the co-authors the full references to these papers are presented below:
Van Leijenhorst, L., Crone, E. A., & Bunge, S. A. (2006). Neural correlates of developmental differences in risk anticipation and feedback processing. Neuropsychologia, 44, 2158-2170. (Chapter 2)
Van Leijenhorst, L., Zanolie, K., Van Meel, C. S., Westenberg, P. M., Rombouts, S. A. R. B. & Crone, E. A. (in press) What motivates the adolescent? Brain regions mediating reward sensitivity in adolescence. Cerebral Cortex. (Chapter 3)
Van Leijenhorst, L., Westenberg, P. M. & Crone, E. A. (2008) A developmental study of risky decisions on the Cake Gambling Task; Age and gender analyses of probability estimation and reward evaluation. Developmental Neuropsychology, 33,
179-196. (Chapter 4)
Van Leijenhorst, L., Westenberg, P. M., Crone, E. A. (manuscript in revision) A heart rate analysis of risky decision-making, reward sensitivity and outcome monitoring in adolescence. (Chapter 5)
Van Leijenhorst, L., Gunther Moor, B., Op de Macks, Z. A., Rombouts, S. A. R. B., Westenberg, P. M., & Crone, E. A. (manuscript in revision) Adolescent risky decision-making: neurocognitive development of affective and control regions. (Chapter 6)
Van Leijenhorst, L., Crone, E. A. & Van der Molen, M. W. (2007). Developmental changes in object and spatial working memory: A psychophysiological analysis. Child Development, 78,
987-1000. (Chapter 7)
Chapters 1 & 8 are based on a book chapter and paper (in Dutch) that were published as:
Van Leijenhorst, L. & Crone, E. A. (2009). Paradoxes in adolescent risk-taking. In: Zelazo, P. D, Chandler, M. & Crone, E. A. (Eds). Developmental Social Cognitive Neuroscience. Oxford University Press.
2.
Neural correlates of developmental
differences in risk estimation and
feedback processing
.2.1 Introduction
Decision-making, which involves the ability to choose between competing actions that are associated with uncertain benefits and penalties, is a key component of human cognition and behavior. Throughout childhood, we learn and develop the ability to make choices that are beneficial in the long run. The ability to make decisions that require the delay of gratification to receive a larger reward in the future begins to emerge during the pre-school period (Mischel, Shoda and Rodriguez, 1989). Interestingly, the ability to delay gratification at age four was found to be predictive of socially competent behavior in adolescence (Mischel et al., 1989). Even though four-year-olds can choose delayed over immediate rewards (e.g., Thompson, Barresi, & Moore, 1997; Prencipe & Zelazo, 2005), children show difficulties with delay of gratification that may persist into adolescence on tasks in which one must make a decision between immediate and future reward (e.g., Hooper , Luciana, Conklin & Yarger, 2004; Crone & Van der Molen, 2004; Overman, 2004). Thus, the ability to make advantageous decisions under conditions of uncertainty does not fully develop until early adulthood.
2000; Barcelo, 1999; Thomas et al., 1999; Barcelo & Knight, 2002). Thus, to learn more about the factors contributing to developmental changes in decision-making, it is necessary to examine how separable cognitive functions contribute to the complex process of decision-making.
Our understanding of the processes underlying decision-making in adults has benefited from investigations of its neural underpinnings. Brain imaging techniques are especially valuable when overt behavior is difficult to interpret, because different underlying mechanisms may contribute to observed differences in behavior (see Casey, Davidson & Rosen, 2002; Van der Molen & Molenaar, 1994). Neuroimaging studies in healthy adults and neuropsychological studies in patients with real-life decision-making problems have shown that two key components of decision making – risk estimation and processing performance feedback – are subserved by different regions within the prefrontal cortex (PFC) (e.g., Bechara, Damasio, Damasio & Anderson, 1994; Rolls, 2000; Breiter, Aharon, Kahneman, Dale & Shizgal, 2001; Knutson, Adams, Fong & Hommer, 2001; Ernst et al., 2005; Cohen, Heller & Ranganath, 2005). More specifically, these studies show that orbitofrontal cortex (OFC) and anterior cingulate cortex (ACC) are important for risk anticipation, whereas ventrolateral PFC (VLPFC) is engaged when participants receive negative performance feedback.
have been reversed (Rolls, 1999; Maia & McClelland, 2004, 2005; Fellows & Farah, 2003, 2005). Both accounts, however, suggest that OFC is important for learning to make decisions by weighing possible outcomes (risk estimation).
A number of imaging studies have implicated OFC in decision-making under conditions of uncertainty (Breiter et al., 2001; Paulus et al., 2001; Ernst et al., 2004; Cohen et al., 2005; Ursu & Carter, 2005). Some studies suggest that OFC is important for risk estimation (Cohen et al., 2005; Ursu & Carter, 2005). Additionally, some studies suggest that OFC is responsible for processing negative performance outcomes (Breiter et al., 2001; Elliott, Friston & Dolan, 2000; Kahn et al., 2002; Rogers et al., 1999). However, the anterior, ventral portion of VLPFC (BA 47), which is sometimes considered to be part of lateral OFC, is more consistently reported as being related to receiving punishment feedback (O'Doherty, Kringelbach, Rolls, Hornak & Andrews, 2001; O'Doherty, Critchley, Deichmann & Dolan, 2003; Rogers et al., 2004).
In addition to OFC, several other regions, including anterior cingulate cortex (ACC) and midbrain regions (in particular, the nucleus accumbens and ventral striatum), are reported as being important for uncertain decision-making (Galvan et al., 2005; Rodriguez, Aron & Poldrach, 2005; Cohen et al., 2005; Critchley et al., 2003; Paulus, Hozack, Frank & Braun, 2002; Rogers et al., 2004; Volz Schubotz & Von Cramon, 2003). ACC is associated with the detection of response conflict and the monitoring of performance (Carter et al., 1998; Ernst et al., 2004; Gehring & Knight, 2000; Holroyd, Nieuwenhuis, Mars & Coles, 2004; O'Doherty, Kringelbach, Rolls, Hornak & Andrews, 2001; Van Veen & Carter, 2002). Midbrain regions are thought to be associated with the prediction of errors (Rodriguez et al., 2005) or responsive to the magnitude of reward (Galvan et al., 2005).
decisions, such as when they decide to wait for future rewards (Fellows & Farah, 2005; McClure et al., 2004). The framework provided by these studies in adults allows us to investigate specific hypotheses regarding developmental changes in decision-making.
Recent advances in developmental neuroimaging have made it possible to relate changes in prefrontal activity to the development of cognitive functions. fMRI studies of cognitive control have reported activation in similar brain regions for middle-aged children and adults (eg. Bunge, Dudukovic, Thomason, Vaidya & Gabrieli, 2002a; Casey et al., 1995; Casey et al., 2000; Klingberg, Forssberg & Wessterberg, 2002; Casey et al., 2002). Interestingly, even though children show activity in similar regions, the pattern of activation often differs between children and adults, suggesting that the development of cognitive functions is related to a refinement in the organization or efficiency in the recruitment of the prefrontal cortex (Casey et al., 2002). Relative to cognitive control, decision-making has received considerably less attention in the developmental neuroimaging literature (see Happeney, Zelazo & Stuss, 2004). To date, only three studies have examined decision-making in adolescents and adults (Bjork et al., 2004; May et al., 2004; Ernst et al., 2005), and no fMRI studies have yet examined decision-making in children under the age of 12.
The present study compares the neural substrates of decision-making in 9-12 year-olds and young adults, using a children's gambling task designed to tap two important aspects of decision making: risk estimation and feedback processing. Because the current fMRI study is the first to investigate decision-making in children, we have chosen to adapt for children a paradigm designed by Critchley et al. (2001) for use in adults. The cake task allows us to examine developmental differences in subcomponents of decision-making, including risk estimation and feedback processing. The stimuli in this task resemble “wheels of fortune” that have been used in the adult neuroimaging literature (e.g., see Breiter et al., 2001; Ernst et al., 2004).
chocolate piece and eight strawberry pieces) and high-risk decisions (for example, four chocolate pieces and five strawberry pieces). Performance feedback, indicating gain or loss, follows each decision.
This study focused on the contributions of OFC, ACC, DLPFC, and the midbrain to risk estimation in children and adults, as well as the contributions of VLPFC and medial PFC to feedback processing. Such a region-of-interest (ROI) approach allowed us to examine changes across development in the relative contribution of these regions to decision-making. Additionally, we examined the extent to which children and adults rely on the same or different brain regions during risk estimation and feedback processing. We focused primarily on negative feedback, because of its importance in updating behavior, but examined the neural correlates of positive > negative feedback as well.
We had two predictions about the development of decision-making. The first prediction was that children have difficulty anticipating risks because the network relying on prefrontal cortex (DLPFC and OFC) and its connections with ACC is not fully developed yet. Such a finding would be consistent with the literature showing that children do not experience warning signals in gambling tasks in a similar way as adults do (e.g., Hooper et al., 2004; Steinberg, 2005). We expected that adults would engage OFC and ACC (e.g., Cohen et al., 2005) as well as DLPFC (McClure et al., 2004) more for high-risk than low-risk decisions. If children exhibit immature risk estimation, we would expect them to exhibit less activation of OFC (associated with affective judgements) and more ACC activation (associated with detection of response conflict), compared to adults. However, if children differ from adults in the way they make rational judgements, we would expect to see less DLPFC (control) and more ACC (conflict) activation.
positive feedback (e.g., O’Doherty et al., 2003; Holroyd et al., 2004. If children experience the negative outcomes of their decisions differently from adults, we would expect to find a different pattern of OFC, VLPFC, and medial PFC activation related to loss or punishment feedback in children compared to adults.
2.2 Method
2.2.1 Participants
Twenty-six paid volunteers participated in the study. These participants consisted of fourteen right-handed, healthy young adults (nine females; ages 18-26; mean age = 21.5, SD = 2.2) from the University of Davis and twelve right-handed, healthy children (seven females; ages 9-12; mean age = 11. 3, SD = 0.9). The primary caregiver of each child gave informed consent. Participants’ consent was obtained according to the declaration of Helsinki (BMJ 1991; 302: 1194), and the study was approved by the Internal Review Board at the University of California at Davis.
2.2.2 Task
middle and index fingers of their left hand to respond. The valence of the feedback participants received always was the consequence of the combination of the computer’s random choice for either strawberry or chocolate and the subject’s decision. If these two matched, subjects received positive feedback (gained one point), if they didn’t match, subjects received negative feedback (lost one point).
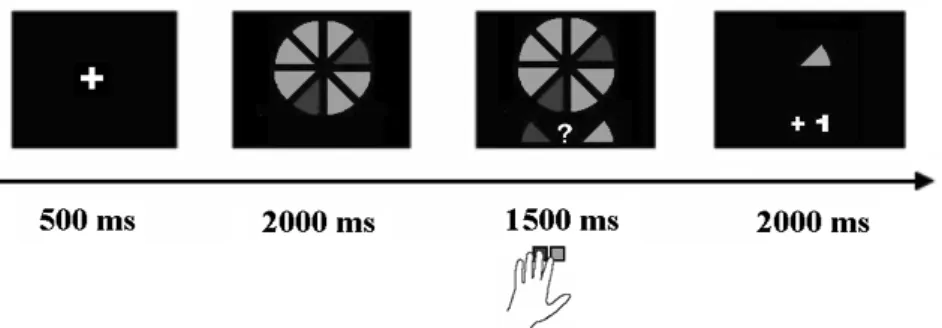
Figure 2.1 Task example of a low-risk trial. Participants viewed the cake for
2000 ms, followed by the cue and target. Participants had 1500 milliseconds to give a response, after which gain or loss feedback was presented for 2000 ms, along with the choice of the computer. Gain was indicated by +1 and loss was indicated by -1.
2.2.3 Data acquisition
Over the course of three event-related scans, participants performed a total of 162 experimental trials, in which high-risk and low-risk trials were intermixed. The visual stimuli were projected onto a screen that participants could see via a mirror attached to the head coil. During each scan, subjects performed 27 trials for each risk condition (54 trials total). Across the two scans, there were equal numbers of trials of each type requiring left-button and right-button responses. The order of trial types within each scan was determined with an algorithm designed to maximize the efficiency of recovery of the BOLD response (Dale, 1999). For each condition, the order in which the stimuli were presented was pre-randomized and was the same for all participants. Periods of fixation lasting between 2 and 8 s, jittered in increments of 2 s, were interleaved with the experimental trials, as determined by the optimization program.
gap, 240 volumes per run). The first four volumes of each scan were discarded to allow for T1-equilibration effects. High-resolution T1 weighed anatomical images were collected. Head motion was restricted using a pillow and foam inserts that surrounded the head. All children were trained in a mock scanner at the UCD Imaging Research Center prior to the actual scan.
2.2.4 fMRI data analysis
Data were pre-processed using SPM2 (Wellcome Department of Cognitive Neurology, London). Images were corrected for differences in timing of slice acquisition, followed by rigid body motion correction. Structural and functional volumes were spatially normalized to T1 and EPI templates, respectively. The normalization algorithm used a 12-parameter affine transformation together with a nonlinear transformation involving cosine basis functions, and resampled the volumes to 3-mm cubic voxels. Templates were based on the MNI305 stereotaxic space (Cosoco, Kollokian, Kwan & Evans, 1997), an approximation of Talairach space (Talairach & Tourneaux, 1988). Functional volumes were spatially smoothed with an 8-mm FWHM isotropic Gaussian kernel.
t-tests on these images, treating subjects as a random effect. Task-related responses were considered significant if they consisted of at least five contiguous voxels that exceeded an uncorrected threshold of p
< .001, unless reported otherwise.
We employed a fast event-related design in the interest of keeping the study as short as possible for the children. As such, it is likely that risk estimation effects were confounded by feedback effects and vice versa. Additionally, a consequence of the way participants tend to perform the task is that negative feedback occurs more often following high risk than following low risk choices, and vice versa for positive feedback. Consequently, any effect of negative feedback could be influenced by the uncertainty associated with high risk trials. For these reasons, our analyses were performed on a selection of trials, to eliminate the effect that the stimuli may have. The comparison of high- versus low-risk decisions was based only on trials followed by positive feedback, thereby holding feedback constant. Similarly, the comparison of positive and negative feedback was based on high-risk trials only, thereby holding risk anticipation constant.
midbrain, it was not possible to create an ROI based on either a general or a specific contrast. As such, we created a 15 mm spherical ROI centered on MNI coordinates 0, -15, -9 [x, y, z], on the basis of a study by Aron et al. (2004).
For ROI analyses, effects were considered significant at an alpha of .05. Following correction for multiple comparisons across ROIs (5 in total), all critical effects – i.e., Age Group x Condition interactions, survived when the p-value was lowered to p <.01 (p = .05/5 ROIs).
2.3 Results
2.3.1 Performance
Accuracy was defined as the percentage of choices favoring the option with the greatest likelihood of reward. On average, children and adults performed accurately on ± 91 % and ± 98 % of trials, respectively. A 2 (Age Group) x 2 (high-risk vs. low-risk Condition) ANOVA resulted in a main effect of Age Group (F (1, 24) = 14.63, p < .001), showing that children made more errors than adults. There was also a main effect of Condition (F (1, 24) = 26.19, p < .001), indicating that participants made more errors on high-risk than low-risk trials. There was a marginally significant Age Group x Condition interaction (F (1, 24) = 3.63, p = .07, see Figure 2.2), indicating that children were more prone than adults to make a greater number of errors on high-risk compared to low-risk trials.
Figure 2.2 Accuracy for adults and children, for high-risk and low-risk
2.3.2 ROI analyses
Risk Estimation
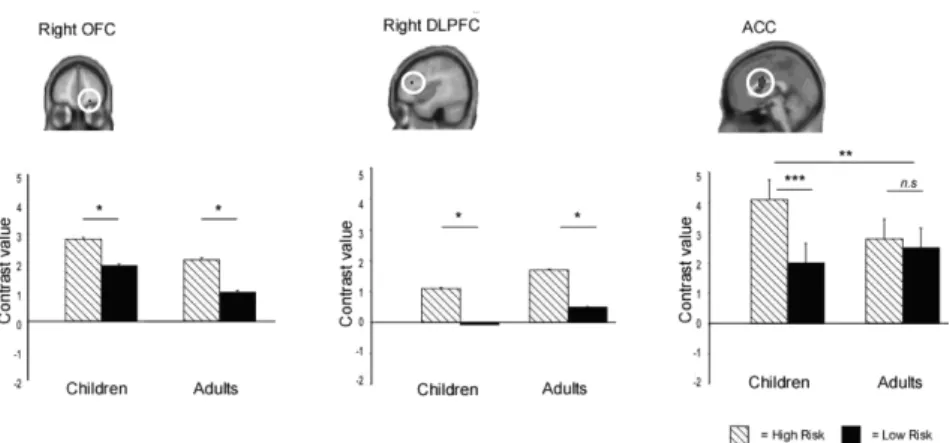
We examined the effects of risk estimation in OFC and DLPFC ROIs derived from the contrast of high-risk versus low-risk in adults. Because these ROIs were defined on the basis of the fact that they were modulated by risk estimation in adults, our analyses focused on whether a similar modulation was also observed in children (Figure 2.3). Both ROI analyses revealed a main effect of Condition, showing that activation was higher in DLPFC (F (1, 24) = 7.80, p < .01), and OFC (F
(1, 24) = 5.81, p < .05) for high-risk compared to low-risk trials, but there were no interactions with Age Group (both F’s < 1). The absence of interactions with Age Group suggests that children did not differ from adults in terms of DLPFC or OFC activation on high-risk compared to low-risk trials.
Figure 2.3 Activation profiles for ROIs derived from high-risk vs. low-risk
contrast. The contrast for OFC (22, 50, -14 [x, y, z]) and DLPFC (42, 30, 18 [x, y, z]) was based on a high-risk > low-risk contrast in adults, and the contrast for ACC (0, 6, 20 [x, y, z]) was based on an F-contrast based on all participants.
hoc comparisons for separate age groups showed that children activated medial PFC/ACC more for high-risk than for low-risk trials (F (1, 11) = 10.51, p < .001), whereas this difference was absent in adults (F (1, 13) = 2.58, p = .13). Thus, children showed greater modulation with respect to risk estimation in medial PFC/ACC than adults, but no age differences were observed in OFC or DLPFC. Finally, an analysis for midbrain was performed for the spherical ROI based on Aron et al. (2004). This region was not influenced by the task manipulations, all p’s > .10.
Feedback
We performed ROI analyses on medial PFC and right VLPFC (BA 47) regions identified from an F-contrast of negative vs. positive feedback based on all participants. The 2 (Age Group) x 2 (Condition) ANOVA for medial PFC revealed more activity in this region for negative feedback compared to positive feedback (F (1, 24) = 20.16, p < .001), but there was no interaction with Age Group (F < 1). The same ANOVA for right VLPFC also showed more activity in this region for negative feedback compared to positive feedback (F (1, 24) = 38.06, p
< .001), but again, there was no interaction with Age Group (F < 1). Thus, both children and adults recruited medial PFC and VLPFC more strongly for negative than positive feedback.
An additional ROI analysis focused on the lateral OFC ROI that was derived from the contrast of negative versus positive feedback in children only, and the analysis tested whether this region was also active in adults. The 2 (Age Group) x 2 (Condition) ANOVA resulted in main effects of Age Group, F (1, 24) = 4.87, p < .05) and Condition (F (1, 24) = 26.00, p < .001), and an Age Group x Condition interaction (F (1, 24) = 10.15, p < .005). Post hoc comparisons revealed that both adults (F
(1, 13) = 5.95, p < .05) and children (F (1, 11) = 17.82, p < .001) engaged lateral OFC more strongly for negative compared to positive feedback, but that children showed more activation than adults for negative feedback (F (1, 25) = 5.14, p < .05), such that children showed a greater difference between negative and positive feedback than adults did (F (1, 25) = 3.39, p = .09).
feedback; therefore it is possible that activation for negative > positive feedback is actually related to the feedback being unexpected rather than negative. To examine this issue, we also analyzed positive and negative feedback trials following low-risk trials. If activation associated with negative feedback is related to the feedback being unexpected, then this activation should be larger following low-risk trials, because the probability of negative feedback is lowest in this condition. However, we found no differences in activation for positive and negative feedback trials followed by high-risk trials compared to positive and negative feedback trials followed by low-risk trials (all F’s < 1; see Figure 2.4). This result suggests that the negative feedback-related activation is in fact feedback-related to the type of feedback provided, rather than to the low frequency of this type of feedback.
Figure 2.4 Activation profiles for ROIs derived from gain vs. loss contrast. The
contrasts for VLPFC (-20, 12, -20 [x, y, z]) and medial PFC (-22, 18, 50 [x, y, z]) were based on an F-contrast based on all participants. The contrast for OFC (40, 46, -12 [x, y, z]) was based on loss > gain in children.
2.3.3 Whole-brain analysis
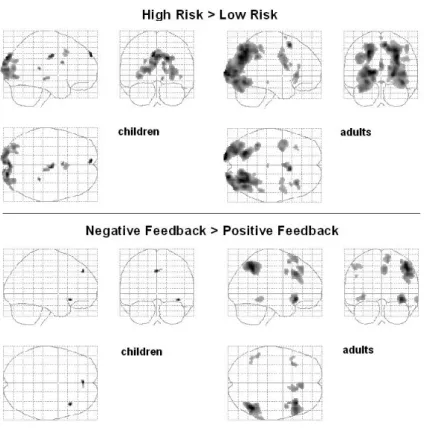
Figure 2.5 shows the glass brain images for both comparisons, and Figure 2.6 shows an overlap of the two main comparisons: high-risk > low-risk, and negative feedback > positive feedback.
Figure 2.5 Glass Brain activation profiles for the High-risk >Low-risk contrast
and negative > positive feedback contrast in children and adults.
OFC (BA 11). The reverse contrast (positive > negative feedback, Table 2.1) resulted in a network of regions, including the expected regions for reward processing: bilateral ventromedial PFC (VMPFC) and left caudate nucleus (Knutson et al., 2001; Rogers et al., 2004; O’Doherty et al., 2003). Additional activations are reported in Table 2.2.
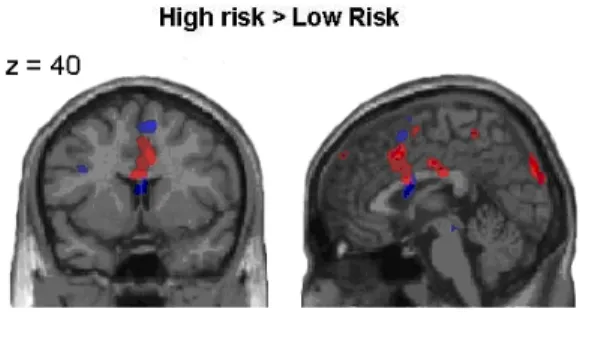
Figure 2.6 Neural correlates of risk estimation (high-risk followed by positive
feedback > low-risk followed by positive feedback), and negative feedback processing (high-risk followed by loss > high-risk followed by gain) in children and adults (p < .005). Activation for children is displayed in red, and activation for adults is displayed in blue. High-risk trials were associated with increased medial PFC/ACC activation in both children and adults. Negative feedback trials were associated with increased activation in bilateral VLPFC (BA 47), and children additionally activated right lateral OFC for negative feedback trials.
2.4 Discussion
feedback processing. ROI analyses revealed differences in the patterns of brain activation of children and adults in these regions of a priori
interest, while the whole-brain data indicate overlapping patterns of brain activation associated with risk estimation and feedback-processing for children and adults, suggesting that both age groups performed the task in a similar way. The differences are important, as they provide us with insight into the relative contributions of different brain regions to the development of decision-making abilities. For both risk anticipation and negative feedback processing, we observed greater engagement in both ACC and lateral OFC among children than in adults. These findings suggest that children use these regions less efficiently.
2.4.1 Performance
Children and adults were highly comparable in terms of performance. Importantly, the groups did not differ in performance on low-risk trials, excluding the possibility that children did not understand the task instructions. Participants from both groups tended to
choose the option that had the highest likelihood of resulting in reward; thus, few choices resulted in loss (see also Critchley et al., 2001). Both groups, however, made slightly more choices that were likely to result in loss on the high-risk trials, and there was a trend towards a disproportionately larger number of disadvantageous choices on high-risk trials for children compared to adults. These data suggest that, consistent with the literature, children were more prone than adults to take risks on high-risk trials (e.g. Ernst et al.,2005; Overman, 2004). Additionally, response selection demands may have been larger for children on high-risk than low-risk trials, because the perceptual conflict was larger (see Ridderinkhof & Van der Molen, 1995; Bunge et al., 2002a).
2.4.2 Risk estimation
Consistent with our expectations, right OFC (BA 11), bilateral ACC (BA 24/33) and right DLPFC (BA 9) were engaged more strongly when participants made high-risk relative to low-risk decisions. These
learning (Schoenbaum, Chiba & Gallagher, 2000; Rolls, 1999; see also Maia & McClelland, 2004, 2005; Fellows & Farah, 2003, 2005), and reward expectation (Tremblay & Schultz, 1999). Contrary to expectations, an ROI analysis targeting the midbrain showed that this region was not affected by the risk manipulation. Parts of the midbrain have been associated with error prediction (Rodriguez et al., 2005), and therefore it was expected to be active in the high-risk condition. However, the results showing that midbrain was not active in this task is consistent with previous studies in which this region has been shown to be sensitive to differences in reward amount (e.g., Galvan et al., 2005), whereas in this study the reward or punishment were always associated with winning or losing one credit.
In summary, children and adults exhibited similar patterns of activation in OFC and DLPFC in relation to risk estimation, but children recruited ACC more strongly for high-risk choices relative to low-risk choices than adults did. The similarities of OFC and DLPFC activation between the groups may reflect the marginal performance differences between children and adults on this simple decision-making task. It would be helpful to manipulate risk level more extensively in future studies – for example, to include trials where the chances of obtaining reward are low but the reward itself is large (e.g., Ernst et al., 2005; Rogers et al., 2004). We predict that excessive risk-taking in children relative to adults would be associated with under-recruitment of DLPFC, a region implicated in the weighing of response options (McClure et al., 2004), and/or under-recruitment of OFC, a region implicated in the anticipation of choice outcomes (Rogers et al., 2004). It should, however, be noted that this was the first fMRI study examining decision-making in children younger than 12 years of age. We have shown that children aged 9-12 recruit many of the same regions that have been linked to risk estimation in adults, albeit with some differences in sensitivity to uncertainty and risk. The sensitivity of these regions to different levels of uncertainty and risk in children should be validated in future research.
et al. 2002; Carter et al., 1998; Critchley, Corfield, Chandler, Mathias & Dolan, 2000; O'Doherty et al, 2001; Van Veen & Carter, 2002). The ACC activation in the present study suggests that performance monitoring for high-risk decisions is more effortful for children compared to adults. This enhanced ACC activation is likely to reflect the fact that children have greater difficulty making the right decision under uncertainty, even if, as in the case of this simple task, they choose advantageously most of the time. Instead or additionally, greater ACC response in children may reflect less efficient performance monitoring in children, even though the high-risk vs. low-risk contrast was estimated purely on the basis of correctly performed trials. Arguing against this interpretation, it has been found that the Error-Related Negativity (a brain potential observed in the encephalogram in response to errors) becomes larger over the course of adolescence (e.g. a flanker task in Davies et al., 2004). This latter finding supports the view that children over-recruit ACC on this task because they have greater difficulty than adults in choosing the less risky option.
2.4.3 Feedback processing
Both adults and children recruited bilateral VLPFC (BA 47) for negative vs. positive feedback processing. This result is consistent with previous studies on adults showing that this region is active following punishment (e.g., O’Doherty et al., 2003), and following negative feedback indicating a rule reversal (Cools, Clark, Owen & Robbins, 2002; Cools, Clark & Robbins, 2004). In our study, adults also exhibited activation in medial PFC/ACC (BA 6/ BA 32 (dorsal) and 24 (ventral)). This finding is consistent with previous results by Holroyd et al. (2004), who have suggested that the medial PFC/ACC is active when individuals receive negative feedback as well as when they make an error. However, it should be noted that this interpretation is not universally accepted, and follow-up research by this group has failed to replicate this effect (Nieuwenhuis, Slagter, Alting von Geusau, Heslenfeld, & Holroyd, 2001). Also, the medial PFC region reported here is more anterior than the medial PFC/ACC region reported by Holroyd et al. (2004).
processing magnitude of both positive and negative outcomes (Breiter et al., 2001). There was no difference between age groups for positive feedback in this region, indicating that right lateral OFC was more strongly attuned to negative feedback for children than adults.
Lateral OFC and VLPFC (BA 11/47) are thought to process negative feedback for the purpose of adjusting behavior to optimize performance (Cools et al. 2002; Kringelbach & Rolls, 2004). In a prior developmental study in which participants had to use performance feedback to improve their performance, we examined how children adjust their behavior based on positive and negative feedback in a stimulus-response mapping task (Crone et al., 2004). On a proportion of the trials, participants received standard response-dependent feedback (i.e., negative feedback after an incorrect response, and positive feedback after a correct response). In a second condition, intermixed with the response-dependent condition and unknown to the participants, participants received positive and negative feedback that was unrelated to their actual performance. Heart rate was measured as an index of feedback processing. In this prior study, we found that heart rate slowed following negative performance feedback, and that the amount of slowing was the same for all age groups for informative feedback. However, participants older than 12 did not show this slowing to
uninformative negative feedback, whereas children younger than 12 did. These findings suggest that children under the age of 12 have difficulty distinguishing between relevant and irrelevant feedback for the purpose of performance adjustment. Behavioral studies have consistently shown that children perform worse than adults on complex decision-making tasks (Kerr & Zelazo, 2004; Crone et al., 2003; Overman, 2004). This might be in part because they fail to distinguish between informative and uninformative feedback, or because they are less able than adults to adjust their behavior on the basis of negative feedback (Kirkham & Diamond, 2003). The enhanced activation in lateral OFC observed in children in the present study in response to negative feedback suggests that children may be generally more sensitive to negative feedback than adults, regardless of whether or not the feedback is meaningful. This finding could be further investigated in future research by manipulating the magnitude of positive and negative feedback.
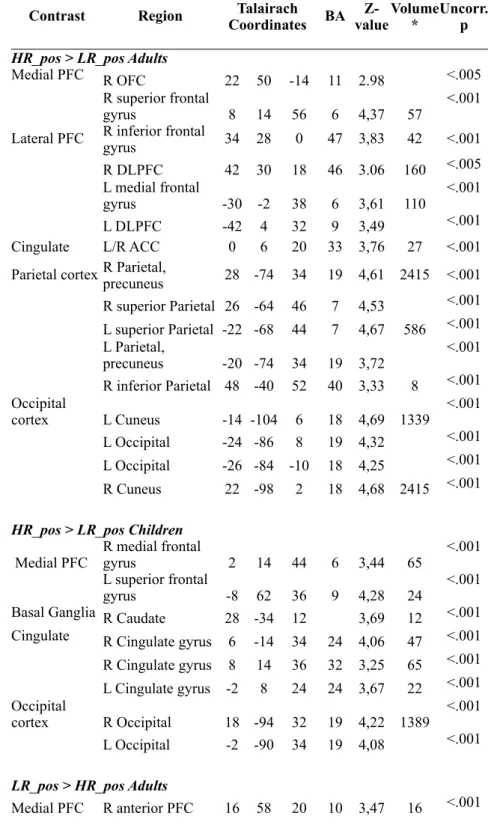
Table 2.1 Risk estimation-elicited activation for High-Risk and Low–Risk trials for both age groups
Contrast Region CoordinatesTalairach
Talairach Coordinates Talairach Coordinates
BA valueZ- Volume* Uncorr. p
HR_pos > LR_pos Adults HR_pos > LR_pos Adults HR_pos > LR_pos Adults HR_pos > LR_pos Adults HR_pos > LR_pos Adults HR_pos > LR_pos Adults HR_pos > LR_pos Adults HR_pos > LR_pos Adults HR_pos > LR_pos Adults
Medial PFC R OFC 22 50 -14 11 2.98 <.005
R superior frontal
gyrus 8 14 56 6 4,37 57 <.001
Lateral PFC R inferior frontal gyrus 34 28 0 47 3,83 42 <.001
R DLPFC 42 30 18 46 3.06 160 <.005 L medial frontal
gyrus -30 -2 38 6 3,61 110 <.001
L DLPFC -42 4 32 9 3,49 <.001
Cingulate L/R ACC 0 6 20 33 3,76 27 <.001
Parietal cortex R Parietal, precuneus 28 -74 34 19 4,61 2415 <.001
R superior Parietal 26 -64 46 7 4,53 <.001 L superior Parietal -22 -68 44 7 4,67 586 <.001 L Parietal,
precuneus -20 -74 34 19 3,72 <.001 R inferior Parietal 48 -40 52 40 3,33 8 <.001 Occipital
cortex L Cuneus -14 -104 6 18 4,69 1339 <.001 L Occipital -24 -86 8 19 4,32 <.001 L Occipital -26 -84 -10 18 4,25 <.001 R Cuneus 22 -98 2 18 4,68 2415 <.001
HR_pos > LR_pos Children HR_pos > LR_pos Children HR_pos > LR_pos Children HR_pos > LR_pos Children HR_pos > LR_pos Children HR_pos > LR_pos Children HR_pos > LR_pos Children HR_pos > LR_pos Children HR_pos > LR_pos Children
Medial PFC R medial frontal gyrus 2 14 44 6 3,44 65 <.001 L superior frontal
gyrus -8 62 36 9 4,28 24 <.001
Basal Ganglia R Caudate 28 -34 12 3,69 12 <.001 Cingulate R Cingulate gyrus 6 -14 34 24 4,06 47 <.001
R Cingulate gyrus 8 14 36 32 3,25 65 <.001 L Cingulate gyrus -2 8 24 24 3,67 22 <.001 Occipital
cortex R Occipital 18 -94 32 19 4,22 1389 <.001 L Occipital -2 -90 34 19 4,08 <.001
LR_pos > HR_pos Adults LR_pos > HR_pos Adults LR_pos > HR_pos Adults LR_pos > HR_pos Adults LR_pos > HR_pos Adults LR_pos > HR_pos Adults LR_pos > HR_pos Adults LR_pos > HR_pos Adults LR_pos > HR_pos Adults
Lateral PFC L Insula -36 -28 16 13 3,38 10 <.001 Parietal cortex L inferior Parietal -66 -32 28 40 4,68 91 <.001 R inferior Parietal 58 -24 24 40 4,52 145 <.001 Temporal
cortex R Middle Temporal Gyrus 58 -64 8 37 4,05 143 <.001 L Middle
Temporal Gyrus -58 -68 8 37 3,68 21 <.001 L Angular -52 -72 32 39 3,5 71 <.001
Cingulate R ACC 12 46 -10 29 3,2 5 <.001
Somato-sensory cortexL Precentral Gyrus -24 -24 58 4 3,93 63 <.001 Occipital
cortex L Superior Occipital -46 -80 34 19 3,43 71 <.001
LR_pos > HR_pos Children LR_pos > HR_pos Children LR_pos > HR_pos Children LR_pos > HR_pos Children LR_pos > HR_pos Children LR_pos > HR_pos Children LR_pos > HR_pos Children LR_pos > HR_pos Children LR_pos > HR_pos Children
Parietal cortex L Parietal, Angular -44 -68 34 39 3,16 5 <.001
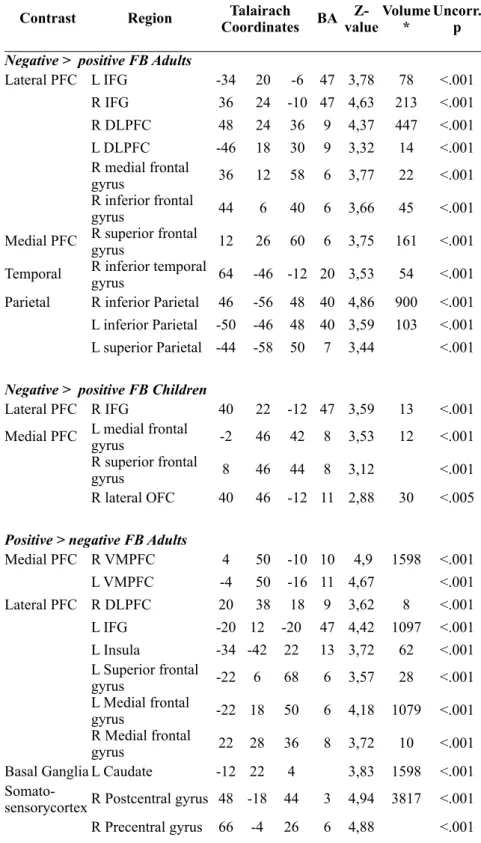
Table 2.2 Feedback -elicited activation (positive > negative and negative > positive) for both age groups
Contrast Region CoordinatesTalairach
Talairach Coordinates Talairach Coordinates Talairach Coordinates
BA Z-valueVolume* Uncorr. p
Negative > positive FB Adults Negative > positive FB Adults Negative > positive FB Adults Negative > positive FB Adults Negative > positive FB Adults Negative > positive FB Adults Negative > positive FB Adults Negative > positive FB Adults Negative > positive FB Adults Negative > positive FB Adults
Lateral PFC L IFG -34 2020 -6 47 3,78 78 <.001 R IFG 36 2424 -10 47 4,63 213 <.001 R DLPFC 48 2424 36 9 4,37 447 <.001 L DLPFC -46 1818 30 9 3,32 14 <.001 R medial frontal
gyrus 36 1212 58 6 3,77 22 <.001 R inferior frontal
gyrus 44 66 40 6 3,66 45 <.001
Medial PFC R superior frontal gyrus 12 2626 60 6 3,75 161 <.001
Temporal R inferior temporal gyrus 64 -46-46 -12 20 3,53 54 <.001
Parietal R inferior Parietal 46 -56-56 48 40 4,86 900 <.001 L inferior Parietal -50 -46-46 48 40 3,59 103 <.001 L superior Parietal -44 -58-58 50 7 3,44 <.001
Negative > positive FB Children Negative > positive FB Children Negative > positive FB Children Negative > positive FB Children Negative > positive FB Children Negative > positive FB Children Negative > positive FB Children Negative > positive FB Children Negative > positive FB Children Negative > positive FB Children
Lateral PFC R IFG 40 2222 -12 47 3,59 13 <.001 Medial PFC L medial frontal gyrus -2 4646 42 8 3,53 12 <.001
R superior frontal
gyrus 8 4646 44 8 3,12 <.001
R lateral OFC 40 4646 -12 11 2,88 30 <.005
Positive > negative FB Adults Positive > negative FB Adults Positive > negative FB Adults Positive > negative FB Adults Positive > negative FB Adults Positive > negative FB Adults Positive > negative FB Adults Positive > negative FB Adults Positive > negative FB Adults Positive > negative FB Adults
Medial PFC R VMPFC 4 5050 -10 10 4,9 1598 <.001 L VMPFC -4 5050 -16 11 4,67 <.001 Lateral PFC R DLPFC 20 3838 18 9 3,62 8 <.001 L IFG -20 12 -20-20 47 4,42 1097 <.001 L Insula -34 -42 2222 13 3,72 62 <.001 L Superior frontal
gyrus -22 6 6868 6 3,57 28 <.001 L Medial frontal
gyrus -22 18 5050 6 4,18 1079 <.001 R Medial frontal
gyrus 22 28 3636 8 3,72 10 <.001 Basal Ganglia L Caudate -12 22 44 3,83 1598 <.001
R Postcentral gyrus 54 -18 5454 3 4,8 <.001 Parietal
cortex L Parietal, sub-gyral -26 -46 5656 7 3,4 16 <.001 Temporal
cortex R Middle temporal gyrus 62 0 -8-8 21 4,47 325 <.001 R Superior
temporal gyrus 68 -18 00 22 3,83 <.001 Parahippocampal
gyrus 20 -8 -24-24 35 4,88 3214 <.001 L Posterior
cingulate -12 -60 1414 30 5,04 8525 <.001 L Middle Temporal
gyrus -48 -76 1010 39 4,03 101 <.001 L Superior
Temporal gyrus -60 -30 1414 42 4,22 260 <.001 L Parahippocampal
gyrus -22 0 -12-12 34 4,55 1097 <.001 L Fusiform gyrus -44 -36 -24-24 36 3,4 6 <.001 Occipital
cortex L Superior Occipital -40 -84 3636 19 3,98 91 <.001 L Occipital -20 -90 4040 19 3,74 <.001
Positive > negative FB Children Positive > negative FB Children Positive > negative FB Children Positive > negative FB Children Positive > negative FB Children Positive > negative FB Children Positive > negative FB Children Positive > negative FB Children Positive > negative FB Children Positive > negative FB Children
Lateral PFC L Medial frontal gyrus -20 -2 3838 6 3,26 6 <.001 Basal Ganglia L Caudate -6 20 88 3,66 5 <.001 Cingulate
cortex R Cingulate gyrus 12 -40 4444 31 3,33 10 <.001 Parietal
cortex L inferior Parietal -66 -26 3232 40 3,54 26 <.001 Occipital
cortex L Occipital -10 -82 2020 18 3,23 6 <.001
3.
What motivates the adolescent?
Brain regions mediating reward
sensitivity across adolescence
3.1 Introduction
Often decisions are made in uncertain situations, in which not all the information needed to make a rational decision is known. When choices in uncertain situations are associated with possible negative outcomes, they are considered risky. An increase in risky behavior is one of the most salient characteristics of adolescence (Arnett 1999; Boyer 2006; Steinberg 2004). This change in behavior suggests a difference in the decision making processes of adolescents compared to adults. That is, adolescents may choose differently between competing courses of action in an uncertain situation, because they weigh the possible outcomes and the probabilities with which these occur differently compared to adults. Prior studies have suggested that adolescents are biased towards taking risks because of differences in the way they experience rewards (Bjork et al. 2004; Ernst et al. 2005; Galvan et al. 2006; May et al. 2004; Van Leijenhorst et al. 2006).
Functional magnetic resonance imaging (fMRI) studies have identified brain regions related to outcome anticipation and processing. Many studies have shown that the ventral striatum responds to anticipation of potential rewards (Breiter et al. 2001; Dagher 2007; Knutson et al. 2001; Tom et al. 2007), which was confirmed by a recent meta analysis (Knutson and Greer, 2008). In addition, the anterior insula have been implicated in the anticipation of outcomes, activation in this region is also often associated with the uncertainty associated with anticipation (Critchley et al. 2001; Volz et al. 2003). Finally, several studies in adults have shown that medial prefrontal, orbitofrontal and anterior cingulate cortex are involved in processing rewards (Bechara 2001; Knutson et al.
2001; O'Doherty et al. 2001; O'Doherty et al. 2002; Rolls 2000).
combination with immature cognitive control abilities (resulting from the protracted development of the prefrontal cortex (PFC)) biases adolescents towards taking risks (Casey et al. 2008b; Ernst et al. 2006; Galvan et al. 2006).
adolescents drives them to take risks, it is important to understand the extent to which this region is independent of behavioral requirements. In addition, it is important to understand at what phase, during the anticipation or processing of rewards, differences between adolescents and adults are observed. A better understanding of the causes of adolescent reward processing can help interpret the potentially harmful risky behavior that many adolescents engage in. It is important to understand whether adolescents are more likely to engage in risky behavior compared to adults because they overestimate potential rewards (in an early phase of the decision-making process), or because their response to received rewards differs from that of adults (in a later phase). Insight into these possible differences in reward sensitivity in adolescence informs us about the processes that underlie adolescent real-world risky behavior. In addition this knowledge could aid attempts to intervene and protect adolescents against the problems they face. Basic differences in reward related brain regions between participants form different ages may complicate the interpretation of developmental changes in behavior. One way to work around this difficulty is to study reward processing using an experimental task in which reward and risk are unrelated to participants’ behavior (see Tobler et al. 2008) for a similar approach). Therefore, the goal of this study was to examine developmental differences in neural activation related to different phases of reward processing in the absence of behavior.
all three pictures are different; XXY vs XYZ), processing of reward (when all three pictures are the same versus the first two out of three pictures are the same; XXX vs XXY), and omission of reward (XXY vs XXX).
Our analyses focused on identifying brain regions implicated in reward processing and uncertainty, including the striatum, the insula and the orbitofrontal cortex (OFC). Our first hypothesis was that these regions show functional development which is reflected in a different pattern of activation in the different age groups. We tested for linear and nonlinear developmental patterns. Our second hypothesis was that if adolescent risk taking is associated with increased sensitivity to reward this should be reflected in a peak in activation in the ventral striatum in this age group. We examined at which stage, during anticipation or processing of outcomes, the ventral striatum would show different responses in the absence of behavioral requirements, and whether the response to rewards in this region would be increased or decreased in adolescents compared to adults. The results are expected to provide insight in the development of reward related brain regions during adolescence, and contribute to the interpretation of differences in neural responses between adolescents and adults in more complex reward and risk-taking tasks.
3.2 Method
3.2.1 Participants
difference in average movement between the age groups was not significant (p >.1).
3.2.2 Behavioral assessment
Prior to scanning, all participants were prepared for the scan session in a quiet laboratory in which a mock scanner was present. This mock scanner, which simulated the environment and sounds of an actual MRI scanner, gave minors the opportunity to become accustomed to the scanner environment, and was used to explain the scanning procedure to all participants. In order tot obtain an estimate of IQ, age appropriate versions of two subtests of the Wechsler Adult Intelligence Scale (Wechsler 1981) or the Wechsler Intelligence Scales for Children (Wechsler 1991) - Similarities and Block Design - were administered to all participants. For 10-12 year olds, 14-15 year olds and 18-23 year olds estimate IQs were 119.7 (SD = 9.7), 106.0 (SD = 9.0) and 108.7 (SD = 9.4) respectively. 10-12 year olds’ average IQ was significantly higher relative to the other two age groups (F(2, 49) = 11.62, p =.001) but overall participants’ IQs fell in the average range. The analyses reported below were all corrected for differences in IQ by adding IQ as a covariate factor to the analyses. However, none of the effects were influenced by IQ differences. Therefore, IQ differences are not described further.
All participants were screened for psychiatric conditions, drug use, head injuries and contraindications for MRI using a checklist. No participants reported any problems. In addition, participants in the two youngest age groups were screened for behavioral problems using parent-ratings on the Child Behavior Checklist (Achenbach 1991). Scores for all participants fell within the non clinical range.
3.2.3 Experimental Design
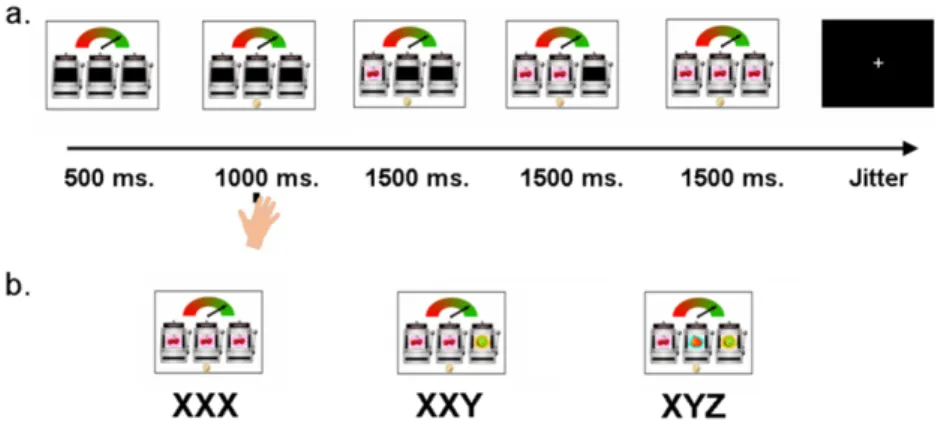
Following the 1000 ms response window, three pictures, each one of three possible fruit types – a kiwi, a pear or a pair of cherries - were presented consecutively, from left to right in the slot machines, every 1500 ms (See Figure 3.1).
Pictures were presented in three possible orders: 1) three different pictures (e.g., kiwi-pear-cherries, referred to as XYZ trials), 2) two identical and one different picture (e.g., kiwi-kiwi-cherries, referred to as XXY trials) or 3) three identical pictures (e.g., kiwi-kiwi-kiwi, referred to as XXX conditions). These three trial types represent three experimental conditions. The order in which trials were presented was randomized and participants were presented with a new combination of the three pictures on each trial. Participants were instructed in advance that they would gain € 0.05 on each XXX trial, and that they would not gain money on the other types of trials. When participants failed to respond during the 1000 ms. cue presentation, the trial ended and they received a € 0.10 penalty. This occurred on less than 5% of the trials. At the end of the experiment the total winnings (€ 1.50) were added to the amount that participants received as reimbursement for participating in the study.
Figure 3.1 Example of a.) a trial, b.) a possible outcome displays for the Slot
Machine Task. Following a 1000 ms. time window in which participants could respond to the cue, three pictures appeared consecutively every 1500 ms. resulting in three trial types: XXX, XXY or XYZ. Participants won € 0.05 on each XXX trial, and did not win in the other conditions.
3.2.4 MRI Data Acquisition
onto a screen that participants could see via a mirror attached to the head coil. During scanning participants were presented with a total of 120 trials, in which XXX, XXY and XYZ trials were intermixed, such that 60 XYZ trials, 30 XXY and 30 XXX trials were presented in total, with 60 trials in each run. Age related differences in response to rewards could be influenced by slow maturation of the ability to learn probabilities and predict risk. We controlled for this possibility by presenting the three consecutive stimuli in pseudo-random order to maximize uncertainty. On all trials after presentation of the first picture the probability that the next picture in the series of three was the same was always 50%. In the same way, after two identical pictures had been presented the probability that the third picture was the same was 50%. (50% XYZ, 25% XXY, 25% XXX trials, following (Donkers et al. 2005). Periods of fixation lasting between 1 and 3 s, jittered in increments of 500 ms, were added in between the experimental trials.
Scanning was performed using a standard whole-head coil on a 3 Tesla Philips scanner at the Leiden University Medical Center (LUMC). Functional data were acquired using a T2*-weighted gradient-echo echo-planar pulse sequence (38 contiguous 2.75 mm oblique axial slices, using interleaved acquisition, TR = 2.211 s, TE = 30 ms, 2.75 x 2.75 mm inplane resolution, 230 volumes per run). The first two volumes of each scan were discarded to allow for T1-equilibration effects. High-resolution T2* weighed images and high resolution T1 anatomical images were collected at the end of the scan session. Head motion was restricted using a pillow and foam inserts that surrounded the head.
3.2.5 fMRI preprocessing and Statistical analysis

![Figure 2.4 Activation profiles for ROIs derived from gain vs. loss contrast. The contrasts for VLPFC (-20, 12, -20 [x, y, z]) and medial PFC (-22, 18, 50 [x, y, z]) were based on an F-contrast based on all participants](https://thumb-us.123doks.com/thumbv2/123dok_us/8320760.2205408/32.748.145.602.385.753/figure-activation-profiles-derived-contrast-contrasts-contrast-participants.webp)