WATER SAFETY PLAN COST ANALYSIS:
EXPLANATION BUILDING WITH CASE STUDIES
IN THE WESTERN PACIFIC REGION
Zai Kang Chang
A thesis submitted to the faculty of the University of North Carolina at Chapel Hill in partial fulfillment of the requirements for the degree of Master of Science in the Gillings School of Global Public Health (Environmental Sciences and Engineering).
Chapel Hill 2011
ABSTRACT
ZAI KANG CHANG: Water Safety Plan cost analysis: explanation building with case studies in the Western Pacific Region
(Under the direction of Jamie Bartram)
ACKNOWLEDGMENTS
TABLE OF CONTENTS
LIST OF TABLES ... vi
LIST OF FIGURES ... vii
1 Introduction ... 1
1.1 Water safety and health ... 1
1.2 Drinking-water quality management based upon end-point monitoring ... 2
1.3 Water Safety Plans and Risk Management ... 3
2 Objective ... 9
3 Scope of costs and benefits ... 9
4 Methods ... 11
4.1 Participant selection... 11
4.2 Data collection ... 12
4.3 Cost calculation ... 18
4.4 Analysis ... 22
5 Results ... 29
5.1 Perceived benefits of WSP implementation ... 29
5.1 Costs of WSP implementation ... 31
5.2 Relationships between DWSA characteristics and WSP implementation benefit and cost types ... 32
6 Discussion ... 37
6.1 Results ... 37
6.2 Limitations ... 39
6.3 Areas of future research ... 40
7. Conclusion ... 41
APPENDIX 1A: Brief introduction to project ... 43
APPENDIX 1B: Questionnaire template ... 44
APPENDIX 1C: Definitions... 50
LIST OF TABLES
Table 1: ISO 9000 series of quality assurance standards ... 7 Table 2: Purpose and example questions by data requirement
category ... 12 Table 3: List of the strengths and weaknesses of the primary
sources of evidence. Adapted from Yin, 1994. ... 13 Table 4: Lifespan estimates for water supply equipment.
Adapted from the New Zealand Ministry of Health, 2007 ... 22 Table 5: Benefit categories developed based on the perceived
benefits of the participants ... 24 Table 6: Cost categories adapted from those used in HACCP
costing studies of the food industry ... 25 Table 7: Measures of efficiency and effectiveness used to
determine the DWSA categories... 26 Table 9: Table of benefits types with benefit categories ... 29 Table 10: Benefits perceived by surveillance agencies. ... 30 Table 11: Cost categories for all six case studies presented in
international dollars ... 31 Table 12: Cost categories for all six case studies in international
dollars per connection... 31 Table 13: Ratio between the costs of the highest and lowest
DWSAs in each cost category. ... 33 Table 14: Number of Basic WSP activities/cost types by DWSA.
Cost totals correlate with the number of Basic WSP activities, or
LIST OF FIGURES
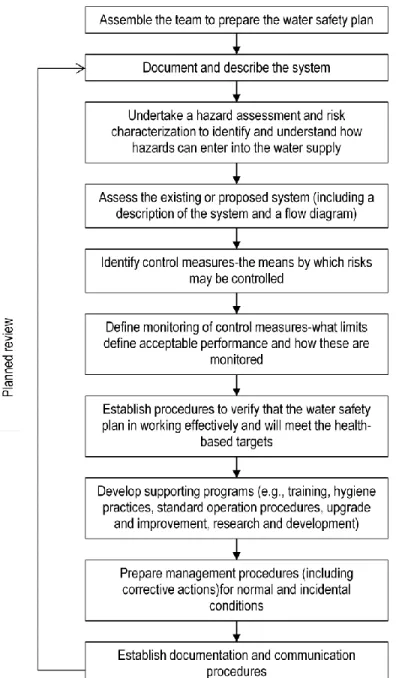
Figure 1: Key steps in the development of a water safety plan.
Adapted from WHO, 2011. ... 5 Figure 2: Data were categorized into categories. Benefits were
divided into theoretically mutually exclusive categories. ... 23 Figure 3: A conceptual model of the explanation building procedure. ... 27 Figure 4: Diagram of the types of comparisons made in the
explanation building procedure. ... 28 Figure 5: The percent contribution of Basic WSP and DWSA-specific
costs to non-recurring costs. The DWSA-specific costs of non-„developed‟
DWSAs consisted of supporting program and capital costs. ... 34 Figure 6: Basic WSP recurring costs by DWSA. Significant
variation exists among both 'Developed' and non-„developed‟ DWSA. ... 34 Figure 7: Recurring costs for non-'developed' DWSAs primarily
LIST OF ABBREVIATIONS
DWD - Dasmariñas Water District
DWQM – Drinking-water quality monitoring DWSA – Drinking-water supply agency
(US) EPA – (United States) Environmental Protection Agency HACCP – Hazard Assessment and Critical Control Points HUE - Thua Thien Hue Water Supply & Sewerage Company ISO – International Organization for Standardization
K-A - Koror-Airai Public Water Supply MYD - Maynilad Water Services, Inc.
PKE - Pakse Provincial Water Supply State-Owned Enterprise SOP – Standard operating procedure
1 Introduction
1.1
Water safety and health
The overarching understanding on water, sanitation, hygiene and health is clear. Populations where these qualities are lacking or poor suffer from adverse health outcomes. Globally, the disease burden from water, sanitation and hygiene (WaSH) is estimated to be 4.0% of all deaths and 5.7% of the total disease burden (Prüss et al.). Poor WaSH conditions result in an estimated 94% of diarrhea incidence (Prüss-Üstün and Corvalán) which is significant considering diarrheal diseases are responsible for an estimated 2.46 million deaths nearly all occurring in low and middle income countries (World Health Organization). The costs of the burden of disease extends past their
immediate health effects and has economic consequences through the cost of treatments and lost time at work and school. While there is a degree of uncertainty in the exact number of deaths and disease burden, the magnitude of the figures make WaSH issues one of the greatest health threats to
populations.
While in 2008 there were an estimated 5.82 billion people using improved water supplies (World Health Organization/UNICEF), it is understood that using an improved water supply does not
desired quality. In developing countries service quality is generally seen as poor (Briscoe and Garn). These characteristics make it difficult for utilities to maintain financial sustainability. Utilities must find ways to maintain both financial responsibilities and the responsibility to provide safe water to the public.
Conditions threatening the safety of the water supply are greatest in lower- and middle-income countries; however, larger utilities in wealthier settings are not immune. Large microbial and chemical contamination events occur in higher-income countries as illustrated by the 1998 Sydney Cryptosporidium outbreak or the Milwaukee and Walkerton outbreaks (Hrudey and Hrudey) detailed further by Hrudey (2006). Rural settings of developed countries are also susceptible to unsafe water supply.
Globally, the provision of safe drinking-water is a necessary, but often insufficient condition for alleviating the incidence of diarrheal disease. One of the first evidence-based public health
interventions began with John Snow and the epidemiological study of the Broad street pump, since then it has been established that improvements to water supply offer an effective means of reducing the incidence of diarrheal diseases and other waterborne illnesses (Esrey et al.). Improving the availability of safe water for drinking, sanitation and hygiene is fundamental to the development process with benefits extending across many sectors in addition to health.
1.2
Drinking-water quality management based upon end-point monitoring
analyzing drinking-water quality to verify the quality of the water produced. In many parts of the world, the water sector monitors end-point water quality relative to drinking-water quality standards to manage water safety. Drinking-water quality management systems relying on end-point
monitoring, test drinking-water quality at some point after any treatment of the raw water. Under this management scheme, water quality samples not meeting defined standards, trigger corrective action in response. While end-point monitoring is critical in verifying the system of quality control measures, these types of methods alone for the control of microbiological quality of drinking-water are inadequate (Howard). Compliance with drinking-water quality standards does not ensure water safety because corrective actions are triggered only after human exposure has occurred. Errors in the operation or flaws in the design of some components of the water supply system may exist
undiscovered and have yet to contribute to a contamination event. Monitoring, even when
consistently performed by both the surveillance and drinking-water supply agencies, does not prevent outbreaks, rather indicates only after the exposure has occurred (World Health Organization and Swedish Institute for Infectious Disease Control). Risk management approaches seek to identify and manage the risks to safe water supply before they result in a hazardous event. Therefore,
international thinking on management of drinking-water quality is moving towards taking a preventative, risk-management approach to water supply.
1.3
Water Safety Plans and Risk Management
Given the largely environmental nature of diarrhea and other water-borne diseases, it is
understood that environmental pathways such as drinking-water systems should be the target of health interventions. Understanding the environmental pathways in the context of water quality
The World Health Organization (WHO) presented Water Safety Plans (WSPs) in 2004 in the third edition of the Guidelines for Drinking-water Quality as “the most effective means of consistently ensuring the safety of a drinking-water supply…”. The Water Safety Plan is a comprehensive risk management approach that provides a template for DWSAs to assess and manage risks of drinking-water contamination found in the catchment, treatment systems and distribution networks in an integrated manner. In specific applications, elements of a WSP may already exist as a part of a water supply agency‟s operational procedures. WSPs are a conceptual approach to producing safe water, therefore, adaptation of the concepts is necessary in application and the specifics of the resulting plan will be unique. This is reflected in practice by the variety of existing WSPs that are publicly
available. While these differences exist, the WHO (World Health Organization) suggests all WSPs should maintain the following three essential components:
(1) system assessment to determine if the water supply system can deliver safe water; (2) Identifying control measures in the water supply system to control identified risks. Each
control measure will have a means of operational monitoring that will ensure that any deviation from performance limits will be detected in a timely manner; and
(3) The management plans describing normal operation and incident conditions and documenting the system assessment and other water safety plan outputs.
Figure 1: Key steps in the development of a water safety plan. Adapted from WHO, 2011.
The approach is to encompass the four stages of the water supply: catchment, treatment, distribution and customer plumbing systems forming a holistic approach to drinking-water quality management. Further details on the implementation procedure can be found in the many publicly available guides.
the full HACCP procedure is formalized in detail by the Codex Alimentarius Commission in 1993. HACCP implementation is comprised of a series of step processes designed to help assess and manage the risks to the safety of the supplied product. The key steps are taken from the Codex (CAC (Codex Alimentarius Commission)) as follows:
1. Assemble a HACCP team 2. Describe the product
3. Identify the intended use of the product
4. Construct a flow diagram of the production process 5. Confirm the process flow diagram
6. Conduct a hazards analysis.
7. Determine Critical Control Points (CCP). 8. Establish critical limits.
9. Establish a system to monitor control of the CCP.
10. Establish the corrective action to be taken when monitoring indicates that a particular CCP is not under control.
11. Establish procedures for verification to confirm that the HACCP system is working effectively.
12. Establish documentation concerning all procedures and records appropriate to these principles and their application.
The HACCP system has been implemented throughout the world in the food industry (Ropkins and Beck) and its economic impacts have been well studied (Crutchfield et al. and Antle). Thoughts on applying the HACCP system to drinking-water supply were first published by Havelaar in 1994 and are implicit in earlier documents from WHO (Bartram, Fewtrell and Stenström). The overarching goals of HACCP and WSP show many similarities: to assess the water supply system, conduct hazard analysis, establish plans for monitoring the risks (at the critical control points) and create a plan for the continuation of risk management. While commonalities exist, WSPs strive to assess and manage risks through a large number of interventions, while the HACCP system primarily focuses on hazards at the control points. Managing risks to water safety include managing both the probability of the hazard and the severity of its consequence. However, in practice, both approaches have been adapted and implemented to fit the needs and capacities of the DWSAs, resulting in a spectrum of water safety strategies.
standards for quality management that fulfills the quality requirements of the customer, meets regulatory requirements, enhances customer satisfaction and achieves continually improvement throughout operations (International Organization for Standardization). The three standards included in Table 1. It specifies how management operations are to be conducted with the goal of reducing non-conformity of the product (Buttle). There is overlap between the ISO 9000 series and the system description, system assessment, verification establishment and management procedure preparation steps in the WSP implementation process. The ISO 14000 series is a management tool, when met, enable an organization to identify and control the environmental impact of its activities, products or services; continually improve its environmental performance, and implement a systematic approach to setting and achieving environmental objectives and targets (International Organization for Standardization). ISO 17025 General requirements for the competence of testing and calibration laboratories specifies the requirements for competence to carry out test such as drinking-water quality testing. It creates specifications on sampling and testing but is also used to develop
management systems for quality, administrative and technical operations (International Organization for Standardization). When employed in water supply agencies, both systems create management environments or prescribe actions that overlap with those identified by both HACCP and WSPs.
Table 1: ISO 9000 series of quality assurance standards
Standard Description
ISO 9001 Standard for quality assurance in design, development, production, installation and servicing
ISO 9002 Standard for quality assurance in production and installation
ISO 9003 Standard for quality assurance in final inspection and test of product or service
1.4
Barriers to WSP implementation
concepts into regulations of seven countries, two of which are not included in the WHO estimates (Environmental Protection Agency).
While utilities desire to systematically manage risks and provide a consistent supply of safe water to their consumers, due to resource constraints, it is necessary for decision makers, from the drinking-water supply agency to the Ministry level authorities, to evaluate the efficiency of implementing WSPs. One portion of this evaluation should weigh the benefits and costs of such actions.
In a field that is largely practitioner-led, qualitative descriptions of WSP benefits to utilities have been documented extensively in countries including Australia (Jayaratne and Smith), Iceland
(Gunnarsdottir), South Africa (Viljoen). The intended beneficiaries of water safety plans are
primarily the consumers; however, there are numerous benefits for DWSAs as well (Martel et al. and World Health Organization). Martel (2006) presents a HACCP guide for water distribution system in which it is recommended that the organization identify goals and expected benefits of HACCP. It is readily understood that benefits gained from WSP implementation will depend upon the
characteristics of the DWSA. While information on benefits to DWSAs exists, it has yet to be organized in a systematic way to aid understanding of the relationship between benefits and DWSA characteristics.
have been discussed (Godfrey). Furthermore, costs of implementing WSPs will vary widely between DWSAs. The motivation of the DWSAs to implement WSPs will be based upon its prior perception of costs and benefits. Understanding relationships between DWSA characteristics and resulting costs and benefits can improve the ability for individual DWSAs to predict cost and benefit estimations.
2
Objective
The objective of the research is to provide perceived benefits and costs of WSP implementation to DWSAs and surveillance agencies and to improve the ability of the agencies to estimate a priori
the cost of WSP implementation. The second objective of the research is achieved by providing evidence to answer the following questions.
(1) What are the relationships between DWSA characteristics and benefits and costs of WSP implementation?
(2) What are the dominant types of WSP implementation costs?
3
Scope of costs and benefits
Decision makers undertake costing exercises to identify how best to allocate their scarce
resources. To establish the costs of WSP implementation, the following steps were taken to establish the scope of costs and benefits:
1 specify the alterative projects,
2 decide which groups have standing, and 3 identify impacts of the project.
existing cost to the utility, such as staff time, then the marginal increase in costs will be calculated. In economics, this is called a “with-and without-” analysis1. All monetary values presented are the costs incurred with WSP implementation relative to the costs incurred without WSP implementation.
Standing is a term used to describe the people to whom the costs and benefits accrue. To assess total costs, the analyst would have to include anyone impacted by the intervention. Theoretically, this can include many people outside of the consumers, DWSAs, governments funding the DWSAs (for public utilities) to include all of society. DWSAs and surveillance agencies were the groups chosen to have standing, therefore, costs will be financial costs (to the DWSA or surveillance agency) as opposed to economic costs (to all of society). A financial analysis of costs to the aforementioned agencies is more relevant for DWSA managers and some surveillance agencies than an analysis of costs to all society. The primary beneficiaries of WSPs are consumers. Their benefits are well recognized and will not be included. The focus of the study is water utilities rather than community supplies. The scope is chosen for several reasons: to limit the variability in the observed costs of WSP implementation, accessibility of information, and the prevalence of cases to study.
The impacts of WSP implementation are any changes in activities resulting directly from the development and implementation of the WSP. The cost of WSP development and implementation is the monetary value of any new activities or the marginal value of any change of existing activities directly resulting from the WSP. Similarly, the benefits are perceived advantages of WSP
implementation accrued to the DWSAs and surveillance agencies. If activities called for by the WSP were already performed under another management strategy such as ISO 9001 then that activity is not considered a cost of the WSP. Where the WSP calls for renewed emphasis on an already existing program, the incremental increase in effort or funding to the program is considered to be the ____________________________
1
“With- and without” analysis compares the costs and/or benefits of the system with and without the
attributed cost. Water Safety Plans are to be a continually adapting management plan; therefore, no WSP can be described as „fully‟ implemented. The scope of activities considered in the research does not include planned projects or activities that have yet to be budgeted. Though some utilities may not count staff time at training or additional workload for a salaried employees as a monetary expense, this information is calculated for two reasons: 1) additional time spent, or used for WSP activities may be accounted for by other utilities that attempt to estimate the potential cost of WSP implementation 2) the research characterizes the total costs of WSP implementation.
In some cases, water suppliers obtain technical assistance from aid agencies, government agencies and non-governmental organizations such as the WHO at no expense to the DWSA. There is value in these resource costs and they will be included and noted separately. This is done to attempt to capture the cost of WSP implementation for those suppliers that may not be able to obtain the no-cost technical assistance from these entities. Costs of the facilitation of WSP activities by the WHO and other global actors are diluted across many beneficiaries and are not included.
The cost of HACCP (herein described as WSP) system implementation is also studied.
4
Methods
4.1
Participant selection
The objective of the research is to understand costs and benefits as they accrue to DWSAs and surveillance agencies. To accomplish this it is necessary to collect information from participants with firsthand experience in developing and implementing WSPs. This includes drinking-water supply agencies and surveillance agencies. In order to maximize the coverage of information collected, all relevant agencies from which information was readily accessible were included. Solicited agencies were chosen primarily based on whether there was experience implementing WSPs.
Philippines, and Vietnam. The six DWSAs involved in the study include: Yarra Valley Water, Ltd (YVW) in Melbourne, Australia; Pakse Provincial Water Supply State-Owned Enterprise (PKE) in Pakse, Lao PDR; Koror-Airai Public Water Supply (K-A) in Koror, Palau; Maynilad Water Services, Inc. (MYD) in Manila, Philippines; Dasmariñas Water District (DWD) in Cavite, Philippines; and Thua Thien Hue Water Supply & Sewerage Company (HUE) in Hue City, Vietnam. The Western Pacific Region has eleven countries with implemented WSPs: Australia, Fiji, Niue, Palau, China, Japan, Lao PDR, New Zealand, the Philippines, Singapore, and Vietnam and an active regional WSP community. This was critical to data collection efforts as the required data comes primarily through practitioners directly involved in WSP implementation.
The selection of WSP included in this research is not meant to be representative of WSPs found globally; rather they were chosen to give deeper insight into the relationship between DWSA characteristics and perceived benefits and accrued costs.
4.2
Data collection
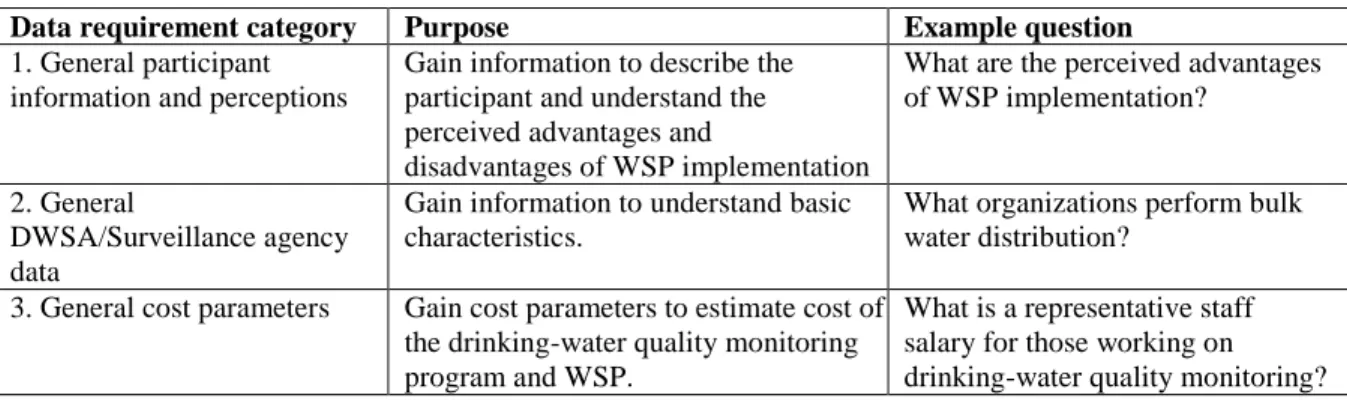
A set of data requirements was developed to identify all the data necessary to understand the WSP costs and benefits of specific DWSAs and surveillance agencies. A summary of the data requirements are organized by category in Table 2. There are several data requirements per requirement categories.
Table 2: Purpose and example questions by data requirement category
Data requirement category Purpose Example question 1. General participant
information and perceptions
Gain information to describe the participant and understand the perceived advantages and
disadvantages of WSP implementation
What are the perceived advantages of WSP implementation?
2. General
DWSA/Surveillance agency data
Gain information to understand basic characteristics.
What organizations perform bulk water distribution?
3. General cost parameters Gain cost parameters to estimate cost of the drinking-water quality monitoring program and WSP.
4. Pre-WSP Drinking-water quality monitoring program costs
Gain information to be used to estimate the cost of the drinking-water quality monitoring program in place before the WSP.
What is the number of drinking-water quality samples taken before the WSP implementation?
5. General WSP information Gain information to describe the WSP's implementation.
Were any management systems in place before the implementation of the WSP?
6. WSP Initial development costs
Gain information to estimate the cost of the initial development of the WSP.
What were the resources used to develop the WSP?
7. Change in drinking-water quality monitoring activity
Gain information to estimate any change in the cost of drinking-water quality monitoring resulting from the WSP.
Has there been a change in the annual costs of drinking-water quality monitoring since the WSP implementation?
8. Cost of activities directly related to WSP implementation
Gain information to estimate the costs associated with WSP implementation.
Have there been or will there be any capital improvements resulting from the WSP?
This study undertakes a case study approach to accounting costs of WSP implementation. The case study is a research strategy which focuses on understanding the dynamics present within individual settings (Eisenhardt). Data collection for this project took two forms: literature review and qualitative research methods. Data was collected through different and independent sources to increase the validity and retest reliability of the analysis. The strengths and weaknesses of the sources of evidence used in this study are included in Table 3.
Table 3: List of the strengths and weaknesses of the primary sources of evidence. Adapted from Yin, 1994.
Source of evidence
Strength Weakness
Documentation Stable – can be reviewed repeatedly
Unobtrusive – not created as a result of the case study
Exact – contains exact names, references and details of an event
Broad coverage – long span of time, many events, and many settings
Ability to retrieve-can be low
Biased selectivity if collection is incomplete
Reporting bias – reflects (unknown)bias of author
Access – may be deliberately blocked
Interviews (and questionnaires)
Targeted – focuses directly on case study topic
Insightful – provides perceived causal inferences
Bias due to poorly constructed questions
Response bias
Inaccuracies due to poor recall
Reflexivity – interviewee gives what interviewer wants to hear
accurate than information collected from a single source (Yin). All information sources were compared with each other to verify consistency. Where discrepancies between information sources existed, the researcher followed up with the participant or created a best estimate. Usage of best estimates is noted in the results.
All relevant data were organized by country and compiled into separate Microsoft Word documents. Information transferred to the Microsoft Word documents was referenced to maintain a chain of evidence.
A portion of the data collection was conducted from the WHO Pacific Regional Office in Manila, Philippines. Communication with participants in Lao PDR and Vietnam were administered through the WHO country offices.
Much of the data was collected through qualitative research means, only collected documents and background and literature review documents will be referenced.
4.2.1 Background and literature review.
In all countries studied, a desk-based academic and gray literature review was performed to collect background information. While the academic literature review employed standard techniques the gray literature review included the following resources:
(1) legislative databases such as ECOLEX,
(2) country pages of international water-related organizations such as the Secretariat of the Pacific Community, the World Health Organization, and AusAID..
(3) web pages of relevant ministries- often ministries of health, environment, or water supply and,
(4) trade magazines such as the International Water Association‟s Water21.
operating procedures, water safety plans, relevant standards documents and country and sector reports from various relevant and reputable organizations. Where searches revealed more than one version of a document, the more recent version was used. This was not always possible to determine as not all documents maintained dates. The review gathered information on WSP implementation projects in the WHO Western Pacific Region, background information on the selected countries‟ water sectors; resource valuation data, utility characteristics and relevant drinking-water quality monitoring cost parameters for DWSAs, regulators and surveillance agencies. Particularly relevant information was found in water safety plans, mission reports, drinking-water quality standards, advocacy material, conference notes and academic journal articles.
4.2.2 Lessons learned from piloting research methods and research ethics
Collecting data from multiple sources requires that each data collection method be used with skill in order to maintain information triangulation (Yin). To prepare, pilot projects were completed prior to the data collection period. The purpose of the first pilot was to develop and refine qualitative research methods while the purpose of the second was to validate the content of the inquiries. The pilot projects gave insight into several strategies for the qualitative research methods used in the research.
These procedures were implemented for questionnaires and interview methods and piloted with the Australian water company, Yarra Valley Water. The focus of this second pilot was to test the content of the questionnaire and interview. This exercise proved useful as Yarra Valley Water is a world-leader in risk-based management and has previously engaged in a costing exercise. Gaps in the required data were uncovered during the pilot and were subsequently adapted to reflect the insight gained from the pilot work. During the study, cost values depended upon the information from the participants directly involved in the implementation; therefore, designing a comprehensive approach to the qualitative research methods was critical.
The research involved human subjects and therefore approval from the University of North Carolina Office of Human Research Ethics (study number: 11-1022) was obtained. This process resulted in a research plan that took precautions to preserve the privacy of the identities of research participants and to remove information linking participants to the provided information. These precautions were included throughout the data collection process.
4.2.3 Standardized questionnaires
Where data requirements were not satisfied through the background and literature review, the researcher contacted individuals in relevant regulatory agencies, ministries, utilities, and other organizations working in the field such as the World Health Organization. These potential participants were solicited through a scripted email or voice communication. Initial solicitations contained language assuring potential participants that they would remain unidentified and unlinked to any provided information. The objectives of the study and the output were clearly stated here so as to reduce the perception that anything could be gained from responding inaccurately. Positive
questionnaire was adjusted to be appropriate for the participant. A list of definitions was attached with the questionnaires to help ensure a common understanding. A copy of the goals, default questions, and definitions used in the research is included in Appendix 1A, 1B, and 1C.
The questionnaire was emailed to participants in the Microsoft Word document format. Where the meanings of responses were unclear, the researcher followed-up via email or phone call. Being static documents, the questionnaires were used to serve as the initial point of correspondence for follow up necessary to capture greater resolution of the data.
Data on benefits were collected through open-ended questions and were supplemented by secondary sources. The open-ended question to participants regarding perceived benefits of WSP was phrased as “advantages of WSPs” as opposed to “benefits of WSP”. All elicited responses can be considered benefits of WSP. The open-ended question to participants regarding perceived challenges was phrased as “disadvantages of WSPs”; however, all elicited responses were
disadvantages or difficulties in implementing WSP rather than disadvantages of WSP concepts. The results will be presented as challenges in implementing WSPs.
4.2.4 Semi-structured interviews and site visits
Direct communication with participants of the research was designed to gain information about the most relevant activities and costs and gain in-depth understanding of the cost components. During the data collection period, data requirements were adjusted to respond to new information from the participants. Changes in the data collection during the study is acceptable in the given research because the nature of the research is to understand each case individually in as much detail as is feasible (Eisenhardt).
Utility-specific costing data were also collected through site visits, paper documents and interviews. Interviews were performed by e-mail, voice and in-person. All of the in-person
Philippines were interviewed by phone and email. All interview questions asked during the interview are based off of the questions referred to in the questionnaire. Similar to the questionnaire, the varied nature of the types of data obtained necessitated the use of semi-structured interviews.
During the site visits, the researcher requested documentation on any information provided by the participant during the interview.
Staff at WHO country offices acted as translators and investigators in Vietnam and Lao PDR. The objective of the research and issues to be investigated was reviewed thoroughly by phone conversation with staff members in Lao PDR while the staff in Vietnam received text of the research objectives. Staff members at both country offices were familiar with background information regarding WSPs and their respective participants.
4.3
Cost calculation
4.3.1 Approach
Costs were initially organized into two groups: non-recurring and recurring. Non-recurring costs refer to costs not expected to occur again e.g., staff time spent during the development of the WSP. The cost of the WSP development consists of staff time and other resources spent (on consultants, etc.) by either the DWSA or surveillance agency in documenting the system, assessing the hazards, creating process documents, etc. These costs are not expected to recur. Recurring costs refer to continuous resource inputs e.g., the cost of annual training sessions. Recurring costs or cost savings are sustained changes in resource expenditures by the water utility or surveillance agency due to findings from the WSP.
All DWSAs in the study except Yarra Valley Water obtained technical assistance from aid agencies, government agencies and non-governmental organizations such as the WHO at no expense to the DWSA. The value of these resource costs are included and noted separately. This is done to attempt to capture the cost of WSP implementation for those suppliers that may not be able to obtain the no-cost technical assistance.
All cost information was organized by country into a Microsoft Excel document. The cost calculations described below were performed within the spreadsheet. All monetized values should be seen as an approximate value within a range of estimates rather than a precise value.
4.3.2 Accounting for inflation and local currencies
All monetized values are presented in 2009 international dollars. Cost information was received by participants in the local currency units during the year of the expense; therefore, adjustments are made to account for inflation and convert local currency to international dollars. Given the year the fixed costs were incurred, all costs were converted to real terms using a GDP deflator. The GDP deflator is a price index of all goods produced domestically and measures changes in the price level of GDP relative to real output. It is used to adjust for inflation. All local currency units were converted to international dollars using purchasing power parity exchange rates.
To inflate or deflate dollars into 2009 dollars, the nominal dollars are multiplied by the ratio of the GDP deflator of the year the analyst would like to inflate or deflate to and the GDP deflator of the same year as the nominal dollars. For example, if 1999 dollars were converted to current 2009 dollars the following formula would be applied:
All currencies were converted to 2009 international dollars, and were then converted to international dollars using purchasing-power parity (PPP) exchange rates to enable cross-country comparison. 2009 international dollars were used because this was the most recent year for which there was information on PPP exchange rates. PPP is “the number of currency units required to buy goods equivalent to what can be bought with one unit of the currency of the base country or with one unit of the common currency of a group of countries. The PPP may be calculated over all of GDP, but also at levels of aggregation, like capital formation” (United Nations). The PPP exchange rate is the number of units of local currency required to purchase similar, quality adjusted, goods and services as one unit of currency in a reference country. The use of PPP assumes the existence of the same goods in both economies and covers all of GDP to include both traded and non-traded goods. Monetary values of different currencies can be made comparable by either market exchange rates of purchasing power parity exchange rates. Expounding on the reasons for choosing one over the other is outside of the scope of this research. However, PPP was used primarily because market rates are relevant only for internationally traded goods and because local labor was one of the largest costs, PPP was thought to be more suitable.
4.3.3 Staff time costs
All staff time costs were derived from received or estimated salaries of staff and units of time spent. In calculating time costs occurring over past time intervals, salaries were assumed to remain the same in real terms. The salaries were multiplied by staff hours spent to derive a total staff time cost. Cost figures from before 2009 were then inflated to 2009 local currency units and converted to international dollars.
Recurring costs were collected in terms of annual costs in local currency. These figures were assumed to remain constant and were converted into international dollars.
4.3.4 Capital costs
Capital goods are defined in this research as physical inputs lasting more than a year. Capital costs require sustained operation and maintenance inputs to maintain functionality. Operation and maintenance costs are simulated by a recurring cost equivalent to 3% of the total paid price of the capital. Where financing mechanisms are used to pay off large capital costs these costs are annualized over the lifespan of the capital. The annual payments are calculated using the equation below. The annualized costs presented here should not be used for long-term projections because it is understood the annual costs are subject to change and these changes are likely to occur before the end of the lifetime of the capital improvements.
Annual payments for paying off capital are calculated using the following equation:
,
where, and
The capital goods found in the study DWSAs range from large projects such as establishing intakes and pipe-laying to smaller ones including purchasing of monitoring equipment. The lifespan of the capital good was based on the lifespan estimates of water supply equipment published by the New Zealand Ministry of Health (Ministry of Health) in Table 4. The weighted-average interest rate used in the analysis is 5%.
Table 4: Lifespan estimates for water supply equipment. Adapted from the New Zealand Ministry of Health, 2007
Equipment Normal
lifespan
Buildings, concrete or steel structures, buried pipes 50-100 years Pumps, valves, switchboards and similar equipment 15-20 years
Instruments and controls 10-15 years
4.3.5 Activity costs
Activity costs include any other non-labor and non-capital costs associated with a given activity. For example, increased cleaning solution costs are activity costs expected to follow from increased tank cleaning activities. Efforts were made to include all associated costs of activities. It is noted where this was not possible or costs were otherwise not parsed.
4.4
Analysis
Figure 2: Data were categorized into categories. Benefits were divided into theoretically mutually exclusive categories.
4.4.1 Developing benefit categories
Table 5: Benefit categories developed based on the perceived benefits of the participants
Benefit category Description
Improved core functions Improvements to the functions immediately necessary for the provision of water.
Improved ancillary functions Improvements to the functions that increase the efficiency or effectiveness of the core functions.
Improvement enabler An effect resulting in the opportunity for further improvement of other benefit categories.
Motivation, morale and assurance
An effect resulting in increased motivation, morale and self-assurance of the safety of the supplied water.
Improved water
supply/quality indicators
Improved rates of water supply indicators e.g. pressure, chlorine residual, indicator organisms, etc.
Financial Improvement creating immediate financial opportunity or stability
Community perception and relationship
Improvements in the quality of the community‟s perceptions of and relationships with the DWSA.
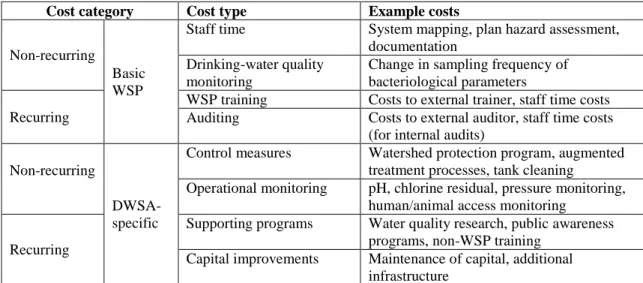
4.4.2 Developing cost categories
Cost categories were developed based on cost types found to be important in HACCP costing literature. Maldonado et al. ordered the importance of different costs of implementing HACCP based on survey responses from enterprises in the Mexican meat industry. Cost types are listed here in decreasing importance: investment in new equipment, external consultants, staff time in documenting system, structural changes to plant, managerial changes and staff training (Maldonado et al.). A similarly designed study of the UK dairy processing sector included the same cost types; however, the order of importance was different from the Maldonado study. HACCP cost types are organized into “pure process control aspects” and costs of “specific interventions” (Jensen, Unnevehr and Gomez; Roberts, Buzby and Ollinger). Krieger, Schiefer and da Silva (2007) similarly categorize food quality system costs by „system induced‟ and „process dependent‟. System refers to the food quality
operational monitoring, supporting programs, and capital improvements. Although these cost types describe activities that are universal to all utilities, considered here are new activities (control measures, operational monitoring, etc.) due to the WSP implementation. DWSA-specific costs are largely costs of achieving water assurance and represent costs of activities or expenditures that are required to provide a consistent and adequate supply of safe water.
Table 6: Cost categories adapted from those used in HACCP costing studies of the food industry
Cost category Cost type Example costs
Non-recurring Basic WSP
Staff time System mapping, plan hazard assessment, documentation
Drinking-water quality monitoring
Change in sampling frequency of bacteriological parameters
Recurring
WSP training Costs to external trainer, staff time costs Auditing Costs to external auditor, staff time costs
(for internal audits)
Non-recurring
DWSA-specific
Control measures Watershed protection program, augmented treatment processes, tank cleaning
Operational monitoring pH, chlorine residual, pressure monitoring, human/animal access monitoring
Recurring
Supporting programs Water quality research, public awareness programs, non-WSP training
Capital improvements Maintenance of capital, additional infrastructure
Basic WSP and DWSA-specific activities each have costs that occur once, or periodically. Costs are separated in this manner because they represent different units of analysis. The cost categories and associated cost types and examples are included in Table 6.
4.4.3 Developing DWSA groups
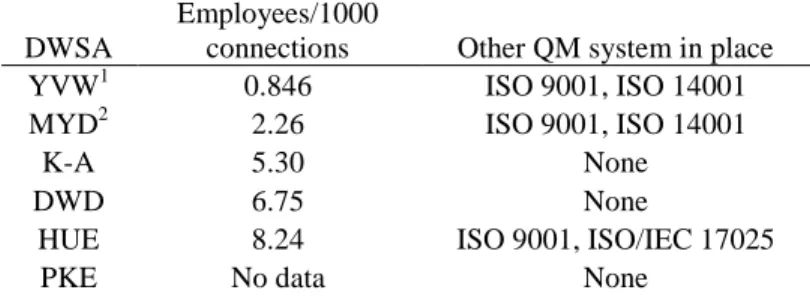
maintains total quality management system. The DWSA characteristics used to determine the DWSA groups are listed in Table 7.
Table 7: Measures of efficiency and effectiveness used to determine the DWSA categories.
DWSA
Employees/1000
connections Other QM system in place YVW1 0.846 ISO 9001, ISO 14001 MYD2 2.26 ISO 9001, ISO 14001
K-A 5.30 None
DWD 6.75 None
HUE 8.24 ISO 9001, ISO/IEC 17025
PKE No data None
1
Scope of operations does not include abstraction or primary treatment and includes wastewater distribution.
2
Scope of operations includes wastewater management.
On this basis, Yarra Valley Water and Maynilad were included as „developed‟ DWSAs. Appendix 2B contains a table listing other key characteristics of the DWSAs.
4.4.4 Case study analysis: explanation building procedure
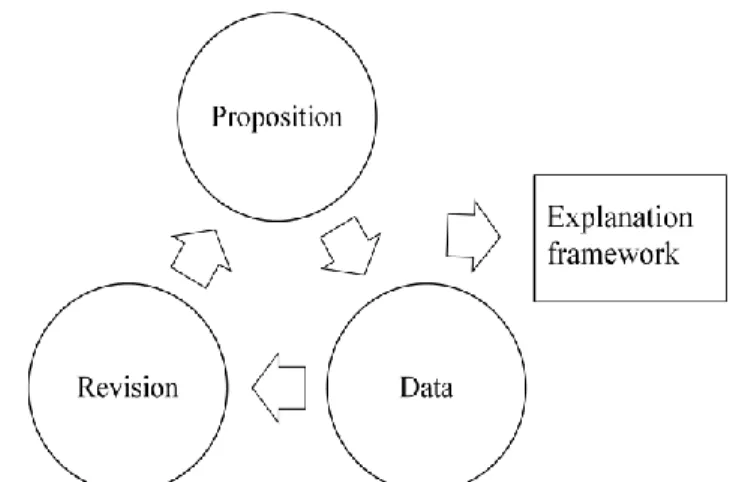
contextual information (e.g. high costs were due to many research undertakings). Repeated comparisons among the data produce numerous explanations that create an explanation framework that is true among all cases and addresses the study question. A conceptual model of the process is seen in Figure 3. This technique allows for the initial hypothesis of the research to be different from the final explanation. The goal of this process is not always to answer the initial proposition, but to develop the idea for further study (Yin).
Figure 3: A conceptual model of the explanation building procedure.
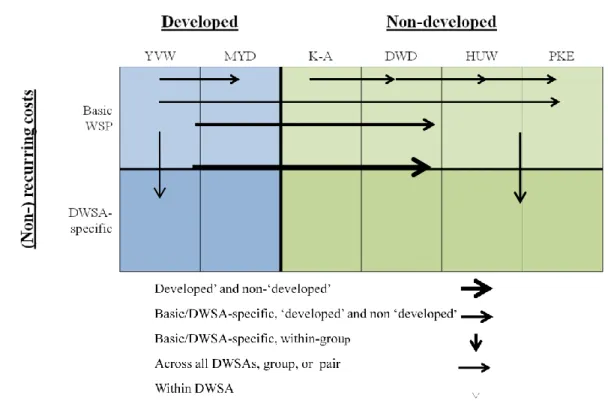
Comparisons between the proposition and the data make use of patterns across the case studies, groups of case studies or other data category. The types of possible comparisons are seen in Figure 4.
Figure 4: Diagram of the types of comparisons made in the explanation building procedure.
5
Results
5.1
Perceived benefits of WSP implementation
Benefits collected from the participants YVW (Yarra Valley Water), MYD (Maynilad), K-A (Koror-Airai), DWD (Dasmariñas Water District), HUE (Thua Thien Hue Water Supply & Sewerage Company), PKE (Pakse Provincial Water Supply State-Owned Enterprise) are listed by benefit type (Table 9). Commonly perceived benefits include: Improved record keeping, documentation and formalization of procedures and activities; more focused monitoring and reporting; systematic identification and prioritization of risks and control measures; improved understanding of the distribution system, and potential factors affecting water quality; risk mitigation; and assurance to DWSA of water quality. A more complete description of the benefits is included in Appendix 2C.
Table 8: Table of benefits types with benefit categories
YVW MYD K-A DWD HUE PKE Benefit type
Benefit category
X X Reduced water quality incidents Is
X Reduced chlorinator failures Cf
X Reduced plant down time Cf
X X Improved maintenance of positive system pressure
Is
X Enhanced backflow and cross-connection prevention
Af
X Improved information database Af
X X X
Improved record keeping, documentation and formalization of procedures and activities
Af
X Improved senior management involvement Ie X Improved communication within the utility Ie
X Improved communication with other
stakeholders
Cp
X X X More focused monitoring and reporting Af
X X X Systematic identification and prioritization of risks and control measures
Ie
X X X X Improved understanding of the distribution system, and potential factors affecting WQ
Ie
X Non-reliance upon end-product testing Ie
X X X Risk mitigation Af
X Better asset management Fi
X X Improved regular maintenance (lower op costs)
X Improved operational monitoring capability Af X X Safe water benefits to consumer Sw
X X Improves relationship/image with community
Cp
X X Demonstrating to community Cp X Decreases in water turbidity Is X pH consistently within standards Is
X Improved water quality Is
X Sound economic practices Fi
X Provides contingency plan Af
X Improved response time to failures Af X X X Assurance to DWSA of water quality Am
X Identifies opportunities for capacity building
Ie
X Places renewed emphasis on NRW program Fi X Improved financial opportunities Fi
X Improved diligence of staff Am
X Adherence to SOPs Cf
X Clean water to attract tourists Other
X Continuous supply Is
X Control of source water pollutants Af
X Prevention of post-treatment recontamination
Cf
X Improved residual chlorine results Is
Note: Abbreviations used in Table 9.
DWSAs Benefit categories
YVW Yarra Valley Water Cf Improved core functions
MYD Maynilad Water Services, Inc. Af Improve ancillary functions K-A Koror-Airai Public Water Supply Ie Improvement enabler
DWD Dasmariñas Water District Am Assurance, motivation and morale HUE Thua Thien Hue Water Supply & Sewerage Company Is Improved water quality indicator PKE Pakse Provincial Water Supply State-Owned
Enterprise Champassack
Fi Financial
Cp Community perception and relationship
The benefits for surveillance agencies (the Philippine Department of Health - PDoH, the Environmental Quality Protection Board -EQPB and the Hue City Preventive Medicine Center – HuePMC) were not analyzed, and are included in Table 10.
Table 9: Benefits perceived by surveillance agencies.
PDoH EQPB HuePMC
X X Stakeholders have uniform plan fostering collaboration
X Potentially reduces number of compliance parameters
X X Safe water for public health X Creates compliance plan
X Assists (DWSA) in obtaining support from lending institutions
X Demonstrates greater focus on protecting water
5.1
Costs of WSP implementation
An accounting approach was used to study WSP implementation costs in six DWSAs in Australia, Lao PDR, Palau, the Philippines and Vietnam and four surveillance agencies. A summary of costs to DWSAs itemized by WSP step is included in Appendix 2A. Cost summaries for the surveillance agencies were not developed as some of the recorded costs were directly attributable to WSP implementation. Detailed costing for DWSAs and surveillance agencies are included in Appendix 2C. A summary of costs itemized by cost category are included in Table 11 and are presented as costs per connection in Table 12.
Table 10: Cost categories for all six case studies presented in international dollars
YVW MYD K-A DWD HUE PKE Basic WSP
non-recurring 72,890 74,650 Unknown 14,010 16,560 2,740 Basic WSP recurring 41,290 2,420 Unknown 660 32,200 1,220 DWSA specific
non-recurring 0 0 138,33 8,390 60,360 1,880 DWSA specific
recurring 51,610 0 10,400 19,060 2,247,580 13,170 Total non-recurring 72,890 74,650 138,330 22,400 76,920 4,620 Total recurring 92,900 2,420 10,400 19,720 2,279,780 14,390
Table 11: Cost categories for all six case studies in international dollars per connection
YVW MYD K-A DWD HUE PKE Basic WSP
non-recurring 0.106 0.0796 Unknown 0.141 0.112 0.0309 Basic WSP recurring 0.0602 0.0026 Unknown 0.0066 0.218 0.0125 DWSA specific
DWSA specific
recurring 0.0752 0 2.20 0.192 15.2 0.134 Total non-recurring 0.106 0.0796 29.3 0.225 0.520 0.0502 Total recurring 0.135 0.0026 2.20 0.199 15.4 0.147
5.2
Relationships between DWSA characteristics and WSP implementation
benefit and cost types
The explanation building procedure was used to develop understanding about the relationship between the DWSA characteristics and the types of benefits and costs incurred during WSP implementation. The procedure results in an explanation framework presented here as a narrative. The narrative describes evidence for the DWSA costs of WSP implementation. Regarding costs, inherent in these results are the relative magnitudes of the cost types.
5.2.1 Benefits of WSPs
Benefits were organized into benefit categories and analyzed for patterns. A pattern does not readily emerge after comparing the data with the proposition.
5.2.2 DWSA-specific costs
5.2.3 Basic WSP, non-recurring costs
Basic WSP, non-recurring costs capture the one-time cost of activities thought to be necessary to develop WSPs and implement its core functions. The ratio between the highest and lowest values in international dollars per connection is 4.6 – the lowest of all four cost categories (Table 13). These costs are found to be the most predictable of all cost types for developed and non-„developed‟ DWSAs. Comparison across DWSA groups reveals no pattern supporting the proposition that more „developed‟ DWSAs will incur lower Basic WSP, non-recurring costs. Explanation for the consistent costs is found in the composition of the cost category. Staff time and WSP training make up the majority of the Basic WSP non-recurring costs for all DWSAs and are the most prevalent cost types in all cost categories.
Table 12: Ratio between the costs of the highest and lowest DWSAs in each cost category.
Basic WSP non-recurring 4.6
DWSA-specific non-recurring 1,526
Basic WSP recurring 84.5
DWSA-specific non-recurring 202
5.2.4 DWSA-specific, non-recurring costs
The original proposition holds when comparing the DWSA-specific, non-recurring costs across DWSA groups. There are no DWSA-specific, non-recurring costs for the „developed utilities because many of the WSP „findings‟ were already put in place by other programs and systems such as the Business Planning program at YVW and the ISO 9001 management systems at YVW and MYD.
Figure 5: The percent contribution of Basic WSP and DWSA-specific costs to non-recurring costs. The DWSA-specific costs of non-‘developed’ DWSAs consisted of supporting program and capital costs.
5.2.5 Basic WSP, recurring costs
The Basic WSP, recurring costs varies widely across all DWSAs. This pattern does not support the proposition. The source of the variation is determined by the degree to which Basic WSP
activities are implemented rather than the level of „development‟ of the DWSA (Figure 6).
Figure 6: Basic WSP recurring costs by DWSA. Significant variation exists among both 'Developed' and non-‘developed’ DWSA.
0% 10% 20% 30% 40% 50% 60% 70% 80% 90% 100%
YVW MYD K-A DWD HUE PKE
Basic WSP Supporting program Capital cost 0.00258 0.00664 0.0125 0 0.01 0.02 0.03 0.04
YVW MYD K-A DWD HUE PKE
$ / y ea r / c o n n ec tio n DWSA
YVW incurs Basic WSP costs due to staff time, training, and auditing. YVW staffs a HACCP coordinator who allocates 10% of their time to plan maintenance along with 10 other staff allocating 5% of their time throughout the year. Ongoing training costs include payment to a trainer as well as staff time costs of being trained. YVW audits their HACCP plan externally by hiring a third-party auditor (as per regulations) twice a year as well as internally using staff time. Additionally, annual reviews of the HACCP plan cost YVW additional staff time. MYD‟s Basic WSP costs are composed of annual external audits and biennial internal audits. Both are indicated to audit the WSP and the ISO 9001 together. MYD currently has no plan maintenance or training activities. The within-group difference between YVW and MYD is explained by the difference in the degree of implementation of Basic WSP activities. This pattern holds throughout all other DWSAs as indicated the Basic WSP costs. HUE has both WSP training and external auditing costs and PKE has training costs for a trainer and staff time. HUE‟s DWQM costs due to WSP implementation are $17,000 and account for roughly the half of the Basic WSP costs. After removing this cost, HUE‟s Basic WSP
costs/year/connection are still more than 10 times higher than MYD and five times higher than DWD which does not have an auditing or training schedule. Table 14 enumerates the number of Basic WSP cost types incurred by each DWSA.
Table 13: Number of Basic WSP activities/cost types by DWSA. Cost totals correlate with the number of Basic WSP activities, or the degree of implementation.
Basic WSP cost type
(recurring) YVW HUE PKE DWD MYD K-A
Staff time X X X X Unknown
DWQM X X Unknown
WSP training X X X Unknown
Auditing X X Unknown
5.2.6 DWSA-specific recurring costs
The non-„developed‟ DWSA-specific recurring costs are higher than those of the „developed‟ group. This pattern supports the original proposition. Further within group comparison shows that for the non-„developed‟ group, the DWSA-specific costs are larger than the basic WSP costs and form the majority of the recurring costs (Figure 7). The ratio of the DWSA-specific to Basic WSP costs/connection is 28.9, 69.7, and 10.8 for DWD, HUE and PKE respectively. DWSA-specific costs are also highly variable. The recurring costs are composed of capital costs, operational monitoring and supporting programs. This pattern indicates that total recurring costs in non-„developed‟ DWSAs are sensitive to DWSA-specific activities, predominantly operational monitoring and capital costs.
Figure 7: Recurring costs for non-'developed' DWSAs primarily consist of capital and operational monitoring costs.
5.2.7 DWQM costs
HUE and PKE experienced increases in DWQM costs as a result of WSP implementation. There were no cost changes in DWQM programs at YVW, MYD and DWD. MYD had indicated they were
-40% -20% 0% 20% 40% 60% 80% 100%
K-A DWD HUE PKE
Basic WSP
currently testing at or above the level required by the Philippine National Standards for Drinking Water. DWD noted changing their DWQM program because of the Philippines National Standards for Drinking Water and saw no reason to change the sampling frequency. However, DWD changed the location of sampling points based on information learned in the system description step of the WSP. There is no data regarding changes in DWQM costs due to WSP implementation at K-A. There is no discernable relationship between WSP implementation and changes in DWQM costs.
6
Discussion
6.1
Results
Benefit types received from participants in this study were similar to those identified in the literature. This work attempted to organize the benefits based on the primary or initial point in the system where the benefit was detected and discern patterns between the benefit categories and the development of the DWSA. No pattern readily emerged which suggests the benefits may be specific to characteristics other than those identified by the DWSA categories („developed‟ and
non-„developed‟). Perceived benefits are also thought to be different depending upon the type of
respondent (e.g. water quality manager, technician, CEO). The basis for the categorization of benefits was primarily developed by the researcher as there was little organization of the benefits applying directly to WSP/HACCP in water supply. It is recognized that the development of a pattern is highly dependent upon the information gained from the participants. Benefits can be intangible and not countable. They apply to an aspect of a system and can propagate subsequent benefits identified at other parts of the system making it difficult to quantify discrete „benefits‟. The understanding of any patterns is highly dependent upon the conceptual basis of the categories.
differences resulted from the extent to which external service providers were used and the degree to which WSP steps were already completed prior to the formal beginning of WSP development. Cost pattern explanations for recurring Basic WSP costs, however, were consistent with the findings of this research. The costs of Basic WSP are very low considering annual total operations and maintenance expenditures of YVW, MYD, K-A and DWD. DWSA-specific costs have been difficult to estimate concretely in the food industry precisely because of its context dependence. These results validate the application of costing categories and techniques from HACCP studies in the food industry to WSP studies.
MYD and DWD, at the time of the study noted WSP improvements were not executed. MYD‟s WSP includes several capital improvements that had yet to be completed at the time of the research (Appendix 2C). DWD indicated funding for larger capital improvements and technical capacity were obstacles to the implementation of a non-revenue water program and internal training and auditing programs respectively. A preliminary evaluation of HACCP implementation in Iceland shows limited resources as a challenge to implementation of auditing functions (Gunnarsdottir). This suggests that financial and technical capacities limit the implementation of both Basic and DWSA-specific implementation costs. However, the developed DWSAs in the Martel study found that the benefits of HACCP outweighed its costs and continued to be audited and registered each year (Martel et al.). While WSPs may identify and prioritize investment areas requiring large capital inputs, DWSAs may find it difficult to mobilize the proper resources to address them. This consideration is more relevant for non-‟developed‟ DWSAs as the findings show DWSA-specific capital, supporting program and operational monitoring costs are significantly larger than Basic WSP costs and account for a majority of the recurring costs of WSP implementation. Predicting DWSA-specific costs for individual non-„developed‟ DWSAs may prove to be difficult given the variable nature of these costs.
PKE were not obtained. DWQM costs did increase for two surveillance agencies: the Preventive Medicine Center in Hue and the Environmental Quality Protection Board. At the Hue PMC, the baseline sampling frequency and the sampling frequencies after flooding increased. At the EQPB in Palau, the sampling of chemical parameters increased while the sampling frequency for microbial parameters did not change. The analysis for the chemical sampling is done by a non-EQPB
laboratory and is relatively expensive for EQPB. Previously, chemical sampling was not performed, but because the WSP emphasized the need to monitor, it is budgeted to occur.
6.2
Limitations
Limitations on the results of the research stem from data quality, case selection and determining the definition of a WSP cost.
Relative to the other case studies, sources of evidence from PKE and HUE were limited. Convergence of multiple sources of evidence is important in qualitative research to improve the validity of the data. Cost explanations in these DWSAs were limited and the costing results should be interpreted with caution.
A majority of the selected case studies were involved in an ongoing WSP program under the WHO. Although there was significant diversity in the level of „development‟ of DWSAs, the selected cases may not support analytic generalization of the results. Costing results for individual DWSAs should be interpreted relative to the other DWSAs in the study.
The factors determining when and to what extent DWSA‟s implement WSP findings are unknown. MYD and DWD at the time of the study noted several WSP improvements that were not executed. MYD‟s WSP includes several capital improvements that have yet to be completed
Furthermore, these results may be biased toward the explicitly WSP-related costs such as those included in the Basic WSP category. DWSA-specific costs are predominantly activities that are regularly performed by the DWSA, it may be more difficult to parse these costs from regular operation, whereas the Basic WSP costs may be easier to identify. Detailed financial information of the DWSAs may contain such information, but may not be feasible to obtain.
6.3
Areas of future research
Further research may seek to improve or standardize the conceptual basis for the benefit categories used to analyze the data. To further explore the relationship among the benefits, one may categorize the benefits as Basic WSP and DWSA-specific in a manner similar to the costs. However, this would require a strong conceptual basis that may be adapted from other qualitative fields of research. The types of perceived benefits are also expected to vary based on the position of the research participant in the DWSA (water quality manager, technician, and CEO, etc.), future qualitative studies may benefit from performing focused interviews with participants at different levels of each DWSA. Similarly, future studies will benefit from a variety of sources of evidence using multiple qualitative research approaches. The quality and number of sources of evidence should be consistent across each DWSA.
The results from this research provide a more refined system of hypotheses for understanding WSP implementation costs. This can be used as a basis for further inquiry into the relationship between DWSA characteristics and WSP implementation costs. The creation of more comprehensive or alternative group of DWSAs may refine the resolution of results. Future studies should endeavor to create a case selection strategy with a strong analytical basis. The case studies should be
analytically representative and cost results should be compared to validate or refute existing cost hypotheses.
magnitudes. For this reason, a more extensible study should have a means of accounting for the various levels of implementation for both Basic WSP and DWSA-specific costs. This is made difficult because WSPs are evolving documents and should be continuously identifying areas of improvement. Amount of time passed since the „implementation‟ of the WSP may be a proxy for degree of implementation. An alternative measure of the degree of implementation may be relative to the original WSPs schedule of improvements.
Improvements such as WSPs have the potential to increase society‟s welfare; therefore, a more complete analysis would include costs and benefits of groups outside of DWSAs and surveillance agencies. For decision makers seeking to expand those with standing to include more groups, an economic analysis of costs and benefits should be the chosen method of study. The financial costing performed in this analysis can be used as a precursor to such a cost-benefits analysis. These results provide insight into the relationships between DWSAs and costs. This provides a theoretical basis upon which larger scale quantitative studies can base their costing assumptions. Analogous HACCP
studies in the food industry have quantified costs and benefits of quality management regulations at larger scales in (Antle and Crutchfield et al.) and produced guides for doing so in (Krieger, Schiefer and da Silva) and (MacDonald, J. M. and Crutchfield, S.). Significant lessons can be learned from the quantitative approach of performing cost-benefit analyses for HACCP regulation.
7.
Conclusion
of reticulated systems from Australia, Lao PDR, Palau, the Philippines and Vietnam. Costing practices are adapted from HACCP costing studies from the food industry to illustrate the types and magnitudes of WSP costs. A case study data analysis procedure called explanation building is used to develop an explanation framework for the relationship between DWSAs and WSP costs. This
research contributes to the very small body of empirical WSP cost studies; provides an evidence base to improve WSP cost estimations and future studies; and validates the adaptation of select HACCP costing practices to WSP costing studies.
The results show no readily understandable pattern in the types of benefits accruing to different types of DWSAs. Among the case studies, drinking-water quality monitoring costs are not found to be influenced by the implementation of WSPs. One-time development costs of a quality assurance program such as a WSP are generally low and predictable regardless of level of development of the supplier. However, costs of maintaining quality assurance will vary depending on the degree to which the basic water safety plan activities have been implemented. The costs of achieving water safety are low for developed DWSAs on account of the existing programs that have implemented appropriate measures to achieve an adequate and consistent supply of safe water. Less developed DWSAs experience large and highly variable capital and operational monitoring costs that are fundamental to achieving safe water supply. These results further indicate future study in the relationship between DWSA characteristics and costs may not improve the WSP implementation costs of individual, less developed DWSAs because of the inherent variability in these costs.