Title
Latitude, temperature, and habitat complexity predict predation pressure in eelgrass beds across the Northern Hemisphere
Permalink
https://escholarship.org/uc/item/6nv524g5
Journal
Ecology, 99(1)
ISSN
0012-9658
Authors
Reynolds, PL Stachowicz, JJ Hovel, K et al.
Publication Date
2018
DOI
10.1002/ecy.2064
Peer reviewed
eScholarship.org Powered by the California Digital Library
1
Latitude, temperature and habitat complexity predict predation pressure in eelgrass beds
1
across the Northern Hemisphere
2
3
Pamela L. Reynolds1,2, John J. Stachowicz1, Kevin Hovel3, Christoffer Boström4, Katharyn 4
Boyer5, Mathieu Cusson6, Johan S. Eklöf7, Friederike G. Engel8, Aschwin H. Engelen9, Britas 5
Klemens Eriksson8, F. Joel Fodrie10, John N. Griffin11, Clara Hereu12, Masakazu Hori13, 6
Torrance Hanley14, Mikhail Ivanov15, Pablo Jorgensen12, Claudia Kruschel16, Kun-Seop Lee17, 7
Karen McGlathery18, Per Olav Moksnes19, Masahiro Nakaoka20, Mary I. O'Connor21, Nessa 8
O'Connor22, Robert J. Orth2, Francesca Rossi23, Jennifer Ruesink24, Erik Sotka25, Fiona 9
Tomas26,27, Richard K.F. Unsworth11, Matthew A. Whalen1, J. Emmett Duffy2,28 10
11
1. University of California, Davis, CA USA; 2. Virginia Institute of Marine Science, Gloucester 12
Point, Virginia USA; 3. San Diego State University, San Diego, CA USA; 4. Åbo Akademi 13
University, Finland; 5. San Francisco State University, San Francisco, CA USA; 6. Université du 14
Québec à Chicoutimi, Canada; 7. Stockholm University, Sweden; 8. University of Groningen, 15
the Netherlands; 9. CCMAR, Universidade do Algarve, Portugal; 10. University of North 16
Carolina at Chapel Hill, Chapel Hill, NC USA; 11. College of Sciences, Sweansea University, 17
Wales, UK; 12. Universidad Autonoma de Baja California, Mexico; 13. Fisheries Research and 18
Education Agency, Japan; 14. Northeastern University, Nahant, MA USA; 15. St. Petersburg 19
State University, Russia; 16. University of Zadar, Croatia; 17. Pusan National University, Korea; 20
18. University of Virginia, Charlottesville, Virginia USA; 19. University of Gotenburg, Sweden; 21
20. Hokkaido University, Japan; 21. University of British Columbia, Vancouver, Canada; 22. 22
2
Montpellier, France; 24. University of Washington, Seattle, WA USA; 25. College of 24
Charleston, Charleston, SC USA; 26. Oregon State University, Corvallis, OR USA 27. Instituto 25
Mediterráneo de Estudios Avanzados, UIB-CSIC, Spain; 28. Tennenbaum Marine Observatories 26
Network, Smithsonian Institution, Edgewater, MD USA. 27
28
ABSTRACT
29
Latitudinal gradients in species interactions are widely cited as potential causes or 30
consequences of global patterns of biodiversity. However, mechanistic studies documenting 31
changes in interactions across broad geographic ranges are limited. We surveyed predation 32
intensity on common prey (live amphipods and gastropods) in communities of eelgrass (Zostera 33
marina) at 48 sites across its Northern Hemisphere range, encompassing over 370 of latitude and 34
four continental coastlines. Predation on amphipods declined with latitude on all coasts but 35
declined more strongly along western ocean margins where temperature gradients are steeper. 36
Whereas in situ water temperature at the time of the experiments was uncorrelated with 37
predation, mean annual temperature strongly positively predicted predation, suggesting a more 38
complex mechanism than simple increased metabolic activity at the time of predation. This 39
large-scale biogeographic pattern was modified by local habitat characteristics; predation 40
declined with higher shoot density both among and within sites. Predation rates on gastropods, 41
by contrast, were uniformly low and varied little among sites. The high replication and 42
geographic extent of our study not only provides additional evidence to support biogeographic 43
variation in intensity, but also insight into the mechanisms that relate temperature and 44
biogeographic gradients in species interactions. 45
Key words: biogeography, latitude, Zostera, seagrass, species interactions, predation,
3 temperature, mesograzer
47
INTRODUCTION
48
Predation pressure is greater at lower than higher latitudes for many taxa, from fishes to 49
marine invertebrates, ants, and birds (Vermeij 1987; Schemske et al. 2009; Freestone and Osman 50
2011). Declines in the strength of predation and other interactions with latitude have been 51
implicated as either a cause or consequence of latitudinal gradients in biodiversity (Dobzhansky 52
1950). However, despite a long history of investigation, the extent to which these gradients 53
represent a monotonic decline with latitude versus a simple difference between higher and lower 54
latitudes remains unresolved because most studies rely on extreme differences between tropical 55
and extra-tropical or temperate regions (Novotny et al. 2006; Pennings et al. 2009; Freestone et 56
al. 2011). Many factors co-vary between high and low latitudes, and most studies offer relatively 57
sparse geographic coverage of intermediate latitudes (but see Harper and Peck 2016; Roslin et al. 58
2017). Thus, it can be difficult to infer the underlying causes of ecological variation correlated 59
with latitude and whether they result from discrete differences between environments versus 60
factors that change continuously with latitude. 61
While numerous processes may drive latitudinal gradients in species interactions, perhaps 62
the most fundamental is temperature, which generally declines with latitude and affects 63
metabolic rates, demography, and ecological and evolutionary processes (Sanford 2002; 64
O’Connor et al. 2011; Dell et al. 2014; Schluter 2016; Edwards et al. 2010; Manyak-Davis et al. 65
2013). While a wealth of data is available on biogeographic patterns in population abundance, 66
traits, and diversity, standardized comparisons of communities and species interactions are much 67
rarer. Geographic variation in predation strength may be an important driver of community 68
4
interactions across wide latitudinal gradients (Moles et. al 2016). Thus, understanding the drivers 70
of predation risk at multiple scales remains an important challenge for understanding variability 71
in the strength of biotic interactions. 72
Eelgrass (Zostera marina) is a key foundation species in estuaries and coastal seas across 73
the northern hemisphere (30° to 67° latitude), and thus provides a unique opportunity to test 74
latitudinal gradients in ecological processes within communities of a single habitat-forming 75
species, minimizing potential confounding factors in prior biogeographic studies. Like other 76
seagrasses, eelgrass provides many important functions and services in coastal ecosystems, 77
forming complex, productive habitats for abundant and diverse organisms (Duffy et al. 2014; 78
Cullen-Unsworth et al. 2014) as well as model systems for testing community interactions across 79
spatial scales (Nelson 1980; Virnstein et al. 1984; Orth et al. 1984; Heck and Wilson 1987; Heck 80
and Crowder 1991). Small invertebrate mesograzers are key trophic links in these communities, 81
and often act as mutualists, facilitating seagrasses via selective grazing of their algal competitors 82
(Valentine and Duffy 2006; Duffy et al. 2015). Thus, understanding and predicting global drivers 83
of top-down pressure on these epifauna may have strong implications for seagrass ecosystems. 84
To quantify and mechanistically explore variation in predation pressure on seagrass 85
epifauna with latitude, we used a comparative-experimental approach of standardized field 86
surveys and predation assays in 48 eelgrass communities across the species’ range. We measured 87
predation pressure on the two major types of common seagrass-associated mesograzers 88
(amphipods and gastropods) across latitudinal gradients, and explored the potential role of local 89
and global environmental factors on predation. These taxa represent two distinct functional 90
groups (amphipods are generally more mobile and less defended than their shelled gastropod 91
5 top-down control (Östman et al. 2016).
93
METHODS
94
To assess biogeographic patterns in predation in Zostera marina habitats, in the summer 95
of 2014 we conducted a series of surveys and assays of epifaunal predation within 48 eelgrass 96
beds across the Northern Hemisphere (see Appendix S1). All eelgrass beds were in shallow 97
water (0 – 3 m water depth at low tide), and were typically monospecific Zostera marina. We 98
measured the intensity of predation on two live, locally abundant mesograzers species (1 species 99
in the Order Amphipoda, 1 shelled species in the Class Gastropoda) by tethering one individual 100
of each locally abundant species within each of twenty 1 m2 plots per site and recording presence 101
or absence of these prey after 24 hours. We also quantified habitat structure (plant biomass, 102
shoot density, morphology), and characteristics of the epifaunal community (abundance, species 103
richness, body sizes) within each plot using standardized methods, described below. Most sites 104
were surveyed in mid-summer; exact sampling times were based on local site logistics and 105
known system dynamics to target peak productivity. 106
Predation assays: Locally collected live prey were tethered and deployed within each
107
experimental plot for 24 hours to quantify predation intensity. We glued individual prey to a 10 108
cm piece of monofilament (Fireline™; dia. 0.13 mm) tied to a stake (Fig. S1). One prey stake per 109
individual prey (a replicate) was deployed adjacent to a live Zostera marina shoot within field 110
plots. While the species tethered at each location varied (Table S1), individuals within and across 111
sites were similar in size (mean = 10.7+4.6 S.D. mm for 773 amphipods and 6.5+3.40 S.D. mm 112
for 711 gastropods measured from field deployments), were commonly found in surveys, and are 113
known to be eaten by local mesopredators. All stakes were retrieved after 24 hours and prey 114
6
were removed from the analysis. To test whether missing prey might result from failure of the 116
glue binding the prey to the tether, we held a subset of 5-10 prey per site in a flow-through 117
mesocosm, bucket of seawater, or predator exclusion field cage for 24 hours. Water flow did not 118
vary appreciably among sites (see Duffy et al. 2015) and no prey detached from tethers in the 119
control trials; thus all missing prey were assumed to be due to predation. Missing stakes were 120
rare and were not included in the analysis. 121
Environmental surveys: In conjunction with the predation assays, we also surveyed
122
characteristics of the eelgrass community and recorded in situ temperature and salinity 123
measurements. We quantified seagrass shoot density within each plot by counting all shoots per 124
1 m2 plot for sites with low seagrass density (less than 50 shoots/plot), or all shoots within a 125
haphazardly placed smaller quadrat (314 cm2) for sites with higher seagrass density. We assessed 126
seagrass biomass from two cores (20 cm diameter, 20 cm deep) per plot. Cores were cleaned of 127
sediment, separated into below-ground (root, rhizome) and above-ground (shoot, leaf) tissues, 128
and dried in an oven at 60°C until there was no change in mass. We collected a 3-cm length from 129
one healthy inner leaf from each of five randomly distributed Zostera marina shoots per plot and 130
processed these samples for tissue nitrogen as a proxy for site-level nutrient status 131
(Burkholder et al. 2007) using a CHN analyzer (Thermo Fisher Scientific Inc., Waltham, MA). 132
We also removed and sorted to species all macroalgae from each plot, and dried these to constant 133
weight.We collected epifauna from Zostera marina shoots in the center of each plot by placing a 134
fine mesh bag over the seagrass and cutting it at the sediment surface (see Reynolds et al. 2014). 135
Epifauna were preserved (in 70% ethanol or frozen), identified to species or lowest taxonomic 136
resolution, and counted. We determined size class (a proxy for body size) for all specimens using 137
7
epifauna, we deployed Gee-style minnow traps for 24 hours at 13 of our study sites and 139
determined catch-per-unit-effort (CPUE, Appendix Table S1). In addition to water temperature 140
measured during field work at each site, we retrieved estimates of annual mean sea surface 141
temperature (SST) from the surrounding region provided by NASA and made available in the 142
Bio-ORACLE dataset (Tyberghein et al. 2012, 9.6 km2 resolution, 2002-2009). We used the 143
raster package in R to extract the annual mean temperature and temperature range from all cells 144
within 10 km of each site, and averaged these estimates to generate site-level predictors. 145
Analyses: We tested the influence of latitude and environmental drivers on predation
146
intensity on amphipods using two sets of generalized linear models at (1) the broad site scale and 147
(2) local scale (up to 20 plots per site) in R (R Core Team 2016). Due to the consistently low 148
predation rates on gastropods (see Results), we constructed models only to predict predation on 149
amphipods, which were sufficiently abundant to tether at 42 of our sites. 150
We first modeled amphipod predation at a given site (N = 42 sites) as a matrix of total 151
successes (prey missing) and failures (prey remaining) with a quasibinomial error distribution 152
and logit link using the lme4 package. This allowed us to weight by sample size per site and to 153
address overdispersion of the data. The following models were constructed a priori (Table 1) 154
using site-level means of environmental variables and compared to predict predation pressure on 155
tethered prey: biogeography (latitude, ocean and ocean margin; models 1-5), abiotic environment 156
(in situ temperature, salinity, and leaf percent nitrogen as a proxy for site-level eutrophication; 157
model 6), temperature regime (regional mean annual water temperature and temperature range; 158
models 7-9), animal community (mobile crustacean density and median body size; model 10), 159
biodiversity (richness of total or crustacean mobile epifauna; models 11-12), and habitat 160
8
macroalgae; model 13). Based on findings from the hypothesis-driven model set, we then 162
constructed two composite models with shoot density and either the interaction of latitude and 163
ocean margin (model 14), or mean annual water temperature (model 15). Salinity and seagrass 164
biomass correlated strongly with latitude and moderately with mean annual temperature, and 165
were thus removed from the composite model set. We compared models using quasi Akaike 166
information criteria (qAICc) values, calculated using the bbmle package in R. A second, plot-167
level analysis used each individual plot (N = 960) as a replicate in a hierarchical mixed model on 168
the plot-level binomial data with site as a random factor to compare the role of local community 169
and habitat characteristics on predation intensity. Data were transformed as necessary to meet 170
model assumptions. The limited predator trap sampling (Table S1) precluded the formal 171
inclusion of secondary consumers in our broader statistical analyses and correlations between 172
predation and CPUEs were evaluated separately. 173
174
RESULTS
175
We found a strong biogeographic signal in predation intensity on amphipods across 42 176
seagrass beds in the Northern Hemisphere, with predation declining monotonically with latitude 177
from 100% consumption at the southernmost sites to ~20% in the north (Fig. 1A). Few 178
gastropods were consumed at most sites (average of 14 + 16% S.D. loss) relative to amphipods 179
(average of 68 + 35% S.D. loss; Fig. 1B). Predation on amphipods did not correlate with 180
predation on gastropods (hierarchical binomial mixed model with plot nested within site, p = 181
0.232) due largely to a lack of variation in predation in gastropods among sites. Although 182
predation on amphipods declined with latitude along all four coasts, it declined more sharply 183
9
along those coasts. Indeed, mean annual water temperature best predicted predation intensity on 185
amphipods (Table 1; Fig 1D). Characteristics of the mobile epifaunal community did not predict 186
predation on amphipods, nor did ambient water temperature at the time the assays were 187
conducted (Table 1). Predation on amphipods decreased with increasing seagrass shoot density 188
(Fig. 1E), and the model that best described our data included both shoot density and mean 189
annual temperature (model 15). The across-site results were consistent with those at the plot-190
scale where shoot density also correlated with reduced odds of predation (Table 2). Unlike many 191
of the other variables, shoot density was uncorrelated with latitude (F1,40 = 2.616, p = 0.1136, R2 192
= 0.61). While total secondary consumer species richness was generally low, the CPUE of fishes 193
(Pearson’s r = 0.42), but not invertebrates (Pearson’s r < 0.01), positively correlated with 194
predation intensity on amphipods (Table S1). 195
196
DISCUSSION
197
Using a comparative-experimental approach within the habitat formed by a single species 198
of seagrass (Zostera marina) across its range, we found a strong latitudinal signal in the intensity 199
of predation on epifaunal amphipods (Fig. 1, Table 1). Latitudinal gradients in species’ 200
abundances and diversity are a general and consistent pattern across many communities (e.g., 201
Dobzhansky 1950; Pianka 1966; Hillebrand 2004). Limited data suggest that species interactions 202
increase in intensity at low compared to high latitudes, but whether this trend is a contributor to 203
the diversity gradient, a consequence of it, or simply driven by the same environmental variables 204
is poorly understood (Schemske et al. 2009). Here, we found a latitudinal signal in predation 205
intensity on a vulnerable prey type (amphipods) compared to an armored prey (gastropods) that 206
10
Predation on amphipods followed a strong latitudinal cline with high predation at low 208
latitudes on both coasts, but a sharper decline with latitude on western compared to eastern ocean 209
margins (Fig. 1C). This correlated with annual mean temperature, whereby thermal gradients are 210
generally steeper on western than eastern ocean margins due to western boundary currents, 211
which move warm tropical waters offshore as they flow poleward and deliver it to the higher 212
latitudes of eastern margins. The importance of ocean circulation and latitude-driven effects of 213
temperature is supported by our modeling results, where the strongest model predicting the 214
strength of predation included mean annual water temperature (Table 1, Fig. 1D). Although a 215
difference in the slope of the predation effect with latitude varied across continental coastlines, 216
statistical confidence in the interaction between latitude and ocean margin was marginal (P < 217
0.10), possibly due to non-linear relationships between latitude and temperature regime and/or 218
our comparatively more limited geographic sampling on western margins. 219
Our results suggest that temperature, or factors related to temperature, may drive 220
increased predation on seagrass epifauna. The failure of ambient water temperature at the time of 221
sampling to explain this variation suggests that the relationship is not simply a direct metabolic 222
correlate, but instead may be related to variation in plant (habitat), epifauna, or consumer 223
assemblage characteristics influenced by the long-term temperature regime. In addition to the 224
influence of regional temperature, we found that increasing shoot density decreased predation on 225
amphipods both across and within sites (Table 1, 2; Fig. 1E), likely because increasing shoot 226
density can reduce detection and capture of mobile prey by active fish and crab predators 227
(Lannin and Hovel 2011; Carroll et al. 2015; Hovel et al. 2016; but see Mattila et al. 2008). 228
Shoot density was independent of both latitude and mean annual water temperature, and thus 229
11
scales. In contrast, plant biomass negatively correlated with latitude, suggesting that its greater 231
potential to serve as prey refuge in low-latitude sites was not strong enough to overcome a 232
latitudinal signal of predation pressure. Thus, a clear prediction of predation intensity at a 233
particular site requires understanding the combined influence of multiple biogeographic (latitude, 234
temperature) and local (shoot density) drivers. 235
Whereas rates of predation on amphipods were generally high and varied with latitude, 236
temperature and shoot density, predation on similarly sized gastropods was consistently very low 237
(Fig. 1B). Similarly, a meta-analysis of experiments in North Atlantic seagrass and seaweed 238
systems concluded that crustacean populations respond more strongly to predation than 239
gastropods and that cascading top-down effects are primarily mediated through crustacean 240
grazers (Östman et al. 2016). The higher predation we observed on amphipods vs. gastropods 241
may arise, in part, due to a preponderance of browsing fishes and fewer crushing crustacean 242
predators in temperate to boreal grass beds. Indeed, surveys of secondary consumer abundance at 243
13 of our sites found over 6.5 times more fish than invertebrate consumers. Additionally, 244
reduced prey value of gastropods versus amphipods, or more rapid consumption by vertebrate 245
than invertebrate predators, may mean that our standardized 24 hour deployment interval was 246
insufficient to capture variability in lower predation rates on gastropods. As a corollary, 247
temperate seagrass beds may provide sufficient refuge to gastropods as to obscure a more general 248
effect of latitudinal variation in predation found in our and other studies. However, the greater 249
abundance of crushing fish predators in the tropics may restore a latitudinal gradient in predation 250
on gastropods across a broader range of habitats (Palmer 1979). 251
In summary, we find consistent latitudinal declines in predation on a common type of 252
12
mean temperature. These strong global gradients in predation pressure can nevertheless be 254
modified by local habitat factors (e.g., shoot density), demonstrating that large sample sizes 255
across continuous environmental and biological variation are needed to adequately capture 256
drivers of latitudinal gradients in ecological patterns and processes. Although we avoided 257
working in degraded seagrass beds, anthropogenic stressors in these habitats (including 258
overfishing, eutrophication, and habitat destruction) are known to strongly influence ecological 259
linkages and should be accounted for when making biogeographic comparisons that inform 260
conservation and management. Because our sites are within temperate communities based on the 261
same foundation species (Zostera marina) and with similar food web structure (eelgrass and 262
microalgae, invertebrate mesograzers, fish and invertebrate predators), our results are less 263
influenced by the biological differences in comparisons between temperate and tropical systems. 264
Thus we suggest that the latitudinal gradient in predation is likely robust, and determined more 265
by thermally-associated community differences than metabolically influenced direct effects of 266
temperature. Whether this mechanistic connection is robust awaits intensive studies like ours, 267
conducted in a range of other systems. 268
269
Acknowledgements
270
This research is supported by NSF BIO-OCE grant 1336206, 1336741 and 1336905 (to JED, 271
JJS, KAH), and in-kind support from author institutions. We thank the numerous staff and 272
students, particularly our “ZENterns,” who assisted with this research (www.ZENscience.org). 273
274
Literature Cited
275
13
of Experimental Marine Biology and Ecology 350: 46–72. 277
Carroll, JM, LJ Jackson and BJ Peterson. 2015. The Effect of increasing habitat complexity on 278
bay scallop survival in the presence of different decapod crustacean predators. Estuaries and 279
Coasts 38: 1569–1579. 280
Cullen-Unsworth, LC, L Nordlund, J Paddock, S Baker, LJ McKenzie and RKF Unsworth. 2014. 281
Seagrass meadows globally as a coupled social-ecological system: implications for human 282
wellbeing.Marine Pollution Bulletin 83: 387–397. 283
Dell, AI, S Pawar and VM Savage. 2014 Temperature dependence of trophic interactions are 284
driven by asymmetry of species responses and foraging strategy. Journal of Animal 285
Ecology 83: 70–84. 286
Dobzhansky, T. 1950. Evolution in the tropics. American Scientist 38: 209–221. 287
Duffy, JE, P-O Moksnes and AR Hughes. 2014. Ecology of Seagrass Communities. In Marine 288
Community Ecology and Conservation (eds MD Bertness, JF Bruno, BR Silliman and JJ 289
Stachowicz). Sinauer Associates, Sunderland, Massachusetts. Pp 271–297. 290
Duffy, JE, PL Reynolds, C Boström, J Coyer, M Cusson, S Donadi, J Douglass, J Eklöf, A 291
Engelen, BK Eriksson, S Fredriksen, L Gamfeldt, C Gustafsson, G Hoarau, M Hori, K Hovel, 292
Katrin Iken, Jonathan S. Lefcheck, PO Moksnes, M Nakaoka, M O'Connor, J Olsen, JP 293
Richardson, J Ruesink, E. Sotka, J Thormar, MA Whalen and J Stachowicz. 2015. Biodiversity 294
mediates top–down control in eelgrass ecosystems: a global comparative-experimental 295
approach. Ecology Letters 18: 696-705. 296
Edwards, KE, KM Aquilino, RJ Best, KL Sellheim and JJ Stachowicz. 2010. Prey diversity is 297
associated with weaker consumer effects in a meta-analysis of benthic marine experiments. 298
14
Freestone, AL and RW Osman. 2011. Latitudinal variation in local interactions and regional 300
enrichment shape patterns of marine community diversity. Ecology 92: 208–217. 301
Freestone, AL, RW Osman, RW, GM Ruiz and ME Torchin. 2011. Stronger predation in the 302
tropics shapes species richness patterns in marine communities. Ecology 92: 983–993. 303
Harper, EM and LS Peck. 2016. Latitudinal and depth gradients in marine predation pressure. 304
Global Ecology and Biogeography 25: 670-678. 305
Heck, KL and KA Wilson. 1987. Predation rates on decapod crustaceans in latitudinally 306
separated seagrass communities: a study of spatial and temporal variation using tethering 307
techniques. Journal of Experimental Marine Biology and Ecology 107:87-100. 308
Heck, KL and LB Crowder. 1991. Habitat structure and predator–prey interactions in vegetated 309
aquatic systems. In: SS Bell, ED McCoy and HR Mushinsky (eds) In Habitat Complexity: The 310
Physical Arrangement of Objects in Space, pp 280–299. Chapman and Hall, New York. 311
Hillebrand, H. 2004. On the generality of the latitudinal diversity gradient. American Naturalist 312
163: 192-211. 313
Hovel, KA, AM Warneke, SP Virtue-Hilborn and AE Sanchez. 2016. Mesopredator foraging 314
success in eelgrass (Zostera marina L.): Relative effects of epiphytes, shoot density, and prey 315
abundance. Journal of Experimental Marine Biology and Ecology 474: 142–147. 316
Lannin, R and KA Hovel. 2011. Variable prey density modifies the effects of seagrass habitat 317
structure on predator–prey interactions. Marine Ecology Progress Series 442: 59–70. 318
Mattila, J, JL Heck Jr, E Millstein, E Miller, C Gustafsson, S Williams and D Byron. 2008. 319
Increased habitat structure does not always provide increased refuge from predation. Marine
320
Ecology Progress Series361: 15-20. 321
15
water temperature in maintaining Bergmann’s rule in a marine ectotherm. The American 323
Naturalist 182: 347–58. 324
Moles, AT and J Ollerton. 2016. Is the notion that species interactions are stronger and more 325
specialized in the tropics a zombie idea? Biotropica 48: 141-145. 326
Nelson, WG. 1980. A comparative study of amphipods in seagrases from Florida to Nova Scotia. 327
Bulletin of Marine Science 30: 80-89. 328
Novotny, V, P Drozd, SE Miller, M Kulfan, M Janda,Y Basset and GD Weiblen. 2006. Why are 329
there so many species of herbivorous insects in tropical rainforests? Science 80: 1115–1118. 330
O’Connor, MI, B Gilbert and CJ Brown. 2011. Theoretical predictions for how temperature 331
affects the dynamics of interacting herbivores and plants. American Naturalist 178: 626-638. 332
Orth, RJ, KL Heck Jr and J van Montfrans. 1984. Faunal communities in seagrass beds: a review 333
of the influence of plant structure and prey characteristics on predator–prey relationships. 334
Estuaries 7: 339–350. 335
Östman,Ö, J Eklöf, BK Eriksson, J Olsson, P-O Moksnes and U Bergström. 2016. Meta-analysis 336
reveals top-down processes are as strong as bottom-up effects in North Atlantic coastal food 337
webs. Journal of Applied Ecology. 53: 1138-1147. 338
Palmer, R. 1979. Fish predation and the evolution of gastropod shell sculpture: experimental and 339
geographic evidence. Evolution 33: 697-713. 340
Pennings, S, C-K Ho, CS Salgado, K Więski, N Davé, A Kunza and E Wason. 2009. Latitudinal 341
variation in herbivore pressure in Atlantic Coast salt marshes. Ecology 90: 183-195. 342
Pianka, ER. 1966. Latitudinal gradients in species diversity: a review of concepts. American 343
Naturalist 100: 33-46. 344
16
mediate transition between microalgal and seagrass dominance. Limnology and Oceanography 346
59: 1053-1064. 347
Roslin, T, B Hardwick, V Novotny, W Petry, N Andrew, A Asmus, I Barrio, Y Basset, A 348
Boesing, T Bonebrake, E Cameron, W Dáttilo, D Donoso, P Drozd, C Gray, D Hik, S Hill, T 349
Hopkins, S Huang, B Oiane, B Laird-Hopkins, L Laukkanen, O Lewis, S Milne, I Mwesige, A 350
Nakamura, C Nell, E Nichols, A Prokurat, K Sam, N Schmidt, A Slade, V Slade, A 351
Suchanková, T Teder, S Noughuys, V Vandvik, A Weissflog, V Zhukovich and E Slade. 2017. 352
Higher predation risk for insect prey at low latitudes and elevations. Science 356: 742-744. 353
Sanford, E. 2002. Water temperature, predation, and the neglected role of physiological rate 354
effects in rocky intertidal communities. Integrative and Comparative Biology 42: 881-891. 355
Schemske, DW, GG Mittelbach, HV Cornell, JM Sobel and K Roy. 2009. Is there a latitudinal 356
gradient in the importance of biotic interactions? Annual Review of Ecology, Evolution, and 357
Systematics 40: 245–269. 358
Schluter, D. 2016. Speciation, ecological opportunity and latitude. The American Naturalist 187: 359
1-18. 360
Tyberghein, L, H Verbruggen, K Pauly, C Troupin, F Mineur and O De Clerck. 2012. Bio-361
ORACLE: a global environmental dataset for marine species distribution modelling. Global 362
Ecology and Biogeography 21: 272-281. 363
Valentine, J and JE Duffy. 2006. The central role of grazing in seagrass ecology. In: Seagrasses: 364
Biology, Ecology and Conservation (eds A Larkum, RJ Orth, C Duarte). Springer, Dordrecht. 365
Vermeij, GJ. 1987. Evolution and Escalation: An Ecological History of Life. Princeton 366
University Press, Princeton, NJ, 527 pp. 367
17
18
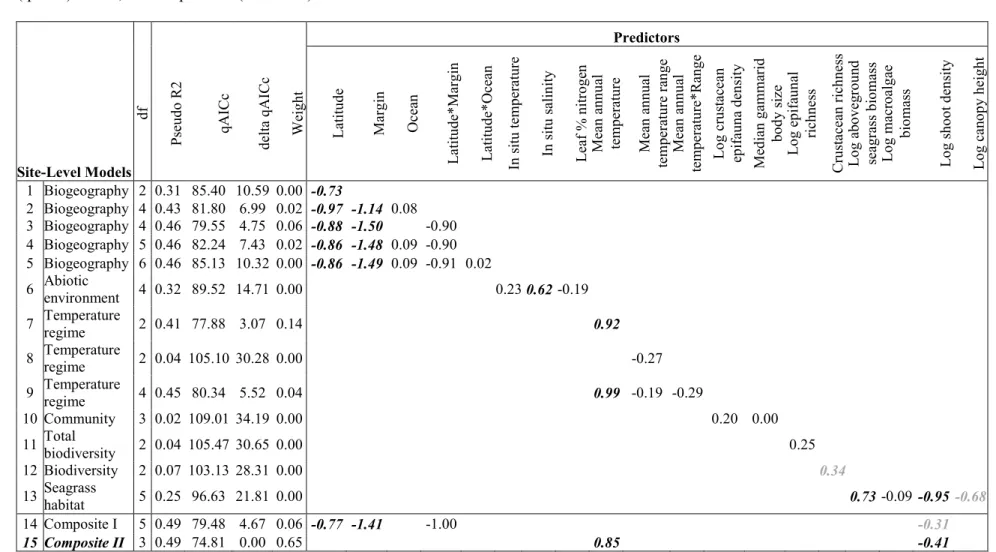
Table 1. Comparisons of candidate quasibinomial (logit link) models estimating components of site-level variation in predation intensity on 370
amphipods across the Northern Hemisphere. Bold italicized numbers are regression coefficients for significant (black, P < 0.05; grey 0.10 > P > 371
0.05) effects of predictor variables. Coefficients are standardized for continuous variables. Based on comparing quasi Akaike information criteria 372
(qAICc) values, the composite II (Model 15) best describes the data. 373 Predictors Site-Level Models d f P se u d o R 2 q A IC c d el ta q A IC c W ei g h t L at it u d e M ar g in O ce an L at it u d e* M ar g in L at it u d e* O ce an In s it u t em p er at u re In s it u s al in it y L ea f % n it ro g en M ea n a n n u al te m p er at u re M ea n a n n u al te m p er at u re r an g e M ea n a n n u al te m p er at u re * R an g e L o g c ru st ac ea n ep if au n a d en si ty M ed ia n g am m ar id b o d y s iz e L o g e p if au n al ri ch n es s C ru st ac ea n r ic h n es s L o g a b o v eg ro u n d se ag ra ss b io m as s L o g m ac ro al g ae b io m as s L o g s h o o t d en si ty L o g c an o p y h ei g h t
1 Biogeography 2 0.31 85.40 10.59 0.00 -0.73
2 Biogeography 4 0.43 81.80 6.99 0.02 -0.97 -1.14 0.08
3 Biogeography 4 0.46 79.55 4.75 0.06 -0.88 -1.50 -0.90
4 Biogeography 5 0.46 82.24 7.43 0.02 -0.86 -1.48 0.09 -0.90
5 Biogeography 6 0.46 85.13 10.32 0.00 -0.86 -1.49 0.09 -0.91 0.02
6 Abiotic
environment 4 0.32 89.52 14.71 0.00 0.23 0.62 -0.19
7 Temperature
regime 2 0.41 77.88 3.07 0.14 0.92
8 Temperature
regime 2 0.04 105.10 30.28 0.00 -0.27
9 Temperature
regime 4 0.45 80.34 5.52 0.04 0.99 -0.19 -0.29 10 Community 3 0.02 109.01 34.19 0.00 0.20 0.00
11 Total
biodiversity 2 0.04 105.47 30.65 0.00 0.25 12 Biodiversity 2 0.07 103.13 28.31 0.00 0.34 13 Seagrass
habitat 5 0.25 96.63 21.81 0.00 0.73 -0.09 -0.95 -0.68 14 Composite I 5 0.49 79.48 4.67 0.06 -0.77 -1.41 -1.00 -0.31
19
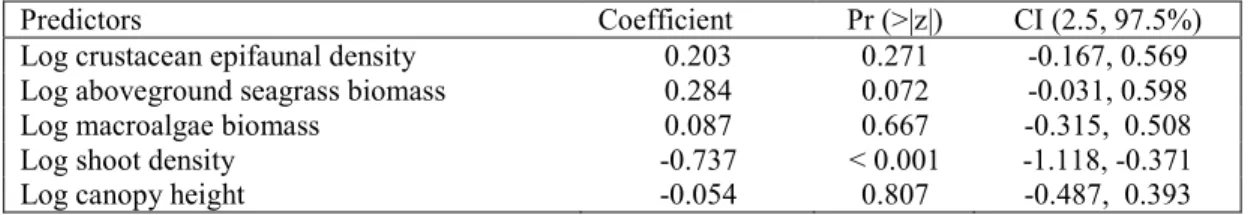
Table 2. Hierarchical mixed binomial model of local(plot-scale) variation in predation intensity
374
on amphipods with site as a random term. (Marginal R2 = 0.112, conditional R2 = 0.403.) N = 42 375
sites and 809 plots. 376
Predictors Coefficient Pr (>|z|) CI (2.5, 97.5%)
Log crustacean epifaunal density 0.203 0.271 -0.167, 0.569
Log aboveground seagrass biomass 0.284 0.072 -0.031, 0.598
Log macroalgae biomass 0.087 0.667 -0.315, 0.508
Log shoot density -0.737 < 0.001 -1.118, -0.371
20
Figure 1. (A) Map of field sites and predation intensity on amphipods from distributed experimental field assays at 42 sites across the
377
Northern Hemisphere with mean annual sea surface water temperature (SST). Adjacent circles represent sites in close geographic
378
proximity. Warmer colors (closer to red) indicate greater predation intensity. (B) Mean predation intensity across sites was greater on
379
amphipod compared to gastropod prey. (C) Predation on amphipods declines more steeply with latitude along western (unfilled
380
symbols) than eastern (filled symbols) ocean margins and (D) increases with annual mean water temperature. Regressions (solid lines)
381
and 95% confidence intervals (dashed line) are fit from model 15, Table 1. (E) Predation on amphipods was negatively correlated with
382
seagrass shoot density after accounting for effects of mean annual temperature.
21
Figure 1. (A) Map of field sites and predation intensity on amphipods from distributed experimental field assays at 42 sites across the Northern Hemisphere with mean annual sea surface water temperature (SST). Adjacent circles represent sites in close geographic proximity. Warmer colors (closer to red) indicate greater
predation intensity. (B) Mean predation intensity across sites was greater on amphipod compared to gastropod prey. (C) Predation on amphipods declines more steeply with latitude along western (unfilled
symbols) than eastern (filled symbols) ocean margins and (D) increases with annual mean water temperature. Regressions (solid lines) and 95% confidence intervals (dashed line) are fit from model 15, Table 1. (E) Predation on amphipods was negatively correlated with seagrass shoot density after accounting
for effects of mean annual temperature.