CAN A MAJOR NATIONAL FOOD RETAILER IMPROVE THE NUTRITIONAL PROFILE OF US PACKAGED FOOD PURCHASES AND REDUCE DIET-RELATED
DISPARITIES?
Lindsey P. Smith
A dissertation submitted to the faculty of the University of North Carolina at Chapel Hill in partial fulfillment of the requirements for the degree of Doctor of Philosophy in the Department
of Nutrition in the Gillings School of Global Public Health.
Chapel Hill 2014
Approved by: Barry Popkin
iii
ABSTRACT
Lindsey P. Smith: “Can a healthy foods initiative at a major national food retailer improve the nutrient profile of US packaged food purchases and reduce diet-related disparities?”
(Under the direction of Barry M. Popkin)
Since 2011, three of the largest national food retailers in the US have implemented healthier food initiatives (HFIs). Yet, no work has evaluated whether an HFI at a major national food retailer actually improves the nutrient profile of food purchases. The objective of this research is evaluate the impact of the food retailer and food-retailer based HFIs on the nutrient profile of US packaged food purchases (PFPs).
Using a dataset of household PFPs, we employed Walmart as a case study to examine the impact of a single food retailer as a food source in the US and who is most likely to shop there. Secondly, using fixed effects models and inverse probability weighting to account for selectivity, we evaluate whether the nutrient profile of Walmart PFPs improved over time. To test whether improvements in the nutrient profile of Walmart’s PFP were attributable to the HFI, we
employed counterfactual simulations to compare the observed nutrient profile of post-HFI purchases to the expected trajectory of nutrient profiles based on pre-HFI trends.
iv
declines were much larger than declines observed in other chain retailers. Hispanics and non-Hispanic Others showed the largest declines in energy density and sodium density.
However, we found that post-HFI shifts in nutrient profile were similar to what would have been expected based on pre-HFI trends, indicating that improvements in the nutrient profile of
v
ACKNOWLEDGMENTS
I would like to thank my advisor, Barry Popkin, for his kindness and encouragement. Barry has the unique ability to perceive his students’ individual strengths and needs, gives us the opportunity to explore our own interests and goals, and pushes us to be our best. I am grateful to have worked for someone who, despite being involved in projects and policies across the globe, clearly cares so much about his students and staff. Thanks also to Shu Wen Ng, who has been an incredible mentor both professionally and personally. Shu Wen is a true role model and friend, and I am certain I am not alone in saying that I aspire to be her someday. Thanks also to Dr. Guilkey, who patiently taught me the basics of econometrics, as well as Dr. Mary Story and Dr. Anna Maria Siega-Riz, who provided insightful feedback throughout this process and
contributed an invaluable nutrition policy framework.
I would also like to thank other current and former members of the UNCFRP team and staff at the Carolina Population Center, including Emily Yoon, the UNCFRP research assistants, Phil Bardsley, Tom Swasey, Jan Hendrickson-Smith, and Lori Delaney. These individuals are not only excellent at their jobs, but always do it with a smile on their faces. I feel so fortunate to work an environment that is not only a productive but a happy place to work. I would especially like to thank Donna Miles, who created all datasets used in this study, cheerfully responds to frantic emails, and often serves a hallway therapist to stressed-out students. You’re the best!
vi
Carolina Batis, Kevin Mathias, Jen Poti, Chris Ford, Lauren Butler, Elyse Powell, and Nancy Lopez. I would also like to thank a few students in particular, Dalia Stern and Beth Hopping. Dalia has been my officemate, coworker, and friend, and provided me with a willing sounding board, a source of encouragement…and a newfound appreciation for the Spanish language. Beth has been my early-morning workout buddy, late-night confidante, and an all-around incredible support system. Thank you both for listening to me and laughing with me (or at me), when I needed it most.
On a personal note, I want to thank my parents, Ann and Nelson Smith, for instilling in me a desire not only to do well, but to do good. Their dedication to their patients, staff, family, and community has long been my inspiration to work hard and to commit myself to public service. I would also like to thank my sister for being such a wonderful friend and cheerleader, despite living 3,000 miles away. I could not ask for a more loving and supportive family.
vii
TABLE OF CONTENTS
LIST OF TABLES ... x
LIST OF FIGURES ... xi
LIST OF ABBREVIATIONS AND SYMBOLS ... xiii
CHAPTER 1. INTRODUCTION ... 1
Background ... 1
Research Aims ... 3
CHAPTER 2. LITERATURE REVIEW ... 5
Food retailers are important allies in the fight against obesity ... 5
Food retailers, food retailer-based HFIs, and nutritional quality ... 5
Secular trends in consumer purchasing and the food retail industry ... 7
Concerns with selection bias when evaluating HFIs ... 8
HFIs and diet-related disparities ... 9
Current strategies for evaluating nation-wide industry initiatives to improve nutrition ... 10
Walmart as a case study ... 10
CHAPTER 3. THE EMERGING ROLE OF WALMART IN US PACKAGED FOOD PURCHASES: WHO SHOPS THERE, HOW MUCH IS PURCHASED, AND PUBLIC HEALTH IMPLICATIONS ... 13
viii
Introduction ... 14
Methods... 16
Results ... 19
Discussion ... 20
Conclusion ... 24
Tables and Figures ... 26
CHAPTER 4. THE NUTRIENT PROFILE OF PACKAGED FOOD PURCHASES AT WALMART AND OTHER CHAIN RETAILERS IMPROVED FROM 2000 TO 2013. ... 31
Overview ... 31
Introduction ... 33
Methods... 36
Results ... 41
Discussion ... 43
Tables and Figures ... 49
CHAPTER 5. CAN A HEALTHY FOODS INITIATIVE BY A MAJOR NATIONAL FOOD RETAILER IMPROVE THE NUTRIENT PROFILE OF US FOOD PURCHASES? ... 69
Overview ... 69
Introduction ... 72
Methods... 75
Results ... 79
Discussion ... 82
ix
CHAPTER 6. SYNTHESIS ... 115
Overview of findings ... 115
Strengths and Limitations ... 119
Significance and public health impact ... 126
Future Directions ... 129
x
LIST OF TABLES
Table 3.1. Household characteristics of the Nielsen Homescan sample by whether or not a household shopped at Walmart from 2000 to
2012a (n=663,073) ... 26
Table 4.1. Household characteristics of the Nielsen Homescan sample
in 2000 and 2013a (n=2,611,125) ... 49
Table 4.2 Percent volume from top food and beverage groups at Walmart
and other chain retailers (OCR), 2000 to 2013 ... 51
Table 4.3. Nutrient density of food groups at Walmart and other
chain retailers (OCR) from 2000 to 2012 ... 52
Table 4.4 Nutrient profile of OCR and Walmart PFPs by Race/ethnicity ... 56
Supplemental Table 4.1. Food and Beverage Groupings, with Examples... 59
Supplemental Table 4.2 Percent volume of PFP groups purchased at other chain retailers (OCR) and Walmart for top 30 food groups,
pooled from 2000-2013... 60
Supplemental Table 4.3. Creation of inverse probability weight ... 61
Supplemental Table 4.4 Year coefficients using different inverse probability
weight approaches ... 63
Supplement Table 4.5 Predicted nutrient Profile of OCR and Walmart PFPs
by Household Incomea ... 67
Table 5.1 Household characteristics of the Nielsen Homescan sample in 2000
and 2013 ... 89
Supplemental Table 5.1 Coefficients for switching regression models of energy
xi
LIST OF FIGURES
Figure 3.1. Percent of PFP food and beverages purchased from Walmart (g)
by percentile among Walmart customers, 2000-2012 ... 27
Figure 3.2. Percent of households who were non-,low, middle, and top shoppers
of PFPs at Walmart by income status and year, 2000-2012 ... 28
Figure 3.3. Percent of households who were non-shoppers or top-shoppers
of PFPs at Walmart by race/ethnicity and income, 2000-2012 ... 29
Supplemental Figure 3.1. Percent of US households shopping at Walmart,
2000 to 2012 ... 30
Figure 4.1: Predicted nutrient density of PFPs purchased from Walmart
and other chain retailers (OCR) from 2000 to 2013 ... 50
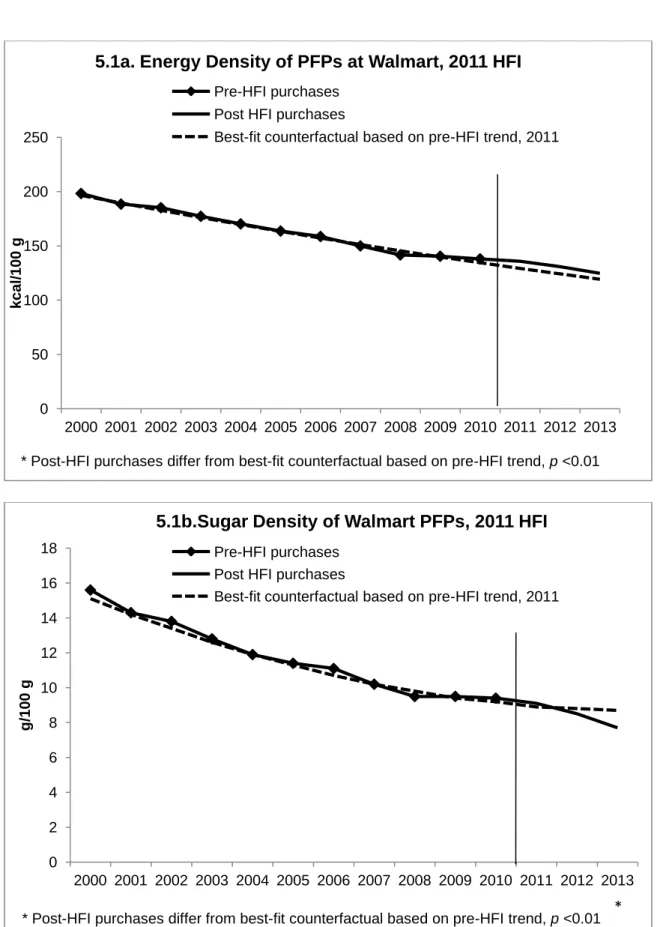
Figure 5.1 Nutrient densities of PFPs at Walmart before and after the 2011
HFI ... 90
Figure 5.2 Nutrient densities of PFPs at OCR before and after the 2011
HFI ... 92
Figure 5.3 Percent volume of key food groups at Walmart before and after
the 2011 HFI ... 94
Figure 5.4 Percent volume of key food groups at OCR before and after the
2011 HFI ... 97
Supplemental Figure 5.1 Nutrient densities of Walmart PFPs, using a 2007
initiation date ... 101
Supplemental Figure 5.2 Nutrient densities of OCR PFPs, using a 2007
initiation date ... 103
Supplemental Figure 5.3 Percent volume of key food groups at Walmart, using
xii
Supplemental Figure 5.4 Percent volume of key food groups at Walmart,
using a 2007 HFI initiation date... 108
Supplemental Figure 5.5 Energy density of PFPs at Walmart, before and after
the 2011 HFI, by race/ethnicity ... 111
Supplemental Figure 5.6 Sodium density of PFPs at Walmart, before and after
xiii
LIST OF ABBREVIATIONS AND SYMBOLS
AFP Average food price
GBD Grain-based dessert
FPL Federal Poverty Level
HFI Healthy Foods Initiative
HWCF Healthy Weight Commitment Foundation
NFP Nutrition Facts Panel
OCR Other chain retailers
PFPs Packaged food purchases
RTE Ready-to-eat
SSB Sugar-sweetened beverage
SNAP Supplemental Nutrition Assistance Program
1
CHAPTER 1. INTRODUCTION
Background
Since 2011, a number of the largest supermarkets in the US have implemented healthier food initiatives (HFIs) to increase the availability and affordability of healthier foods. These retailer-based strategies have major potential to improve the nutrient profile of what US
households purchase and consume, not only because food stores in general provide the majority of daily energy for US children and adults (1, 2), but because national trends towards chain stores and consolidation (3) means that these top retailers account for the majority of US food purchases (4).
2
food retailers during this time period. Finally, HFIs at major national food retailers represent a potential strategy to reduce diet-related health disparities for key subpopulations, such as low-income and minorities, who often have nutritionally poorer diets and less access to healthy foods. Yet, to our knowledge, no one has examined whether HFIs successfully improve nutritional quality of purchases in these key groups.
This study uses Walmart, the US’ largest supermarket, as a case study to examine the impact of the food retailer and food-retailer based HFIs on the nutrient profile of US household packaged food purchases. The overarching goal of this study is to evaluate whether an HFI at a major national retailer can improve the nutrient profile of food and beverage purchases over time, as measured by reductions in energy, sugar, saturated fat, and sodium densities. We use Nielsen Homescan panel data, a longitudinal dataset of packaged food (PFPs) purchased by US households that has been linked to product-specific nutrition information from 2000 to 2013 for over 2.4 million household quarters. Using this data, we first characterized the role of Walmart as source of PFPs in the US, and who is most likely to shop there. Next, using these
3 Research Aims
Aim 1: Examine the role of Walmart as a source of PFPs and describe the profile of Walmart shoppers (2000-2013)
1a. We examined the trends in the percent of US households shopping at Walmart as well as changes in the distribution of percentage of PFPs households purchase at Walmart relative to total food store purchases.
1b. We explored the association between socio-demographic characteristics and who was most likely to buy the most at Walmart, and how these associations changed over time.
Aim 2: Test whether the nutritional profile of Walmart PFPs improved from 2000 to 2013, and whether these changes were greater than trends at comparable food retailers:
2a. We developed time-varying inverse probability weights to account for the potential selectivity bias associated with shopping at Walmart or other chain retailers.
2b. We examined changes in the nutrient profile of Walmart and OCR PFPs over time, including energy, sugar, saturated fat, and sodium density.
2c. We examined whether these changes were driven by shifts in purchasing or reformulation by examining changes in percent volume of food groups purchased, as well as changes in the nutrient profile within these food groups from 2000 to 2013.
2d. We examined whether these changes in nutrient profile were greater among SNAP-eligible or race/ethnic minority households.
Aim 3: Test whether shifts in the nutrient profile were attributable to Walmart’s HFI:
4
nutrient profile of Walmart PFPs to observed post-HFI trends in nutrient profile, and compared these to concurrent trends in the nutrient profile of PFPs at other chain retailers (OCR).
3b. We tested whether the effect of the HFI varied depending on whether Walmart’s stated pre-HFI period (2000-2010) or a data-defined pre-pre-HFI period (2000-2006) was used.
5
CHAPTER 2. LITERATURE REVIEW
Food retailers are important allies in the fight against obesity
Public health experts have increasingly recognized food retailers as potential agents for improving nutrition and preventing obesity, (5, 6) because they provide the majority of daily energy for US children and adults (1, 2), and because of their pivotal positioning between food manufacturers and the public (5, 6). In fact, since 2011, several of the US’ largest grocers have implemented “healthier foods initiatives” (HFIs) to encourage healthier food purchases (7-10). National trends towards chain stores and consolidation (3) means that these top retailers account for about half of all US food purchases (4) and thus have major potential to influence the nutrient profile of US food and beverage purchases.
Food retailers, food retailer-based HFIs, and nutritional quality
6
behavior (25-30). Similarly, studies show that while discounts on healthy foods increase short-term sales, these promotions do not necessarily translate into long-term changes in food intake (31-33).
In addition, most studies examining food retailer HFIs have been in small stores, short-term (~6-18 months of follow-up), with small samples, and limited to a few target foods,
providing little understanding of how long-lasting HFIs at a major national supermarkets impact purchases across the population over time. However, HFIs at major supermarkets, including Walmart, are not short-term interventions, but rather represent a long-term shift in how foods are produced, marketed and sold, creating the need to understand how this shift impacts nutritional quality of purchases over the long term. In addition, most previous studies have been unable to accurately quantify nutritional changes, largely because nutrition information rapidly changes due to product introduction, discontinuation and reformulation (34).
To our knowledge, only one study has examined the impact of an HFI on the nutrient profile of purchases at a major chain retailer. The study examined Guiding Stars, a storewide point-of purchase nutrition navigation intervention which used shelf-labeled star icons to indicate healthier options, in a chain of Northwest supermarkets, using two years of purchase data.
7
Finally, one study examining the effects of a insurer-based HFI in South Africa showed that price cuts or rebates can also be an effective HFI strategy.South Africa’s Healthy Food project offered enrollees at a major national health insurer a rebate of up to 25% on purchases of healthy foods at a national retail supermarket chain, increased self-reported intake of fruits, vegetables, and whole grains, and decreased intakes of high-salt, high-sugar, and processed foods (36, 37). Purchase data showed that over three years, rebates were associated with a 6-9%
increase in healthy food expenditures, suggesting HFIs can impact consumer purchasing over time (38). However, more work is needed to understand whether a multi-component,
supermarket-based HFI will similarly impact food store purchases in the U.S.
Secular trends in consumer purchasing and the food retail industry
Due to their short and singular store nature, most HFI evaluations have not been able to address whether HFIs improve nutritional quality beyond secular trends in consumer purchasing, despite major concurrent changes in consumer purchasing, food manufacturing, and food
8
kcal/day among households with children from 2007 to 212, with additional caloric reductions in non-HWCF purchases and in private-label purchases as well (46).
In addition, major food stores have also implemented HFIs in recent years, such as Kroger’s “Health Matters” program, Safeway’s “SimpleNutrition” program, or Boston
supermarkets’ recent “Healthier Beverage” initiatives (8, 47, 48). Accounting for these secular trends is important in order to determine whether changes in nutritional quality of purchases are actually attributable to the retailer’s HFI and not simply reflections of concurrent trends in food purchasing, manufacturing, or at other chain retailers.
Concerns with selection bias when evaluating HFIs
Shopping choices are driven by a complex set of factors, which not only determine where
a customer shops, but how much they respond to food retailer HFIs. Sample selection bias may arise because the choice to shop at a certain store is non-random. For example, less educated, lower income, and African American individuals more likely to shop at lower-priced
9
In addition, the selectivity of shopping at a certain retailer could vary over time, complicating evaluations of an HFI. For example, if a retailer’s HFI involves cutting prices on fruits and vegetables and offering a wider variety of organic and locally sourced produce, it might attract more health-conscious consumers. If these health-conscious consumers purchase more produce and fewer unhealthy products, the overall nutrient profile of the retailer’s purchases would appear to improve. However, attributing these changes to the HFI would be incorrect, since in actuality the improvements would be driven by the introduction of new customers, and would not reflect meaningful improvements in the nutrient profile of other consumers. Thus, a key concern is whether HFIs are successful at improving nutritional quality of PFP purchases, or if they simply attract a different type of customer. However, no studies to date have employed methods to account for this time-varying selection bias.
HFIs and diet-related disparities
HFIs have potential to reduce health disparities by improving availability and affordability of healthy foods for key subpopulations such as race/ethnic minorities and low socio-economic status households, who tend to have less access to healthy foods (57-59) and nutritionally poorer diets (60-62). In fact, the gap in diet quality between high and low
socioeconomic status appears to have widened over recent years (63), creating a pressing need to address these disparities. Yet, because of small sample sizes and socio-demographically
10
whether HFIs are more effective at improving nutritional quality of purchases among higher educated customers. In particular, no work has examined whether HFIs differentially impact certain types of low-income households, such as households who are eligible to receive or receive supplemental nutrition assistant program (SNAP) benefits, and could potentially benefit the most from increased affordability and availability of healthy foods (71-73).
Current strategies for evaluating nation-wide industry initiatives to improve nutrition
To our knowledge, there have been no independent evaluations of HFIs at major national food retailers. However, as previously mentioned, UNCFRP has been tasked with evaluating a major initiative by the food industry to cut 1.5 trillion calories from the food supply by 2015. As with Walmart’s HFI, the HWCF food companies pledge was nation-wide, which means there is no clear natural experiment or control group to which shifts in calories can be compared. While a simple approach would be to compare pre-initiative trends to post-initiative trends, this approach cannot identify whether observed changes were attributable to the HFI or to concurrent shifts in the economic, socio-demographic, and food retail environments as previously mentioned. To deal with this concern, the UNCFP developed an approach utilizing counterfactual simulations (74-76): what would the nutrient profile of purchases look like if the initiative had not been enacted, if all other factors were held constant (46)? This strategy allows researchers to compare the expected nutrient profile of post-HFI food purchases based on pre-HFI trends to what
actually happened during the post-HFI period, while controlling for secular trends.
Walmart as a case study
11
the US’ largest food retailer, with grocery sales of $114.7 billion in 2013, compared to the second largest retailer, Kroger, with sales of $76.7 billion(4). In 2011, Walmart, pledged to enact a comprehensive HFI to improve the nutritional quality and affordability of Walmart purchases. Walmart’s initiative entails three major components: 1) development of a front-of-package labeling system for Walmart brand store-brand consumer packaged goods (PFPs) that meet specified health criteria; 2) strategic price reductions on healthier items, and 3) product
reformulation of Walmart store-brand products, with goals to achieve elimination of trans fats, a 25% reduction in sodium, and 10% reduction in added sugar in key PFP categories by 2015 (77, 78). Considering that Walmart accounted for 20% of US food store expenditures in 2012 (79), and is among the largest recipient of SNAP spending (80), successful implementation of this HFI could substantially improve the nutritional quality of the US diet and potentially reduce diet disparities.
Rationale for using a dataset of food and beverage purchases
Traditionally, population-level studies of nutrition use large-scale nutrition surveys, such as the National Health and Nutrition survey. Such surveys are advantageous because they are often repeated over time and are nationally representative, allowing for the monitoring of diet intake and diet-related diseases at the population level. However, because their aim is primarily surveillance of nutrition and health, such surveys do not typically collect information about the food retailer where food is purchased; rather, they simply categorize foods by broad
categorizations of source (i.e. home, school, restaurant), precluding the use of such data to evaluate the impact of the food retailer.
12
company actually did, when it was implemented, and how; however, such a partnership also comes with limitations. First, companies are not always eager to partner with outside researchers and second, such relationships could influence objectivity. For example, the Guiding Stars HFI evaluation was funded by the food retailer where the HFI was implemented as well as the company who designed the nutrition navigation program. While such studies can still provide useful data, if HFIs were ever to be considered on a bigger scale, policymakers would also need evidence from independent evaluations, where researchers are not encumbered relationships to businesses, which are typically concerned most about their image and their bottom line.
Considering these limitations, this study employs a third approach, capitalizing on the unique features of the Nielsen Homescan panel data, a longitudinal dataset of household purchases which our team has linked to product-specific nutrition information (Nutrition Facts Panels, or NFPs) for over 2.4 million household quarters from 2000-2013 (34). These NFPs are continuously updated and matched to PFP products, providing a more accurate and
13
CHAPTER 3. THE EMERGING ROLE OF WALMART IN US PACKAGED FOOD PURCASHES: WHO SHOPS THERE, HOW MUCH IS PURCHASED, AND
PUBLIC HEALTH IMPLICATIONS
Overview
Despite a growing focus on the food environment, little is known about the impact of specific food retailers as a food source in the US, especially among low-income populations. We examined purchasing trends among the US’ largest food retailer, Walmart, and whether low-income and race/ethnic minority households are more likely to shop there.Usingnationally representative household purchase data, we analyzed trends in Walmart packaged food purchases (PFPs) from 2000 to 2012. We find that not only do the majority of households buy food at Walmart, the proportion of PFPs purchased from Walmart doubled from 2000 to 2012. Low-income non-Hispanic White and Hispanic households, but not low-Low-income non-Hispanic Black households, were more likely to buy a larger proportion of PFPs at Walmart. We find that a single food retailer—Walmart—is an increasingly dominant source of PFPs, especially among low-income households. As fewer food retailers account for an increasingly large share of PFPs, more work is needed to understand how shifts in the food retail environment affect the
14 Introduction
Consensus among public health and nutrition scholars has been growing about the importance of the food environment for improving our health (81, 82). Perhaps one of the most important elements of this environment is food stores, which supply the majority of daily caloric energy for children and adults (1, 2, 83). Public health experts have increasingly recognized food retailers as potential agents for improving nutrition and preventing obesity (5, 6), in part because of their major role as a source of food and also because of their pivotal position between food companies and the public.
Despite this growing awareness of the food environment, to our knowledge, no research has explicitly examined the role of specific retailers in the US food supply. Yet, an
understanding of the size and scope of food retailers is increasingly important, as the expansion of chains and consolidation (3) has created a food landscape in which fewer retailers are
accounting for a larger share of grocery sales: the top eight grocery retailers accounted for nearly 50% of US grocery sales in 2012, compared to only 26% in 1992 (4).
Moreover, identifying the extent to which a single food retailer serves as a source of the US food supply is an important first step in identifying whether and to what degree food retailers can be leveraged to improve diet quality. Many scholars have noted the need to improve labeling (e.g., front-of-the-package food profiling) and reformulate food products as critical components of improving nutrition and combating obesity (84-90). However, few have actually studied these kinds of initiatives implemented by key food retailers (7, 9, 91), yielding an incomplete
understanding of their potential impact on the nutritional quality of the US diet.
15
constraints on cost and time when choosing where to shop for food (92-96). Previous work has established that less educated, lower income, and African-American individuals are more likely to shop at lower-priced food outlets and supercenters (49, 50), yet no work has examined
whether low-income households are increasingly likely to buy a larger share of their PFPs from a single retailer. Such trends are important to understand, as a greater propensity to purchase a larger share of PFPs at a given food retailer could make these groups more susceptible to retailers’ evolving strategies on the price, product assortment, and product formulation of more- and less-healthful foods.
Perhaps the most influential among these retailers is Walmart, a national supercenter chain that grew from 682 supercenters in 1999 to over 3,000 stores in 2014,(97, 98) and is now the US’ largest grocery retailer (99), accounting for $113.2 billion in food and non-food grocery sales in 2012 (4). Despite a large body of work examining the impact of Walmart’s expansion on wages, jobs, and other food retailers (100-105), to our knowledge, no independent research has examined shifts in packaged food and beverage purchases (PFPs) at Walmart over time. Key questions relate to not only what percent of households shop for food at Walmart, but how much they are buying there: do a small fraction of households purchase a large share of PFPs at
16
The objective of this paper is to quantitatively evaluate the degree to which a single food retailer can serve as a source of PFPs in the US by examining trends in US household PFPs at Walmart from 2000 to 2012. We use a large, nationally representative dataset of household purchases to examine trends in percent of US households shopping at Walmart as well as
changes in the distribution of the proportion of PFPs these households purchase there. Secondly, we examine whether low-income households are more likely to purchase a higher proportion of PFPs at Walmart than higher-income households, whether this has changed over time, and whether the association of low-income with Walmart purchasing is constant across race/ethnic groups.
Methods
This study uses Nielsen Homescan, a commercial dataset containing information on PFPs at the household-quarter level.(107) PFPs include all food and beverages with a barcode,
including all consumer packaged goods as well as packaged fresh fruit and vegetables (i.e. bag of lettuce, bag of potatoes) but excluding unpackaged meat and produce (i.e. an apple).
Participating households use a handheld scanner to record all purchases during each shopping trip. Households are sampled from 76 markets, and weighted to be nationally representative. Households report detailed information on each PFP purchased from outlet channels, including grocery (i.e., Kroger’s, Safeway, etc.), drug, supercenters (i.e. Super Target, Walmart), club (i.e. Sam’s Club), dollar stores, and convenience stores. Because the types of products available may differ by store type, for this study, we include all PFPs from grocery stores, supermarkets, and supercenters (i.e. “other food stores”), and exclude warehouse, drug, club, dollar, and
17
Walmart Neighborhood markets, the latter being smaller in size and assortment while offering a full line of groceries, bakery, and deli items (108). These do not include Sam’s Club and
Walmart Express, which are Walmart’s warehouse and convenience stores, respectively For this study, purchases were aggregated at the year-household level, for a total of 663,073 household-year observations from 158,382 unique households. For each household in each year from 2000 to 2012, we summed the PFPs from Walmart and from other food stores, measured in terms of grams purchased. We measured purchases in grams instead of calories because our key goal was to understand overall trends in the proportion of PFPs purchased at Walmart relative to other food stores, whereas changes in calories purchased reflect both changes in the proportion of PFPs purchased at Walmart as well as changes in the nutrient of foods over time (7, 109). However, sensitivity analyses conducted using caloric purchases from Walmart and other food stores revealed similar trends to those presented here.
Statistical Analysis
All statistical analyses were performed using STATA, version 13 (Stata Corporation, College Station, Texas).
In initial analyses, data were treated as pooled cross-sectional, and weighted to be nationally representative using Nielsen’s projection factors1
. Logistic regression was used to describe changes in the likelihood of shopping at Walmart (i.e., spent >0$ on any PFP at Walmart) for each year from 2000 to 2012. From these models, we compared the predicted percent of shopping at Walmart in each year to 2000. Secondly, in order to examine changes in the proportion of PFPs purchased at Walmart over time, quantile regression was used to examine
1Survey commands (for logistic regression) and probability weights (for quantile regression) were used to adjust
18
the distribution of the proportion of PFPs purchased at Walmart relative to total food store purchases at the 50th, 75th, and 95th percentiles. The predicted percent of PFPs purchased at Walmart in each year was compared to 2000.
Secondly, to examine the association between income, race/ethnicity, and proportion of PFPs purchased at Walmart, households were divided into quartiles of Walmart shopper, based on the distribution of proportion of PFPs purchased at Walmart in 2012. On average, non-shopper households purchased 0% of PFPs from Walmart (range 0.0% to 0.3%), low non-shopper households purchased 3% (range 3.0% to 7.2%, medium shoppers purchased 18% (range 7.2% to 33.9%), and top shoppers purchased 68% (range 33.9% to 100%) of PFPs from Walmart. Multinomial logistic models included household race (Hispanic White, Hispanic, non-Hispanic Black, and non-non-Hispanic Other) and household income [low <185% Federal Poverty Level (FPL), medium 185-400% FPL, high >400% FPL]. These models controlled for head of household education (≤ high school degree, some college,≥ college degree), household type (single adult, multiple adults with no kids, adult(s) with kid(s)) and household composition (numbers of men or women aged 19-29, 30-39, 40-49, 50-59, ≥60y, and numbers of boys and girls aged 0-1y, 2-5y, 6-12y, 13-18y).
19
Additional models tested interactions of income and year, and income and race/ethnicity, using Wald “chunk” tests for joint significance of interaction.(110) Robust cluster variance estimators were used to adjust the standard errors to reflect the non-independence of households who remained in the sample across time.(111, 112) For each model, STATA’s margins
command was used to estimate the predicted percent of households in a shopper category for each income, race/ethnic, or year combination. All analyses were Bonferroni-corrected for multiple comparisons, and statistical significance was set at p<0.01 for main effects and p<0.05 for interactions.
Results
Household demographic characteristics of the sample are presented in Table 3.1. Walmart-shopping households were more likely to have children, be less educated, be non-Hispanic White, and have a low- or middle- income.
The percentage of US households who shopped for PFPs at Walmart increased from 71% in 2000 to 82% in 2012 (p <0.01) (Supplemental Figure 3.1). Among households who shopped at Walmart, the proportion of PFPs purchased at Walmart also increased substantially from 2000 to 2012 (Figure 3.1). The median Walmart-shopping household nearly doubled the proportion of PFPs purchased from Walmart, from 10% in 2000 to 19% in 2012 (p <0.01). Increases in the proportion of PFPs purchased from Walmart were even greater at the upper end of the
distribution. In particular, households in the 95th percentile of Walmart shoppers increased the proportion of PFPs purchased at Walmart from 56% in 2000 to 85% in 2012 (p <0.01).
20
and low-shoppers between 2000 and 2012 (Figure 3.2). However, low-income and middle-income households showed a bigger decline than high-middle-income shoppers: the proportion of low shoppers declined by 12%, 10%, and 7% for low, middle, and high-income households, respectively (p <0.05 for interaction). Similarly, while all income levels showed an increase in the proportion of households who were top shoppers, low and middle-income households showed larger increases than higher income households, with increases of 21%, 18%, and 15% of households in the top shopper category from 2000 to 2012 for low, middle, and high-income households, respectively (p <0.05 for interaction).
Across all time periods, there were minimal differences in the likelihood of being a non-, low, middle-, or top- Walmart shopper by race/ethnicity. The only clear difference was that non-Hispanic Blacks were less likely to be non-shoppers than non-non-Hispanic Whites (24% vs. 28%, respectively [p<0.01]) (not shown). However, as shown in Figure 3.3, there was a significant interaction between race/ethnicity and income level. For non-Hispanic Whites, Hispanics, and non-Hispanic Others, high-income households were more likely to be non-shoppers than low-income households, and low-low-income households were more likely to be top shoppers than high-income households. However, amongst Black households, this trend was reversed: low-high-income households were 7% more likely to be non-shoppers than income households, and high-income households were 4% more likely to be top shoppers than low-high-income households (p<0.05 for interaction).
Discussion
21
Walmart’s growing dominance as a source of PFPs has major implications for the nutritional quality of US food purchases, as well as obesity prevention efforts. First, limited evidence suggests that the food available in supercenters may be less healthful than grocery stores or supermarkets (113), although this work was limited to a small geographic region. More convincingly, using a large commercial dataset from 1998 to 2006, Volpe et al. found that consumers purchased less produce and more processed food at supercenters (including Walmart) relative to supermarkets (106). Secondly, because of its size, changes in Walmart’s product assortment, reformulation, and price not only influence the healthfulness of what Walmart customers buy, but what they purchase at other stores as well. For example, Walmart and other supercenters typically offer lower prices (114), which drives down prices at competing stores, including prices of produce, dairy, meat, and packaged goods (50, 115-117).
In fact, some researchers contend that these cost and time savings, particularly for energy-dense, nutritionally-poor processed foods, contribute to excess energy intake and subsequent obesity (118-122). Yet, evidence on the impact of Walmart and supercenters on obesity has been mixed: while one ecological study found that the addition of one Walmart supercenter per 100,000 residents was associated with an increase in the obesity rate of 1 to 2.4 percentage points (123), another ecological study found an inverse association between
supercenters per capita and county-level obesity prevalence (124).
22
(77). Currently, it is unclear whether these initiatives have resulted in improvements in the nutritional quality of consumer purchases. For example, Walmart recently faced criticism for promoting high- sugar, fat, and sodium foods and beverages in its advertisements targeted at low-income customers (127). Future research should examine whether the nutritional quality of PFPs at Walmart differs from similar food retailers, as well whether these purported shifts in product assortment, formulation, and price have improved the nutritional quality of these
purchases. Regardless, the growing dominance of Walmart as a source of US PFPs suggests that it and other major national retailers could be key players in strategies to improve diet and reduce obesity, and should be considered as potentially pivotal agents in efforts to improve the quality of the US food supply.
23
In this study, we found that among non-Hispanic Whites, Hispanics, and non-Hispanic others, low-income households were more likely to shop at Walmart than their higher-income counterparts; however, this trend was reversed for Blacks. It was unclear why income level had a different effect among Blacks compared to other race/ethnic groups. One possibility is that low-income Blacks are more likely to live in areas with no Walmart, or less likely to have
transportation means required to access Walmart. Although we controlled for market as well as whether or not there was a Walmart in the market, some markets cover a wide geographic area and so even if there is a Walmart in that market, low-income Blacks may not be within a
reasonable distance to access it. Previous work has suggested that lower-income rural and inner-city populations have lower access to supermarkets and supercenters than higher-income
populations or those living in suburbs (131-133). Although these studies did not consider differences in access by race/ethnicity, if low-income Blacks are more likely to live in these areas they may be less likely to have ready access to a Walmart than their higher-income counterparts.
24
increased discount-seeking behavior and reduced overall food expenditures (24, 42), the present results show that that the largest increases in Walmart PFP purchases began well before the 2007 economic downturn. Although we did not test the effects of the recession of the recession
explicitly, these increases in Walmart purchasing likely reflect the larger trend towards increased supercenter purchasing that began in the early 2000s and continued during the economic
recovery (24, 139).
Limitations
This study has several important limitations. First, because this dataset included only products with a barcode, we did not examine changes in purchasing at Walmart related to unpackaged fresh produce, such as fruits and vegetables. Because shoppers at Walmart tend to purchase a wide assortment of items, most households who purchase unpackaged fresh produce at Walmart likely purchased other PFPs as well, and would have been included in our estimates of Walmart shoppers. Similarly, we are unable to account for non-food-store changes, including changes in restaurants and prepared food outlets and for cooked unpackaged foods sold at retail food outlets, and how these interact with purchasing behavior at Walmart and other food stores. However, given that US consumers consume about 70% of daily energy from food stores, and this has remained fairly stable from 2000 to 2010 (2), it seems unlikely that changes in away-from-home food purchases impacted our results.
Conclusion
This study shows that a single food retailer is a major source of the US diet: US
25
26 Tables and Figures
Table 3.1. Household characteristics of the Nielsen Homescan sample by whether or not a household shopped at Walmart from 2000 to 2012a (n=663,073)
Walmart non-Shopper
%
Walmart Shopper
% pb
Household composition
Single adult 37% 23% <0.001
Multiple adults, no children
<18y 38% 39% 0.015
Single adult, with children
<18 y 19% 29% <0.001
Adults, with children <18 6% 8% <0.001
Race/ethnicity
Non-Hispanic White 72% 75% <0.0001
Hispanic 11% 10% 0.049
Non-Hispanic Black 11% 11% 0.012
Non-Hispanic Other 6% 4% <0.001
Male household head education
≤High school degree 21% 32% <0.001
Some college 20% 21% 0.45
≥College degree 30% 18% <0.001
No male head of household 29% 29% 0.273
Female household head education
≤High school degree 23% 36% <0.001
Some college 21% 27% <0.001
≥College degree 24% 21% <0.001
No female head of household 32% 16% <0.001
Income levelc
Low 20% 26% <0.001
Middle 32% 40% <0.001
High 47% 34% <0.001
a Column percents. Weighted to be nationally representative. A household was defined as "Walmart shopper" if it spent
>0$ on any consumer packaged food or beverage in a one-year period.
b From proportions testing between Walmart shopping households vs. non-Walmart shopping households.
Bonferroni-corrected for multiple comparisons.
27
Figure 3.1. Percent of PFP food and beverages purchased from Walmart (g) by percentile among Walmart customers, 2000-2012
10 11* 13*
17* 19* 20* 19*
24 28*
34*
42*
47* 47* 46*
56
67*
78* 81*
83* 84* 85*
0% 10% 20% 30% 40% 50% 60% 70% 80% 90%
2000 2002 2004 2006 2008 2010 2012
50th 75th 95th
28
Figure 3.2. Percent of households who were non-,low, middle, and top shoppers of PFPs at Walmart by income status and year, 2000-2012
46 40 41
25 21* 20
35 37 37
28
27* 25*
15 18 17
27
28 29
5 5 5
20 23* 26*
0% 20% 40% 60% 80% 100% 120%
High Income Middle Income
Low Income High Income Middle Income
Low Income
2000 2012
Top Shopper Middle Shopper Low Shopper Non- Shopper
Shopper category defined as non-shopperss: purchased on average 0% of packaged food purchases(PFPs) from Walmart; low purchasers: average 3% of PFPs from Walmart; middle shoppers:18%; top shoppers: 65%. Income status is defined as low, <185% federal poverty level (FPL); middle, 185-400% FPL, and high, >400% FPL.
* Change in the probability of being in Walmart shopper category between 2000 and 2012 is
29
Figure 3.3. Percent of households who were non-shoppers or top-shoppers of PFPs at Walmart by race/ethnicity and income, 2000-2012
31
25
30
28*
23
30* 32
27
15
21
14
16*
20
16* 15
19
0% 5% 10% 15% 20% 25% 30% 35%
High Income
Low Income High Income
Low Income High Income
Low Income High Income
Low Income
NH White Hispanic NH Black NH Other
Non-Shopper Top Shopper
Shopper category defined as non-shopper: purchased on average 0% of packaged food purchases (PFPs) (g) from Walmart top shopper: purchased on average 68% of PFPs from Walmart. Income status is defined as low, <185% federal poverty level (FPL); middle, 185-400% FPL, and high, >400% FPL.
* Change in the predicted percent in Walmart shopper category between 2000 and 2012 is different
30
Supplemental Figure 3.1. Percent of US households shopping at Walmart, 2000 to 2012
71
73*
76* 77* 77*
79* 79* 80*
81* 82* 81* 81* 82*
50% 55% 60% 65% 70% 75% 80% 85%
2000 2001 2002 2003 2004 2005 2006 2007 2008 2009 2010 2011 2012
31
CHAPTER 4. THE NUTRIENT PROFILE OF PACKAGED FOOD PURCHASES AT WALMART AND OTHER CHAIN RETAILERS IMPROVED FROM 2000 TO 2013.
Overview
As fewer retailers account for a larger share of US packaged food purchases (PFPs), it is increasingly important to understand the impact of the food retailer on the nutrient profile of PFPs. In particular, little is known about the nutrient profile of PFPs from Walmart, the US’s largest food retailer, relative to other chain retailers (OCR). Our objective in this aim was to examine shifts in the nutrient profile of Walmart and OCR PFPs from 2000 to 2013. We used a national dataset of household PFPs from Nielsen Homescan linked to nutrition data (n=
164,315). Using fixed effects models and inverse probability weights to account for the selectivity of shopping at Walmart, we examined changes in energy, total sugar, saturated fat, and sodium density and shifts in percent volume from key food groups at Walmart and OCR over time, and whether these shifts differed by income or race/ethnicity.
32
33 Introduction
Public health experts have increasingly identified the food retail sector (e.g.
supermarkets, supercenters, grocery stores, convenience stores) as unique allies in the fight against obesity (6, 140) because they provide the majority of daily energy for US children and adults (1, 2), and because of their pivotal positioning between food manufacturers and the public (5, 6). As more food retailers account for an increasingly large share of US food purchases (3, 4), even a single retailer can have a major effect on what people buy and eat.
In particular, Walmart has become an increasingly dominant source of packaged food purchases (PFPs) in the US: nearly 80% of US households shopped for PFPs at Walmart in 2012. Among those who shopped at Walmart, the share of PFPs purchased doubled from 10% to 20% from 2000 to 2012 (141). Low income households in particular have become more likely to shop there and buy more PFPs over time. Because of Walmart’s increasing importance as a source of US PFPs, it could be a key leader in strategies to improve nutrition and prevent obesity.
However, little is known about whether foods and beverages purchased at Walmart are
nutritionally comparable to those purchased at other chain retailers, or if the nutrient profile of Walmart-purchased foods has changed over time.
34
was associated with a decreased percentage of the adults consuming five servings of
fruits/vegetables per day (142). However, this study used state-level data on Walmart density and diet intake, and was unable to evaluate the effect of Walmart on the nutritional quality of actual household purchases or food intake. Volpe et al. used data on household PFPs, and found that a 1% increase in local market share of supercenters was associated with a 5-22% decrease in healthful food purchases. However, this study, like the previous study, examined the effect of store density on total purchases, rather than the nutritional profile of actual Walmart purchases compared to comparable stores (106). In addition, while the latter study employed a number of approaches for measuring purchase healthfulness, they were unable to directly link PFPs to nutrition information, precluding examination of the actual nutritional profile of products.
35
purchases, since these groups are more likely to shop at Walmart, and also are more likely to nutritionally poorer diets (60-62). Understanding whether Walmart contributes to diet-related disparities is especially salient for administrators of the Supplemental Nutrition Assistance program (SNAP), considering Walmart is among the largest recipient of SNAP dollars spent (80).
This selectivity of shopping at Walmart could also vary over time, as dramatic changes in the Walmart food landscape over recent years could attract a more nutrition-conscious customer, yet previous studies did not consider these changes. Walmart has announced major efforts to increased sales of locally sourced and organic foods (125, 126), and in 2011 announced a national healthy foods initiative (HFI), including the introduction of a front-of-package labeling system, price reductions on healthier foods including produce, and product reformulations to reduce saturated fat, added sugar, and sodium (77). One possibility is that more health-conscious consumers might begin shopping at Walmart as a result of these initiatives. Thus, a second key question is whether the nutrient profile of Walmart PFPs has actually changed over time, or whether changes in nutrient profile simply reflect changes in the type of consumers who shops there.
36
improvements in nutrient profile could help policymakers and interventionists better target their efforts.
The objectives of this study are to examine changes in the nutrient profile of Walmart PFPs over time, including energy density (kcal/100g, total sugar density (g/100g), saturated fat density (g/100g), and sodium density (mg/100g), relative to those purchased at other chain retailers, and whether these changes were greater among SNAP-eligible and race/ethnic minority households after correcting for selectivity. In addition, we will examine whether these changes were driven by shifts in purchasing or reformulation by examining changes in percent volume of food groups purchased, as well as changes in the nutrient profile within these food groups from 2000 to 2013.
Methods
This study uses data from Nielsen Homescan, a commercial dataset of household food and beverage PFPs from 2000 to 2013 (107). PFPs include all food and beverages with a
barcode, including all consumer packaged goods and packaged fresh fruit and vegetables (i.e., a bag of potatoes, which has a barcode) but excluding unpackaged meat and produce (i.e., a single potato, which does not). Households are sampled from 76 metropolitan and non-metropolitan markets. Households use handheld scanners to record information on each PFP, including date, number of units, total weight, amount paid, and including location of purchase (143). Walmart purchases included all PFPs from Walmart Supercenters and Neighborhood Markets, which both include a full-line of groceries, although the latter is smaller in size and assortment (108).
37
Kroger, Safeway, and others (collectively referred to hereafter as “other chain retailers” [OCR]) (362 different retailers), and exclude warehouse, drug, club, dollar, convenience stores, ethnic stores, specialty stores, and independent grocers (<10 locations) (144).
Information on store purchases was linked at the barcode level to nutrition data from the Nutrition Facts Panel (109). Food groups were based on the Nielsen Company, which groups products into 624 modules according to the department in which they are found within the store (for example, tortilla chips and pretzels represent two modules). We then aggregated modules into 56 groups based on how products are consumed (for example, the tortilla chip and pretzel modules are in a group, “Savory Snacks”) (Supplemental Table 4.1).
Nutrient Outcomes
Nutrient outcomes included energy density (kcal/100 g PFPs from that store type), total sugar (g/100 g PFPs), saturated fat (g/100 g PFPs), and sodium (mg/100 g PFPs). To examine shifts in purchasing, we examined shifts in percent volume purchased (% g) from 13 key food groups from 2000-2013. Key food groups included those which represented top food groups purchased by volume at both food stores (Supplemental Table 4. 2) or in some cases, food groups that Walmart has publicly acknowledged to be product categories which have been reformulated (i.e. processed meat, salad dressing).
Market-level Covariates:
Unemployment rate
To provide a proxy for the overall economic environment experienced by each
38
Walmart store density
A key predictor of whether a household shops at a retailer or not is whether that retailer exists within reasonable proximity to the household. To create an average market-level Walmart density (Walmart supercenters per 100,000 people), we used data on dates of Walmart
Supercenter openings and conversions of Walmart discount stores to supercenters, linked by FIPS codes to counties, from 2000-2005 (146, 147). We also used data on Walmart Supercenter and Neighborhood Markets GPS coordinates , again linked by FIPS code, to derive Walmarts per county from 2008-2013 (148). Using these annual county-level estimates of Walmart stores, the number of Walmart food stores per county was interpolated for years 2006 and 2007. These values were then linked by FIPs code to annual mid-year county population estimates from the US Census Bureau to derive county-level Walmart density per 100,000 individuals (149). After linking counties to Homescan markets, we then created an average annual Walmart density score at for each of Homescan’s 76 markets in which respondents reside.
Average Food Prices
To control for price differences between Walmart and other food retailers, we included
two variables which are the weighted average of prices of products purchased (hereafter refered to as average food price [AFP]) from 1) Walmart or 2) other chain retailers in each market in each quarter.
Sample size
39
purchases and the latter represents an implausible purchasing pattern, or for implausible nutrient outcomes, including overall PFP energy density >900 kcal/100 g, sugar density >400 kcal/100g, and saturated or total fat density >900 kcal/gram (n=66,377 observations or 2.5%). Households were then excluded if they had less than 2 quarters of observations (n=2,516 or 0.1%) since repeated observations are required for fixed effects models. The final analytic sample included 2,611,125 household-quarter observations from 164,315 unique households. Households have various compositions, including single adults, adults living together, or adult(s) with children, with 26% having children under age 18 in the house, and an overall mean age of 50 y (± 18).
Inverse probability weight
As previously mentioned, one concern in these models is selectivity, or the idea that those who shop at Walmart may be somehow different than those who do not (141), and that this selectivity could bias the association between purchases and nutritional quality. To address this concern, we used inverse probability weighting (IPW) to account for the likelihood of being a Walmart shopper vs. non-Walmart shopper (no vs. any purchases) in each quarter, conditional upon covariates associated with shopping at Walmart (150-152). Weights were stabilized and truncated at the upper and lower 0.3rd percentile, with a mean of 0.96 ± 0.65 (Supplemental Table 4.3). To test the robustness of estimates to this IPW, we conducted sensitivity analyses without IPW, with the IPW truncated at the upper/lower 0.3rd percentile, and IPW truncated at the upper/lower 1st percentile. Year coefficients remained consistent in terms of both direction and magnitude, regardless of which IPW method was used or if no IPW was used.
40
Statistical Analysis
All statistical analyses were performed using Stata, version 13 (Stata Corporation, College Station, Texas).
Covariates were included based on a directed acyclic graph approach (153-155),
including household race (non-Hispanic White, Hispanic, non-Hispanic Black, and non-Hispanic Other) and whether or not the household was eligible SNAP benefits (household income ≤130% federal poverty level). All models controlled for head of household education (≤ high school degree, some college, ≥ college degree), household type (single adult, multiple adults with no kids, adult(s) with kid(s)) and household composition (numbers of women and men aged 19-49 and ≥50y, and numbers of children aged 0-5y, 6-18y).
We used fixed effects models to separately model all nutrient outcomes at Walmart and OCR, using Stata’s areg command for use with time-varying inverse probability weights. Fixed effects models examine average within-household effects, effectively using each household as its own control and thereby removing potential bias from any unobservable time-invariant household characteristics that might influence both exposure and outcome (i.e. unmeasured confounding). Fixed effects models can also be considered a selectivity correction, if the selection is through fixed characteristics of the household or community, since these characteristics are differenced out. For example, the fixed effects models help account for any selectivity associated with each household’s decision regarding where to live, (i.e. if some households choose to live in markets with more Walmart stores than others). Stata’s margins command was used to predict the mean nutrient density or percent volume from food groups for each year for each retailer. We
examined contrasts in means within each retailer type across years, with significance achieved at
41
race-ethnic households experienced larger changes over time, we used a Wald chunk test to examine the interaction of income or race/ethnicity with year, with significance achieved at p= 0.10.
Results
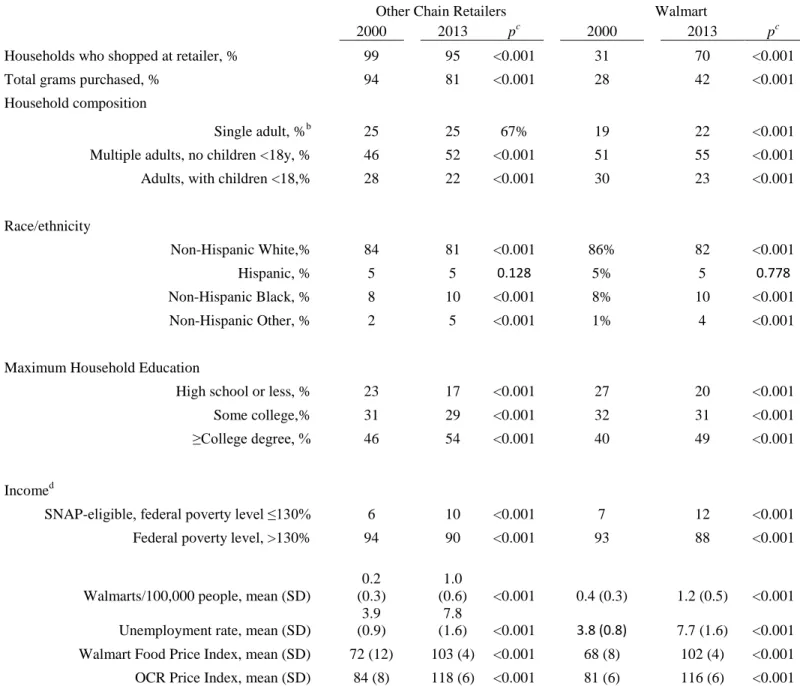
Demographic characteristics
Demographic characteristics of the sample in 2000 and 2013 are presented in Table 4.1. The sample remained predominantly non-Hispanic White, with at least some college education, but more households were SNAP-eligible in 2013 relative to 2000. As expected, the average Walmart density, unemployment rate, Walmart AFP, and OCR AFP all increased over time.
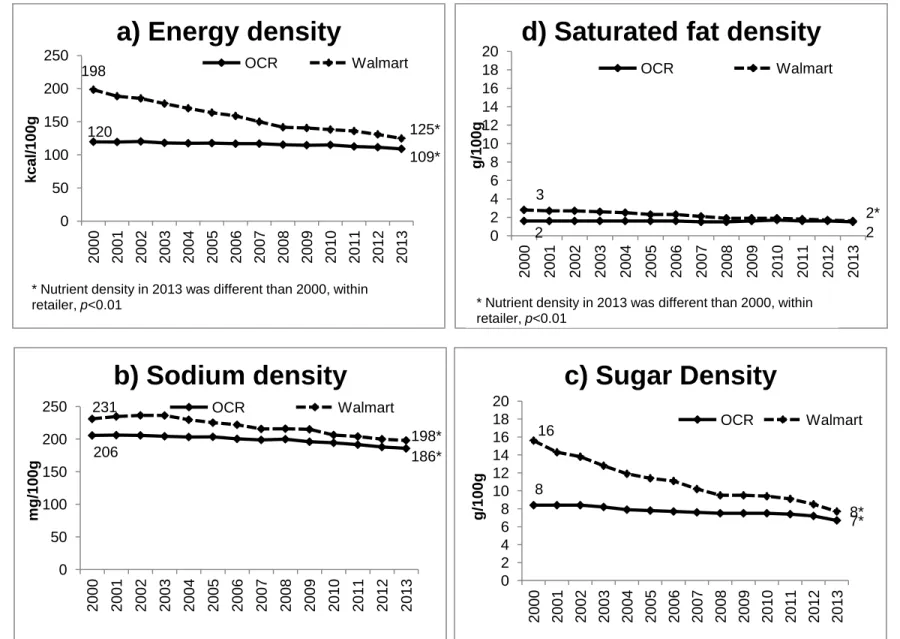
Overall shifts in nutrient profile
Figure 4.1 shows shifts in predicted nutrient density of all food and beverage PFPs from 2000 to 2013. For all nutrient densities, Walmart PFP showed a significant decline between 2000 and 2013, with particularly large declines in densities of energy, sugar, and sodium (p<0.01). However, the average nutrient density of PFPs at Walmart was higher than at OCR in 2000; and despite smaller declines in nutrient densities at OCRs during the same time period, remained higher than OCR in 2013.
Shifts in food and beverage groups
Shifts in the percent volume purchased from key food and beverage groups are shown in
Table 4. 2. Percent volume of grain-based desserts, candy, and savory snacks declined at Walmart from 2000 to 2013, while percent volume from fruits and vegetables increased (p<0.01). Smaller shifts were observed in percent volume from food groups at OCR.
42
percent volume of milk, 100% Juice, and SSBs from OCR. At Walmart, the only significant declines were small decreases in the percent volume of 100% juice and diet beverages.
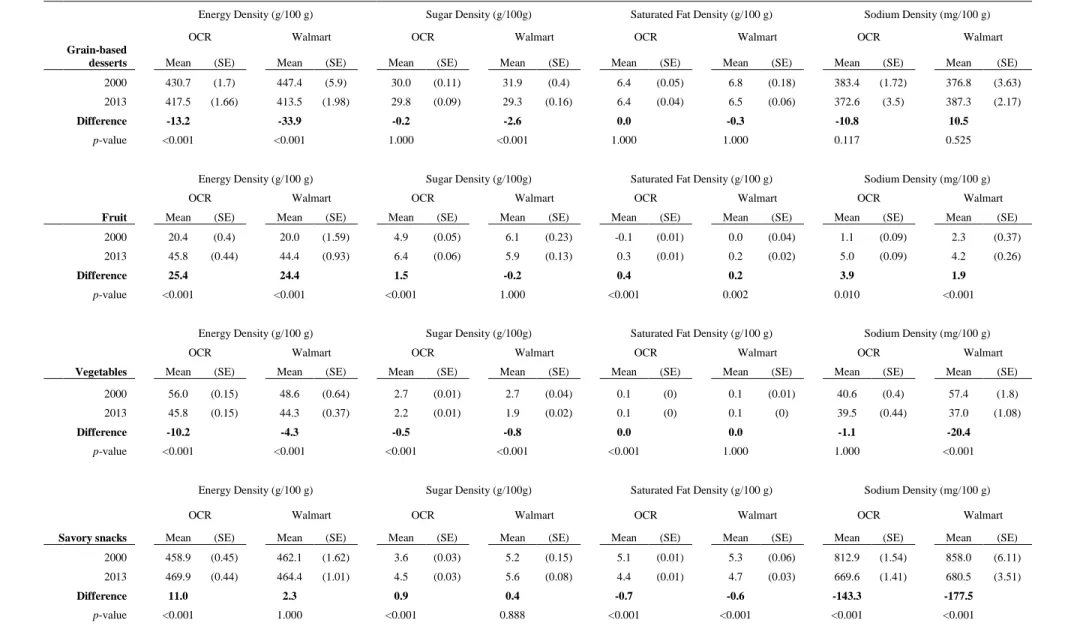
Nutrient Profile of Food Groups and Beverage Groups
Table 4.3 shows the means and changes in the nutrient density of key food and beverage groups at Walmart and OCR.
Grain-based desserts showed major declines in energy density and sugar density at Walmart, while nutrient density of grain-based desserts at OCRs showed smaller decreases over time. Ready-to-eat breads, ready-to-eat breakfast, and candy all showed declines in energy density at both Walmart and OCR, although declines at Walmart were larger. At OCR but not Walmart, savory snacks and processed meats showed small increases in energy density, while the energy density of fruit increased for both Walmart and OCR. Both 100% juice and SSBs showed similar small declines in energy density at both retailers, while the energy density of diet beverages increased slightly.
Examining changes in sodium density, there appeared to be significant declines in sodium for ready-to-eat bread, ready-to-eat breakfast, processed meat, and salad dressing, although these changes looked larger among OCR PFPs relative to Walmart PFPs. On the other hand, the declines in sodium density for savory snacks and vegetables were larger among Walmart PFPs relative to OCR PFPs.
Socio-economic differences
There were no major differences in changes in nutrient profile of Walmart or OCR PFPs for higher income vs. SNAP-eligible households, with the exception that higher income
43
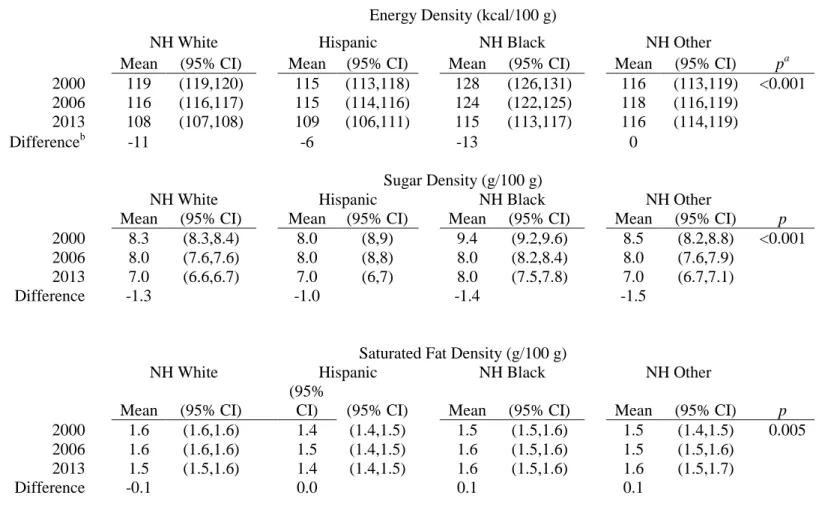
There were statistically significant, but small, differences in declines in nutrient density of OCR PFPs by race/ethnicity, with the relative nutrient profile of purchases of each group remaining somewhat stable over time (Table 4.4). However, among Walmart PFPs, disparities in the nutrient profile of purchases by race/ethnicity shrank over time. For example, while Hispanic and Non-Hispanic Others had the highest energy density and sodium density of Walmart PFPs in 2000, but these showed the largest declines in energy density and sodium density over time (p=0.054 and p=0.052 for interaction, respectively). The exception to this was non-Hispanic Blacks, who had virtually identical sodium density as Whites in 2000, but showed smaller declines in sodium density over time. In contrast, non-Hispanic Blacks also showed the largest decline in sodium density of OCR PFPs (p<0.001 for interaction).
Discussion
This study shows that PFPs from Walmart, the US’s largest food retailer, showed major declines in energy density, paralleled by a decline in sodium and total sugar density, and to a lesser degree, saturated fat; these trends were accompanied by similar but smaller shifts in PFPs from OCR. While we were unable to examine important distinctions in some of the nutrients (for example, distinguishing added sugar from naturally occurring sugars, or saturated fat from dairy vs. meat), declines in saturated fat and sodium densities represent a shift towards a more
healthful nutrient profile in accordance with the 2010 Dietary Guidelines, which suggested limiting saturated fat to 10% of daily calories and cutting sodium intake(156). In addition, since high energy density has been linked to excess energy intake and obesity through poor
44
Moreover, while the healthfulness of food groups can be subjective, declines in groups like grain-based desserts and sweets is promising, considering that considering that candy and grain-based desserts are among the largest sources of added sugar in the US, and grain-based desserts are the top source of solid fats (158). While the increases in fruit and vegetable intake were relatively small, this may be due to the fact that we were only able to examined packaged fruits and vegetables, and we would expect increases to be larger among unpackaged, loose produce, which was the key target of Walmart’s efforts to cut costs and boost sales of locally sourced and organic foods (125, 126). In fact, if households substituted packaged produce with unpackaged produce as the availability and affordability of the latter increased, we might have expected to see the percent volume from packaged produce go down. Yet, our results show that these increases in packaged produce occurred despite a presumptive increase in unpackaged produce purchased. Regardless, the end result was such that while the overall nutrient profile of PFPs at Walmart was “less healthy” in 2000, it became healthier at a faster rate, and was similar to OCR by 2013.
45
store announced their initiative in 2011, the store website indicates that these changes may have begun as early as 2008, possibly explaining some of the observed declines (77, 78). Other HFI components, including the development of a front-of-package labeling system and strategic price reductions on healthier items, could explain the observed shifts in purchasing behavior (11, 14-21).
Our work shows that low income households do not buy disproportionately less healthy foods at Walmart, which may provide reassurance to SNAP that spending benefits at Walmart does not equate with poorer nutrient intakes. We also found evidence that disparities in the nutrient profile of Walmart food purchases lessened over time for race/ethnic minorities,
especially for Hispanics and non-Hispanic Others, who tended to have a “worse” nutrient profile than non-Hispanic Whites in 2000, but a more comparable profile in 2013. These results beg the question as to whether Walmart’s HFI is responsible for the observed improvements in nutrient profile, especially among vulnerable subpopulations. If so, this could indicate that national-scale HFIs at major national retailers can be useful in reducing diet-related disparities in the US population. However, more work is needed to fully understand the real impact of this HFI, especially in light of conflicting evidence about Walmart’s marketing strategies. For example, Walmart recently faced criticism for promoting high- sugar, fat, and sodium foods and beverages in its advertisements targeted at low-income customers (127).
46
found that increased supercenter density (i.e., Walmart density) was associated with less healthful PFPs from 2000 to 2006, but this disparity in healthfulness of purchases between supercenter and supermarket had mostly diminished by 2006 (106). On the other hand, we might have expected to see a “compensation effect,” where consumers purchased less-healthy food groups or higher energy dense products at OCR in response to purchasing healthier PFPs at Walmart. Instead, we see that on average, the nutrient profile of PFPs from other OCRs remained static, suggesting that changes in PFPs at one retailer may not carry over to other retailers where a household shops.
Limitations
One concern is that these results could simply reflect a shift in how people shop at
Walmart: as the years progressed, and people purchased more food at Walmart, they purchased a wider variety of foods, whereas in early years, they may have only purchased non-perishable packaged foods, like candy or snacks. This would result in a decline in energy density of
Walmart PFPs, simply because of either a real or perceived shift in Walmart from discount store to full-grocery supercenter, as more supercenters entered the market and offered a wider
assortment of products. In addition, we were unable account for unobservable shifts in dietary preference, which could affect how much people buy at Walmart as well as what they buy there, which limits our ability to establish what caused the observed changes in nutrient profile.
Finally, we did not include food purchases at other non-chain food retailers, like specialty stores or ethnic food stores. However, considering that the per capita volume of PFPs purchased from mass merchandisers and grocery chains remained stable from 2000 to 2013 (72% to 70%, respectively) (144), it seems unlikely that observed changes would be due to differential