Marginal Pricing and Student Investment in Higher Education∗
Steven W. Hemelt University of North Carolina
at Chapel Hill
Kevin M. Stange University of Michigan
and NBER
October 2015
Abstract
This paper examines the effect of marginal price on students’ educational investments using rich administrative data on students at Michigan public universities. Marginal price refers to the amount colleges charge for each additional credit taken in a semester. Institutions differ in how they price credits above the full-time minimum (of 12 credits), with many institutions reducing the marginal price of such credits to zero. We find that a zero marginal price induces a modest share of students (i.e., 7 percent) to attempt up to one additional class (i.e., 3 credits) but also increases withdrawals and lowers course performance. The analysis generally suggests minimal impacts on credits earned and the likelihood of meeting “on-time” benchmarks toward college completion, though estimates for these outcomes are less precise and more variable across specifications. Consistent with theory, the effect on attempted credits is largest among students who would otherwise locate at the full-time minimum, which include lower-achieving and socioeconomically disadvantaged students.
∗ The research reported here was supported by the Institute of Education Sciences (IES), U.S. Department of
Education, through Grant R305B110001 to the University of Michigan. The opinions expressed are those of the authors and do not represent views of the Institute of Education Sciences or the U.S. Department of Education. This research used data structured and maintained by the Michigan Consortium for Educational Research (MCER). MCER data are modified for analysis purposes using rules governed by MCER and are not identical to those data collected and maintained by the Michigan Department of Education (MDE) and/or Michigan’s Center for
2
I. Introduction
Only slightly more than half of recent college entrants graduate within six years (Shapiro
et al., 2013) and time-to-degree has increased particularly for students from low-income families
(Bound, Lovenheim, & Turner, 2012). Such statistics have propelled those in federal, state, and
local policy circles to call for proposals aimed at increasing rates of degree completion and
shortening time-to-degree among college-goers (e.g., National Conference of State Legislatures,
2010). Indeed, recent proposals from the Obama administration suggest tying federal aid to
graduation rates and timely degree completion (Lewin, 2013).
In the face of such pressure, many institutions have looked at changes in tuition policies
as a means of generating revenue while also maintaining or improving student success. Marginal
price is an important dimension of institutions’ pricing structures about which little is known. By
marginal price, we mean the price students are charged incrementally for each additional course
(or credit) they take in a given semester. Many students only take the minimum course load to
achieve full-time status (i.e., 12 credits), which at most institutions would translate to earning a
Bachelor’s degree in five years or more. At some institutions, the marginal price of credits taken
above 12 is zero; others have a linear, per-credit marginal price for all credit levels. Indeed, some
institutions have adopted “flat” pricing (i.e., zero marginal cost for credits above 12) in explicit
expectation that students will respond by attempting and earning more credits and graduating
faster.1
How individuals react to nonlinear price schedules is central to many areas of economics
and policymaking, as proposals in a variety of domains are predicated on the microeconomic
1 From an institution’s perspective, while there may be some concern about losing revenue when switching from a
3
principle that individuals respond to marginal price. The design of the Earned Income Tax Credit
(EITC), many savings and retirement programs, and public health insurance programs all
incorporate nonlinear price schedules to achieve policy goals, as do pricing schedules in many
consumer markets such as phone and energy services.
Whether and how individuals respond to these marginal incentives remains largely an
open question with recent empirical evidence from other contexts mixed and no evidence from
the setting of education.2 A weak evidence base has not prevented colleges from touting
nonlinear pricing as one solution to colleges’ goals of increasing timely graduation rates. For
example, Adams State in Colorado recently made such a switch from per-credit (linear) to flat
(nonlinear) pricing, citing this shift as the reason average credit hours have increased in just two
years (Mumper, 2012). Similar policy shifts have been observed at Montana State, the University
of Texas, and many other institutions (Baum, Conklin, & Johnson, 2013). However, whether
nonlinear pricing alters students’ investment intensity as predicted by economic theory is not
known.
This paper is the first to examine the effect of marginal price on educational investment.
We focus on the effect of exposure to a “flat” pricing scheme at a university, wherein the
marginal price of additional credits above the full-time minimum is zero, relative to a linear
tuition-pricing scheme. Our contributions are fourfold. First, we add to the growing evidence
base on whether individuals respond to marginal incentives embedded in nonlinear price
schedules, albeit in a new and policy-important context. As human capital investment is one of
2 Saez (2010) finds that the self-employed respond to the first kink in the nonlinear EITC schedule, but the response
4
the most important economic decisions individuals make, evidence about whether the standard
model applies to this setting is useful. Second, we exploit variation in the pricing structure faced
by similar individuals in very similar choice contexts. Much of the previous literature on
nonlinear budget constraints focuses on contexts in which similar individuals face the same price
structure (e.g., the federal tax code), which creates numerous econometric problems such as the
fact that tax rates (and thus marginal incentives) are endogenous or that individuals with different
marginal incentives may be quite different.3 Third, we provide the first evidence on the effects of
a policy that many higher education institutions and states have turned to as a way to boost
timely degree completion. Identifying effective policies has become critical as federal and state
funding is increasingly tied to graduation rates and timely degree completion (National
Conference of State Legislatures, 2010; Lewin, 2013). 4 Finally, our study informs the revenue
consequences of institutions’ pricing regimes. Public institutions increasingly rely on tuition
revenue to supplant declines in state appropriations and many have avoided across-the-board
tuition increases, instead altering other features of their pricing policies.
We assess the effect of marginal price using administrative data on all Michigan public
high school graduates in the classes of 2008 through 2011 who attended one of the state’s public
universities. Michigan is a compelling setting to study, as there is substantial policy variation
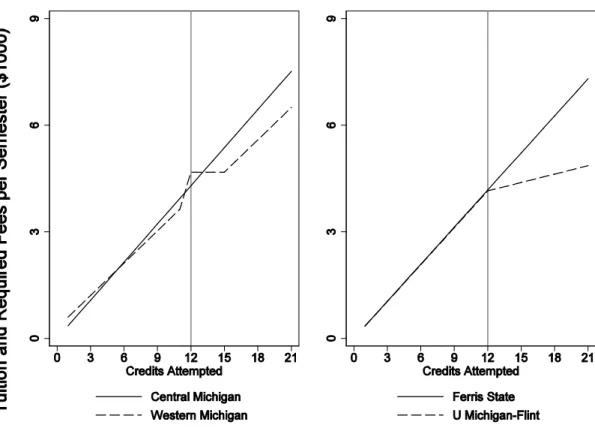
across very similar institutions, which is not present in other states.5 Figure 1 depicts the price
schedule at two pairs of Michigan’s fifteen public universities. Each pair of universities has an
3 Ito (2013, 2014) are exceptions. Moffitt (1990) reviews several of the econometric problems and Saez, Slemrod,
and Giertz (2012) discuss similar issues in the context of taxable income.
4 Lengthening time to degree is not solely an issue for postsecondary institutions. It is costly for students as well.
Students that set themselves on a longer path to college completion forego time in the labor market, demand more resources to finish, and may heighten risks of stop-out.
5 Our study focuses on public universities in Michigan because of the availability of rich transcript data and because
5
identical interquartile range of student ACT scores and similar prices for part-time students, yet
quite different marginal prices for full-time students. Full-time students at Western Michigan and
University of Michigan-Flint pay little additional tuition for courses taken beyond the full-time
minimum, in contrast to those at Central Michigan and Ferris State. Of all public universities in
the state, eight charge full-time students per credit taken, while students at the other seven pay
greatly reduced marginal tuition.6 The subsidy embedded in this nonlinear price structure is
substantial: 20 percent of the direct costs of college among those who take five classes in a
semester ($740 to $1,260 for each additional 3-credit course). Though there are some differences
in the characteristics of students attending institutions with per-credit pricing and those with flat
pricing, there is considerable overlap between these two groups. We rely on a
selection-on-observables assumption combined with this institutional overlap to identify the causal effect of
marginal price on credit accumulation. Conditional on our rich set of individual controls, we
assume that students are not choosing universities based on the marginal pricing policy. We
think this is a reasonable assumption in this case given that tuition information advertised in
college guidebooks and financial aid packages is for the average or typical student, which by
definition does not vary with credit load.
We find that exposure to flat tuition pricing has only a small (statistically insignificant)
effect on the average number of credits attempted, but induces a modest share (7 percent) of
students to attempt a few more credits (i.e., up to one course, or 3 credits, more). Yet, we find
little evidence that these additional attempted credits translate into more earned credits in a
semester. Students facing no marginal price are more likely to withdraw from at least one course
and also have lower GPAs. Accordingly, flat pricing is not associated with increased cumulative
6
6
credits earned, greater persistence, or reduced time-to-degree, though estimates of these
outcomes are admittedly imprecise. Theory predicts that the greatest attempted-credit response
would be among students who would take the full-time minimum under linear pricing (largely
minority and economically disadvantaged students in the bottom of the achievement
distribution), which is precisely what we find. There is no evidence to suggest that this pricing
structure influences students’ decisions to enroll part- versus full-time, likely because any
marginal pricing effect is swamped by discontinuities in financial aid eligibility or other
considerations. Various approaches to eliminating observed differences – rich controls, sample
restrictions, propensity score re-weighting, exact matching on observables – as well as various
alternative specifications all suggest similar qualitative results.
For institutions that currently do not charge students at the margin, our results suggest
that increasing the marginal price associated with credit intensity will minimally affect students’
rate of progress towards degree and on-time degree completion and may thus be a
non-distortionary way of raising revenue. For institutions that currently charge per-credit, eliminating
the marginal price is unlikely to improve student outcomes. However, our analysis does not fully
address other possible effects of marginal pricing, including major choice, interest exploration,
or financial burden.
This paper proceeds as follows. The next section discusses previous literature, with a
focus on the relationship between tuition pricing and progress through college. Section III
provides background on university pricing in the Michigan context. Section IV presents a simple
theoretical framework to guide our empirical work and help with interpretation of results.
7
results on credit-taking and student performance and explores their robustness. Section VII
concludes.
II. Previous Literature
There is a large body of evidence showing that students’ enrollment, persistence, and
college choices are influenced by net college price. A consensus estimate is that a $1,000 change
in college price (1990 dollars) is associated with a 3 to 5 percentage point difference in
enrollment rates (Kane, 2006; Dynarski, 2003). Evidence on the effect of college price on
persistence and degree completion is rarer, but most studies suggest that persistence and
completion are modestly responsive to prices for at least some groups (Bettinger, 2004; Turner,
2004; Dynarski, 2008; DesJardins & McCall, 2010; Goldrick-Rab et al., 2011; Castleman &
Long, 2013). Price also appears to be a strong predictor of the specific college students choose to
attend (Long, 2004; Jacob, McCall, & Stange, 2013; Hemelt & Marcotte, 2015), institution-level
enrollment (Hemelt & Marcotte, 2011), and major choice (Stange, 2015). While suggestive of
price response in educational investment, this literature does not speak to whether students
respond to changes in marginal, as opposed to average, price.
We are aware of only one study that examines the relationship between marginal pricing
and student outcomes. In a working paper, Bound, Lovenheim, and Turner (2010) found that
4-year public institutions with per-credit pricing had lower 4-4-year graduation rates than those with
flat pricing. Further, much of the increase in time-to-degree between 1972 and 1992 occurred at
institutions that charge on a per-credit basis.7 While suggestive, this relationship could be due to
student or institutional differences that happen to correlate with marginal pricing, rather than the
causal effect of marginal pricing per se.
7
8
At the same time, a number of interventions have been found to increase students’ credit
loads, either intentionally or inadvertently. For instance, the Promise Scholarship in West
Virginia explicitly tied aid to number of credits (and GPA), and resulted in more students taking
15 credits rather than the full-time minimum (Scott-Clayton, 2010). A similar result was found
for a scholarship program at the University of New Mexico (Miller, Binder, Harris, & Krause,
2011). Yet, work on Georgia’s HOPE scholarship, which tied eligibility and retention of funds to
maintaining a 3.0 GPA, found that HOPE reduced the likelihood students took full course loads
and increased their propensity to withdraw from classes and divert credits to the summer
(Cornwell et al., 2005).
Other conditional aid grant programs (often in conjunction with advising or coaching)
have also had impacts on students’ credit loads. For instance, Richburg-Hayes et al. (2009) found
that a performance-based scholarship at community colleges in New Orleans increased credit
loads, as did an intervention that combined financial incentives and academic support services at
a Canadian university (Angrist, Lang, & Oreopoulos, 2009). At a large Italian university,
Garibaldi, Giavazzi, Ichino, and Rettore (2012) found that charging students extra for taking too
long to graduate speeds up time-to-degree.
Together, these studies make clear that particular features of scholarship and grant
programs can have appreciable effects (positive or negative) on students’ credit loads and
progression through college. We look at marginal pricing policy as another potential lever
capable of influencing students’ credit loads – and ultimately their rates of college completion
and average time-to-degree. Since the interventions described above often tie awards explicitly
to credit-taking behavior and also typically target select student subgroups, they may not be
9
III. Background on University Pricing in Michigan
During the 2011-2012 academic year, eight of Michigan’s fifteen public 4-year
universities charged full-time undergraduate students differently based on number of credits. In
these schools, tuition is a linear function of the number of credits taken, ranging from a low of
$246 per credit at Saginaw Valley State University to a high of $421 at Michigan Technological
University. By contrast, the tuition schedule at the other seven institutions has a flat or near-flat
range at full-time status (12 credits). Students at these institutions pay a per-credit amount if
part-time, but almost no additional monetary cost for taking an additional course once they have
reached full-time status.8 The upper limit for which the zero marginal price applies varies from
16 to 18 credits. While per-credit pricing is generally more common at less selective institutions
(all of the state’s community colleges charge per-credit while the state flagship university,
University of Michigan-Ann Arbor, does not), this is not always the case. Further, some
institutions have explicitly adopted flat pricing models to encourage students to take 15 credits,
while others have switched from the use of flat pricing to charging per credit (e.g., Ferris State in
2008-2009).
Tuition fees apply to any credits attempted in a semester after the course “drop date,”
regardless of outcome of the course (pass, fail, withdrawal, etc.). Students are generally given
one or two weeks to withdraw from classes while still receiving a full (or near-full) refund of
tuition and fees. There does not seem to be any systematic difference in these policies by pricing
practice. Flat-pricing institutions in Michigan do not appear to be disproportionately more
generous (or strict) in their refund polices than do their per-credit pricing peers.
8
10
Marginal pricing is just one feature of pricing policies at these institutions. During the
2011-2012 academic year, seven charged differentially based on undergraduate level and three
charged differently for certain programs or majors (Presidents Council, State Universities of
Michigan, 2011). In this regard, Michigan institutions have pricing policies that are quite similar
to institutions nationally (Cornell Higher Education Research Institute, 2011; Ehrenberg, 2012).
IV.Theoretical Framework
A. Basic Model and Predictions
We develop a static (single-period) model of school intensity choice to better understand
how the tuition-pricing schedule alters postsecondary investment. Suppose individual utility
depends positively on lifetime consumption c and on time spent not in school, n. Thus school
attendance incurs effort cost that is increasing with the level of intensity. Individuals choose time
spent in school, z, to maximize utility u(c,n) subject to a budget constraint and a standard time
constraint.9 The number of credits taken can be thought of as one measure of z. The budget
constraint states that consumption equals the sum of endowed income (I) and lifetime earnings
minus tuition: 𝑐𝑐 =𝐼𝐼+𝐸𝐸(𝑧𝑧)− 𝑇𝑇(𝑧𝑧). In the single-period model, we simplify things by assuming that each increment of schooling increases earning potential by a fixed amount w, thus 𝐸𝐸(𝑧𝑧) =
𝑤𝑤𝑧𝑧. This simplification allows us to abstract from effects of nonlinearities in the returns to college education and to focus on the decision about the number of credits taken in a single
period.10 Tuition is a nonlinear function of credit load, changing discretely as credit load
surpasses a threshold 𝑧𝑧∗:
9 The time constraint is that total time spent in (z) and out (n) of school equals total time available, H: n + z = H. 10 Stange (2012) discusses the evidence on and implications of nonlinearities in returns and the dynamic nature of
11
𝑇𝑇(𝑧𝑧) =�𝑡𝑡 𝑡𝑡0+𝑡𝑡1𝑧𝑧𝑖𝑖𝑖𝑖𝑧𝑧<𝑧𝑧∗
0+𝑡𝑡1𝑧𝑧∗+𝑡𝑡2(𝑧𝑧 − 𝑧𝑧∗) 𝑖𝑖𝑖𝑖𝑧𝑧 ≥ 𝑧𝑧∗ ,
where typically 𝑡𝑡1 >𝑡𝑡2.11 Together these elements generate the nonlinear budget constraint depicted by the solid line in Figure 2. Below z* (i.e., the full-time minimum credit load), each
increment of schooling investment increases lifetime consumption by (w - 𝑡𝑡1). Above 𝑧𝑧∗, the net return to each unit of investment is higher and thus the “price” of non-school time is also higher.
The dashed line depicts a linear tuition schedule where students pay a constant amount per credit.
How individuals respond to nonlinear budget constraints is complex, as reviewed in
Moffitt (1990). One finding is that a policy shift from a linear (dashed) to flat (solid) pricing
schedule will generate quite heterogeneous responses across students. Students that would locate
at 𝑧𝑧∗ when facing a linear pricing schedule (denoted by B) experience only a substitution effect (non-school time has become more expensive) and would be predicted to increase their credit
intensity. However, students initially choosing to enroll beyond the full-time minimum (denoted
by A) also experience an income effect, thus the net effect for this group is ambiguous. Part-time
students who would locate below z* when pricing is linear (denoted C) will either remain on the
first segment (zero response) or switch segments by increasing credit loads above full-time.12
This simple budget set analysis suggests that response may be greatest for students who
otherwise would choose to locate at the full-time minimum. In fact, continuous preferences
would predict we observe a “hole” in the density of students at the non-convex kink B. Our
empirical analysis explores this heterogeneity by stratifying our sample by students’ predicted
credits (based on baseline characteristics) when faced with a linear pricing scheme.
11
We also ignore any increased marginal tuition for very high credit loads (typically 17 or 18 credits).
12 B. Extensions to the Basic Model
While the basic static model predicts positive (or non-negative) effects of flat pricing on
investment intensity for most students (particularly those who would otherwise choose the
full-time minimum), several factors may mitigate this incentive or cause minimal impact on the
number of credits that students actually earn. For instance, if the effort cost (essentially how
utility decreases with z) rises sharply around the full-time minimum (z*), then even large
decreases in marginal price could have minimal impact on student course-taking. This may be
particularly true since the number of credits is finite and “lumpy” as most classes are worth
either 3 or 4 credits. Even if it were optimal to increase credit load by one unit, this may not be
feasible for many students. Such adjustment costs have been found to mute responses to
nonlinear incentives in other contexts (Chetty et al., 2011).
The basic model also assumes that people choose credit loads with perfect foresight about
future effort costs, course completion, enrollment, and degree completion. Generally, current
choices will be less responsive to price when uncertainty is high – since the consequences of
current decisions depend on these uncertain future outcomes. Related, students may misperceive
the true marginal effort cost when making course enrollment decisions by, for instance, being
overly confident about their ability to manage a heavier course load. In this case, flat pricing may
have different effects on credits attempted and credits earned or could affect course performance.
Finally, strong nonlinear returns to degree receipt could mitigate impacts of flat pricing on
term-level course-taking as the nonlinear return would dominate intensity decisions.13 While the basic
model suggests that reductions in marginal price could induce students to take and earn more
credits and speed up degree progress, several realistic extensions demonstrate how this policy
lever could be quite muted in practice.
13
V. Data and Empirical Approach
A. Data and Samples
We combine student-level data from several different administrative sources. From the
Michigan Consortium for Education Research (MCER), we begin with information on the
universe of Michigan public high school graduates from 2008 through 2011. These data include
demographic characteristics during high school (sex, race, ethnicity, free and reduced-price
meals eligibility (FARM), limited-English proficiency (LEP), special education status), 11th
grade achievement scores, and high school attended.14 We then use data from the National
Student Clearinghouse (NSC) to restrict our sample to students appearing in college (anywhere
up to August 2012).15
To examine credit accumulation at Michigan public institutions, we next merge these
records of college-going Michigan high school graduates onto data from the Michigan Student
Transcript and Academic Record Repository (STARR). STARR contains full, historical
transcript records (course-level data) for all individuals enrolled in 2-year or 4-year public
colleges in Michigan in the 2011-2012 academic year. While the state of Michigan mandated the
collection of entire transcripts of students enrolled at any Michigan public college during that
year, there is some (small) variation in the degree to which institutions supplied course-taking
information from prior years. Therefore, we focus on STARR data from the Fall of 2011 and
Spring of 2012. These semesters occur at different points in an “on-time” college trajectory for
students, depending on the year of their high school graduation. For example, the 2011-2012
academic year corresponds to the on-time third year of college for the high school class of 2009.
14 We use a student’s composite ACT score since the ACT became a mandatory part of Michigan’s high school
testing in 2007.
15
14
Therefore, we also examine whether students’ postsecondary persistence (and relatedly, the
composition of our sample) is related to flat pricing.
Our main analytic sample includes students from these high school cohorts (i.e., 2008
through 2011) who are enrolled full- or part-time in a Michigan public 4-year institution during
the fall and/or spring of the 2011-2012 academic year. This results in 212,473
student-by-semester observations (over 112,000 unique students) across all high school cohorts. For most
analyses we restrict our sample to students not attending the University of Michigan-Ann Arbor
(187,860 observations) and to only full-time students (171,058 observations excluding UM-AA).
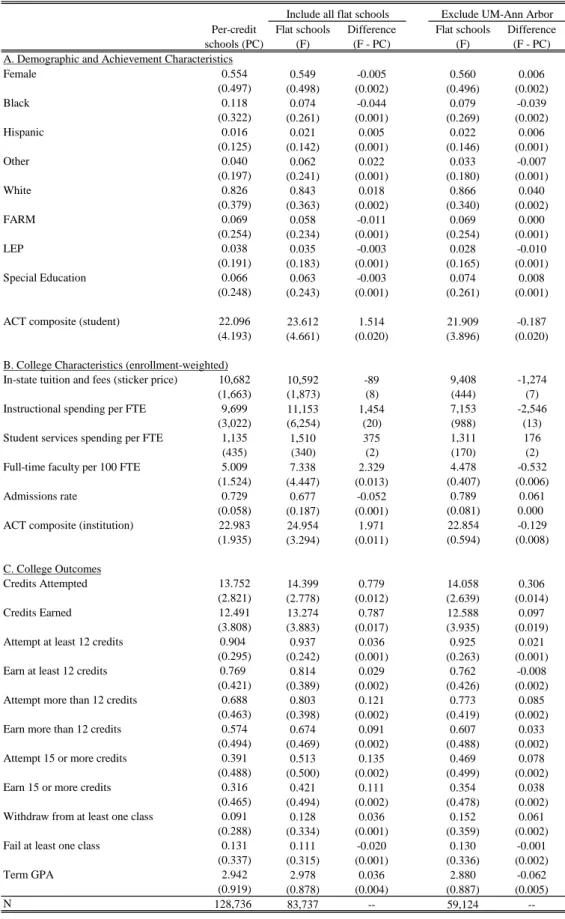
Table 1 presents descriptive statistics on the students and institutions in our analytic
sample, as well as college-level credit outcomes by institutional pricing structure. There are
some small to moderate differences in the average characteristics of students attending per-credit
versus flat-pricing institutions. Overall, students attending flat-pricing schools are more
advantaged (less likely to have been eligible for free or reduced-price meals, less likely to be
minority) and have higher college admissions scores. Though, as illustrated by the final two
columns in Table 1, the achievement advantage of students at flat schools is largely driven by the
fact that the University of Michigan-Ann Arbor (UM-AA) uses a flat tuition-pricing schedule.
Excluding UM-AA, student characteristics are quite similar at flat and per-credit schools. Flat
schools also tend to have more resources and be more selective, but again this pattern reverses
when UM-AA is excluded.16
Turning to outcome differences, average credit loads of students at flat schools are a bit
higher than those at per-credit schools. Indeed, the share of students attempting more than 12
credits in a semester is about 8 to 12 percentage points higher at flat schools than at per-credit
16
15
institutions. Some mean differences vary more than others as a function of the sample: For
example, the share earning 15 or more credits in a semester is about 11 percentage points higher
at flat colleges; but, when the University of Michigan-Ann Arbor is excluded from the sample,
this difference falls to under 4 percentage points. Obviously, these raw differences in means do
not control for other attributes of students and schools that are likely correlated with
course-taking behavior and progress through college.
B. Empirical Approach and Identification Strategy
Our goal is to compare the behavior of students who face a nonlinear budget constraint
(the solid line in Figure 2) to similar students facing a linear constraint (dashed line). Our main
approach is to compare credits taken by students attending flat-pricing schools (at which the
marginal price is zero for credits above the full-time minimum) to those attending
per-credit-pricing schools, invoking a selection-on-observables assumption. Since the basic framework
predicts heterogeneous responses according to students’ course-taking tendencies, we also make
such comparisons within narrowly defined student groups. We estimate a linear probability
model with Ordinary Least Squares (OLS) of the form:
𝑌𝑌𝑖𝑖𝑖𝑖𝑖𝑖𝑖𝑖 = 𝛼𝛼+𝛽𝛽1𝐹𝐹𝐹𝐹𝐹𝐹𝑡𝑡𝑖𝑖+𝛽𝛽𝑥𝑥𝑋𝑋𝑖𝑖𝑖𝑖𝑖𝑖𝑖𝑖+𝛽𝛽𝑧𝑧𝑍𝑍𝑖𝑖+𝛿𝛿𝑖𝑖+𝜃𝜃𝑖𝑖 +𝜀𝜀𝑖𝑖𝑖𝑖𝑖𝑖𝑖𝑖 (1)
In this specification,𝑌𝑌𝑖𝑖𝑖𝑖𝑖𝑖𝑖𝑖 is a measure of credits attempted or earned by individual i from cohort c attending school j during semester t. Our primary outcome variables are total credit load
and indicators for attempting or earning a credit load greater than certain thresholds (e.g., at least
13 credits or at least 15 credits). We also examine indicators for course withdrawals and failure,
16
term. Some specifications control for a limited number of institution-level covariates (𝑍𝑍𝑖𝑖). The primary coefficient of interest is 𝛽𝛽1, the effect of flat pricing on our outcome of interest (e.g., student credit-taking or course performance). To account for correlation in the errors among
students at the same college, one would usually employ traditional clustering methods at the
institution level. However, since cluster-robust standard errors perform poorly in settings with
few clusters, we use the wild-bootstrap cluster procedure developed by Cameron, Gelbach, and
Miller (2008). A drawback of this procedure is that it is not possible to generate estimates of the
standard errors or confidence intervals, thus we report p-values throughout.
The main identifying assumption of our approach is that unobserved student- and
institution-level determinants of outcomes are uncorrelated with pricing structure. Conditional on
our rich set of individual controls, we assume that students are not choosing universities based on
the marginal pricing policy. We think this is a reasonable assumption in this context because the
marginal pricing policy is not terribly salient to potential enrollees; college guidebooks stress the
average or typical list price and financial aid packages are based on total cost-of-attendance for a
typical student, which (by default) does not vary with credit load. The marginal price becomes
salient at the point when students register for classes.
We address three remaining possible sources of bias in this basic model. First, students
attending “flat” schools may possess different characteristics that are correlated with college
performance than those attending per-credit schools. While this is certainly true overall, it is
worth noting that there is considerable student overlap on observable characteristics across
institutions. Figure 3 depicts the inter-quartile range of ACT scores for all fifteen institutions.
With the exception of the University of Michigan-Ann Arbor (a flat pricing school), every flat
17
rich array of student-level characteristics including ACT score, sex, race, free and reduced-price
meal eligibility, limited English proficiency, and special education status.17 Our sample size
permits us to do this extremely flexibly by looking within student groups defined very narrowly
by full interactions between these characteristics. In addition, we estimate models that instrument
for pricing structure using the policy of the nearest university to students’ high schools or that
include high school fixed effects.
Second, additional financial aid could offset the additional tuition and fees associated
with additional credits, diminishing the treatment. Grant programs may explicitly increase in
value as number of credits increases or cost-of-attendance could be adjusted upwards (increasing
eligibility) when additional credits are taken. By design at the federal level, the maximum Pell
amount increases discretely at quarter-time, half-time, three-quarters-time, and full-time, but
does not increase in value beyond 12 credits. We are not aware of any institution, state, or federal
programs that explicitly increase aid for additional credits taken beyond 12. Further, most
students who receive the Pell at these universities are receiving the maximum amount, so
increases in their cost-of-attendance due to higher credit loads will not increase the amount of
grant aid for which they are eligible.
Finally, it is possible that schools’ pricing schemes coincide with other college-level
attributes or policies that may influence outcomes, such as resources or advising. Our focus on
the public 4-year sector in one state eliminates many institutional differences that correlate with
pricing structure nationally, but we cannot entirely rule out this possibility. We take three
approaches to address this issue. First, we include an institution-level control for median ACT
17 Figures C1 and C2 in Appendix C plot predicted probabilities of attending a flat-pricing institution (via a probit
18
composite scores of incoming freshman or several other measures of institutional resources.
Second, we examine differences in credit-taking among students attempting less than a full-time
load (whose behavior should be minimally affected by the pricing scheme for full-time students)
as a falsification test. Third, we exclude University of Michigan-Ann Arbor, which is an outlier
both in terms of student characteristics and institutional resources, from our preferred
specifications.
It is worth contrasting our simple approach to those employed in other settings with
nonlinear pricing. In many settings, similar individuals face the same price structure, so
individuals with different marginal incentives are quite different. For instance, much of the
variation in marginal incentives in the federal tax code is across families with very different
incomes. In addition, the fact that tax rates are determined by income means that marginal
incentives are endogenous to many of the outcomes under study (e.g., work behavior). A number
of empirical strategies have been developed for these settings, such as measuring “bunching” at
budget set kinks (Saez, 2010), instrumenting for tax rates using changes in the tax rate structure
(reviewed in Saez, Slemrod, and Giertz (2012)), or structural approaches (Hausman, 1985).
Relative to these other methods, our setting permits a very transparent comparison between
observably identical students that face quite different marginal incentives.
VI. Results
A. Distribution of Credits Attempted and Earned
Figure 4 plots the fraction of all students at or above each credit threshold, separately by
pricing policy for our full sample (of students and institutions). We see little difference in the
distribution of credits taken (and earned) by part-time students regardless of pricing policy – but,
19
sets of institutions (i.e., 12 credits). Students that face no marginal tuition price of a heavier
course load are more likely to take (and possibly earn) credits beyond the full-time minimum. At
first glance, these patterns suggest that marginal pricing policy may have some impact on
course-taking and credit accumulation.
B. Main Results
The raw differences reported in Figure 4 may overstate the true causal effects of flat
pricing because students attending flat pricing schools are slightly higher achieving and
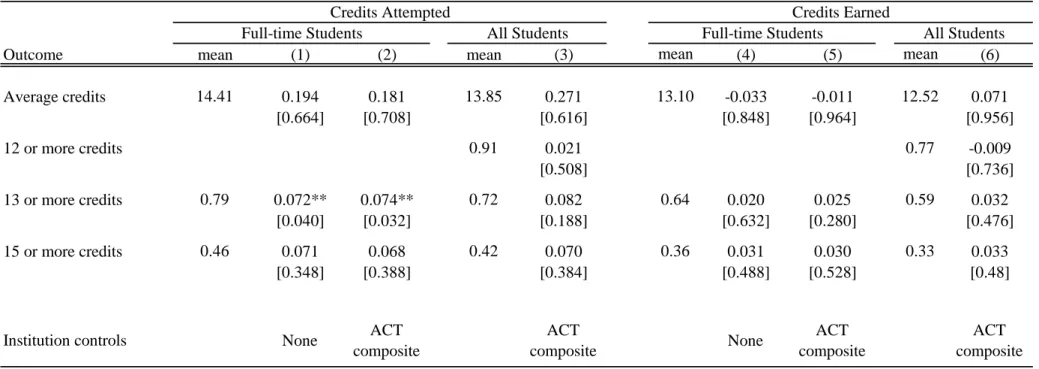
advantaged, which likely have independent effects on course-taking. Table 2 presents our main
regression estimates, which control for a rich set of individual covariates and median
institution-level ACT scores and also exclude the University of Michigan-Ann Arbor.18 We see no
detectable impact of flat pricing on average credits attempted and no evidence that flat pricing
affects average credits earned. In this table and throughout much of the paper we focus on
full-time students. Flat pricing does not appear to affect the decision to enroll full-full-time (i.e., 12 or
more credits) and the inclusion of part-time students does not meaningfully change our point
estimates for any outcome (columns 3 and 6).19 However, including part-time students reduces
precision by adding residual variation to our outcomes.
Flat tuition pricing is associated with an increase in the likelihood that students attempt at
least 13 credits (more than the full-time minimum) of about 7 percentage points (relative to a
base of 79 percent, p-value = 0.03). Since estimates at both the 13 and 15 attempted credit
thresholds are similar, this implies that these students are attempting about 3 additional credits,
18
The coefficients on individual covariates are as expected from previous literature: male, non-white, poor, limited English, special education, and students with low ACT all attempt fewer credits. Including many subject tests rather than the ACT composite produces nearly identical results, quantitatively and qualitatively.
19 The null effect on full-time status also serves as a falsification check: given financial aid and other discontinuities
20
or approximately one course.20 Students must earn 15 credits each semester in order to graduate
within four years. However, the impact of flat pricing on earned credits is much weaker (i.e., half
the magnitude or less of the effect on credits attempted), sometimes “wrong-signed,” and
insignificant. Therefore, additional attempted credits do not appear to translate into more credits
earned.
The inability to translate attempted credits into earned ones is largely explained by course
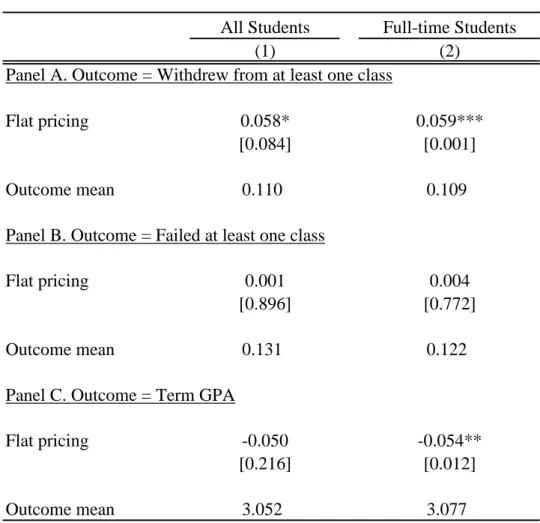
withdrawal. Table 3 examines effects on course withdrawal, failure, and performance (i.e.,
semester GPA) for all students and just full-time students. In a given semester, flat pricing
increases the likelihood that students withdraw from at least one class by about 6 percentage
points (p-value = 0.001) but has no impact on course failure. Since students at flat-pricing
schools do not bear the financial cost of enrolling in a course and withdrawing after the drop
deadline, they appear to do so much more frequently.21 Finally, flat pricing is also associated
with a modest but measurable 0.05 point lower grade-point-average, on a base of 3.08 (p-value =
0.01). In results not reported, we found that the additional courses students are induced to take in
response to a subsidized marginal price are not substantively different than their typical courses
and, if anything, are in the core subjects of Humanities/English and Social Science, seem to be
degree-related, and that there is little systematic substitution from 3- to 4-credit courses.22 The
effect on course performance suggests that students who have chosen larger credit loads may
20 We also used the re-weighting approach described by DiNardo, Fortin, and Lemieux (1996) to construct
counterfactuals of the entire distributions of credits attempted and earned, weighting students at per-credit schools to mirror the observable characteristics of students at flat-pricing institutions. This procedure produces very similar results: Marginal price has its largest effect on the likelihood of attempting up to 15 credits, but has a much more modest impact on the likelihood of earning credits. Furthermore, there are only small (and insignificant) differences in the distribution of credits attempted and earned by less-than-full-time students. These results are presented in Appendix C, Figure C3.
21 Estimates from models that include UM-AA or do not control for institution-level ACT are similar.
22 Results available from authors upon request. We characterize each course taken into one of 12 broad subject areas
21
perform worse because of too heavy a credit load. Since effort is not observed, we cannot fully
identify the channel through which course performance is affected – but it does not appear to
happen through a shift in the types of courses taken.
C. Robustness
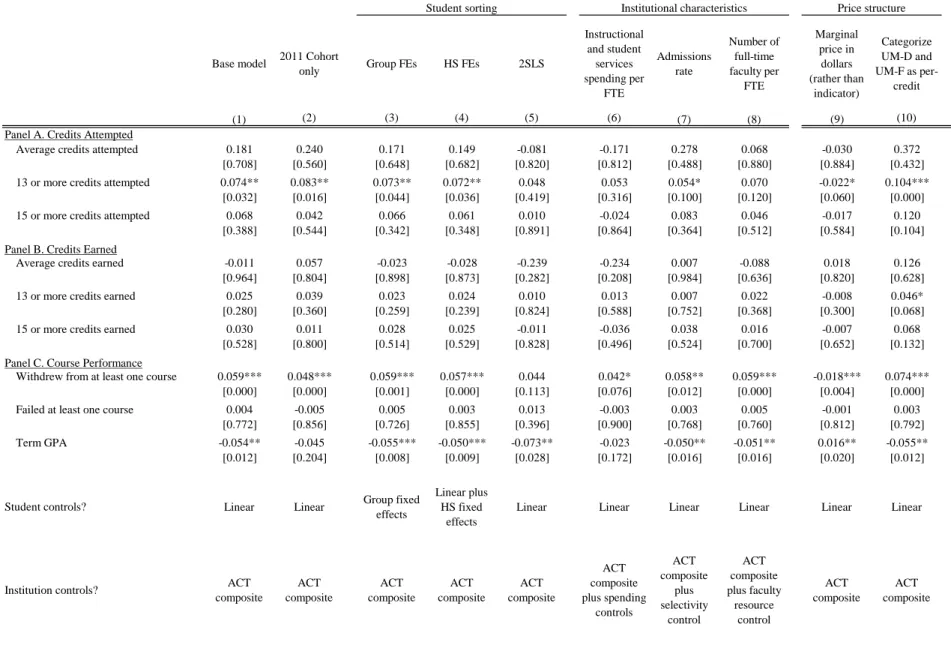
Table 4 examines the robustness of our main findings to various changes in sample,
specification, and controls. Our full sample includes all college students enrolled in 2011-2012,
including students that have chosen to persist beyond the first year. This may introduce sample
selection bias if marginal price influences persistence. In addition, marginal pricing could have
greater (or lesser) effects for lower-classmen as their course-taking would be less driven by
graduation requirements. Yet, estimates focused on just freshmen (2011 high school graduates)
are quite similar (column 2) to the full sample for all outcomes.23
Having data on the full universe of students in public universities in the state permits us
to control for individual characteristics quite flexibly. Estimates that include separate fixed
effects for the large number of demographic groups defined by the six-way interaction of ACT
score (each single point separately), female, race/ethnicity, FARM, LEP, and special education
status (column 3) produces estimates that are nearly identical to our baseline specification.
We address the possibility that students may choose to attend flat-pricing institutions
based on unobservable student characteristics in two complementary ways. High school fixed
effects absorb any high-school-specific peer, background, or resource differences that may
correlate with college choice and schooling intensity. Such within-school comparisons (column
4) are indistinguishable from the baseline specification. We also presents 2SLS estimates in
which we instrument for flat pricing of institution attended with the pricing policy of the
22
university closest to a student’s high school. Point estimates are qualitatively similar, but smaller
in magnitude than base model estimates and with much larger p-values due to imprecision.24
Our base model controls for the midpoint of incoming students’ ACT scores, as this
variable is more highly correlated with freshman retention rates than other measures we
considered, was inferred to be the least noisy proxy for college quality (Black and Smith, 2006),
and is used extensively in the college quality literature.25 Given the small number of institutions,
we are limited to including only a few institution-level covariates due to multicollinearity issues.
That said, columns 6 to 8 of Table 4 additionally control for other institutional characteristics to
address the possibility that institutions with flat pricing differ along other dimensions that also
influence course-taking. Controlling for instructional and student services spending (in addition
to institution-level ACT score) weakens our main findings (column 6), but specifications with
admissions rate or number of full-time faculty per student are quite similar to our preferred
model. Furthermore, estimates that do not control for any institutional characteristics (columns 1
and 4 in Table 2) are quite similar to these richer models.
Finally, we examine robustness to two alternative specifications for our main explanatory
variable. A $100 decrease in the marginal price of per additional credit is associated with a 2.2
percentage point increase in the likelihood of attempting more than 12 credits, a 1.8 percentage
point increase in likelihood of withdrawing from a class, and a reduction in term GPA of 0.016,
but no change in credits earned. These magnitudes are comparable to our base model given that
the average, additional per-credit price (for credits above 12) is $281 (e.g., 0.022*2.81 = 0.062).
24 The first-stage estimates are reported in Appendix Table A3. The first stage is of modest strength (F = 13.2),
though the p-values reported for the 2SLS specifications are from cluster-robust standard errors that do not account for the small number of clusters. By way of comparison, these 2SLS standard errors are twice as large as those from the base model estimates (also without accounting for the small number of clusters).
25 Black and Smith (2006) do not consider spending per student as proxy variables, though do consider
23
This specification fully exploits the variation in marginal price across institutions, including the
modest marginal price ($80 per credit above 12) charged by the Flint and Dearborn campuses of
the University of Michigan, which our base specification ignores by characterizing them as “flat”
institutions. Finally, results are generally robust to directly coding the Flint and
UM-Dearborn campuses as per-credit institutions, though estimated effects on credits earned are more
positive in this specification.
D. Heterogeneity
Our theoretical framework suggests that students who would otherwise locate at the
full-time minimum of 12 credits would be most strongly affected by flat pricing. Such students
experience only a substitution effect (non-school time has become more expensive) and are
unambiguously predicted to increase their credit intensity. In fact, we should observe a “hole” in
the density of students at the full-time minimum at flat-pricing schools if credit intensity were
truly continuous. Since we cannot know the credit load that students at flat schools would choose
when faced with linear pricing, we use students at per-credit schools with identical observed
characteristics to form this counterfactual.
We begin with our sample of time students (i.e., those attempting at least the
full-time minimum of 12 credits). We then create a large number of mutually exclusive student
groups defined by the six-way interaction of ACT score (each single point separately), female,
race/ethnicity, FARM, LEP, and special education status. Within each of these groups we
compare the credits attempted (earned) between students at per-credit and flat-pricing schools.
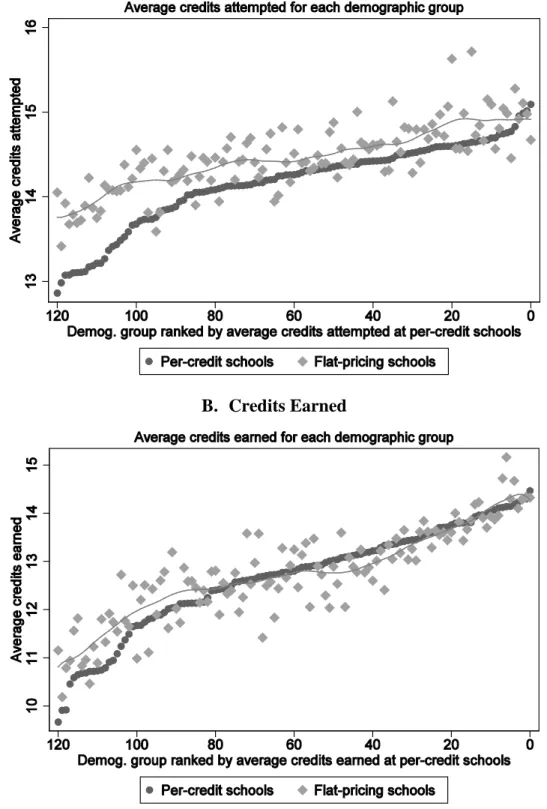
Figure 5 shows these results graphically.26 Groups are ordered according to the average number
of credits attempted (earned) at per-credit institutions so that those farthest left are the groups
24
most likely to attempt (earn) close the full-time minimum.27 The vertical distance provides an
estimate of the effect of flat pricing for each group. These comparisons are among very similar
students (e.g., among black non-special-education non-LEP females who were eligible for free or
reduced-price meals and scored a 23 on the ACT).
Consistent with the theory, we find estimated treatment effects on credits attempted are
largest for students closest to the full-time minimum: students at flat schools attempt about one
credit more, on average. Treatment effects diminish as we move up the distribution of average
attempted credits. Effects on credits earned are even smaller and close to zero for all but the
bottom third of groups. This suggests that our main results are indeed being driven by impacts on
credits attempted for those students who would locate near the 12-credit threshold under a
per-credit pricing scheme. Students in the bottom 20 demographic subgroups in Figure 5 are
overwhelmingly black (95%); 30% were eligible to receive free or reduced-price meals in high
school. The typical student in this group had an ACT composite score of 17.5 and attempted 13.2
credits. Students in the top 20 demographic subgroups are non-black, mostly female (80%) and
non-FARM (only 5% FARM), scored an average of 25.6 on the ACT, and attempted an average
of 14.6 credits. 28
Rather than combine multiple sources of heterogeneity into one index, we also explored
heterogeneity in our regression framework by explicitly contrasting effects by observable
27 The x-axis simply counts the number of student groups graphed where groups are ordered by the average credits
taken in per-credit schools. Only groups containing at least 50 students in each type of school are shown in Figure 5, though the pattern is unchanged if more groups are included.
28 In Appendix Table A5, we repeat our regression analysis separately by quintile of predicted credits attempted
25
characteristics, such as sex and eligibility for free or reduced-price meals. This heterogeneity
analysis was motivated by evidence of differential effects of other interventions for women
versus men (e.g., Anderson, 2008), the overtaking of men by women in college entry and
completion (Goldin, Katz, & Kuziemko, 2006), and the stronger response by low-income
students to college prices relative to their more advantaged peers (Kane, 1994; Dynarski, 2002).
These results (reported in Appendix Table A6) are largely consistent with the pattern depicted in
Figure 5: effects of flat pricing remain concentrated along the margin of attempted (not earned)
credits and withdrawal and are larger for low-income students. Though, in Table A6 there is
suggestive evidence that a subset of FARM and female students may translate a small share of
additional attempted credits into earned ones. These are likely to be high-achieving FARM and
female students, given the results in Table A5 (wherein we see a slight increase in the effect of
flat pricing on credits earned for students at the top of the distribution of predicted average
credits attempted). Still, for these two subgroups, the coefficients on the likelihood of earning
more than 12 credits are always half the magnitude (or less) of the corresponding coefficients on
the likelihood of attempting more than 12 credits – mitigated by the consistent effect of flat
pricing on course withdrawal.
E. Long-term Outcomes
We now explore the impact of marginal pricing on the longer-term outcomes of
persistence and credit accumulation. We track entry into and persistence through postsecondary
education using the National Student Clearinghouse (NSC). For each member of the high school
cohorts of 2008 through 2011, we identify students (of any intensity) that enrolled in a Michigan
26
(excluding the University of Michigan-Ann Arbor).29 Figure 6 plots the fraction of these students
enrolled in any college (Panel A) or a MI public 4-year university (Panel B) over time, separately
by the pricing policy of the first institution attended. Across all institutions, 96% of students
attend any college (including Michigan universities, community colleges, and private colleges)
in their second semester, though enrollment drops to 81% by the start of the fourth academic
year. Comparable rates for enrollment at a Michigan public university are 93% and 70%,
respectively.
With the University of Michigan-Ann Arbor excluded, rates of persistence beyond the
first year at any college or a Michigan public university appear slightly higher for students
starting at institutions with per-credit (rather than flat) pricing practices.30 These raw persistence
patterns do not control for the characteristics of students. When we control for such traits (Table
5), these patterns remain largely unchanged, though smaller in magnitude. In no case do we find
statistically significant differences in persistence patterns of students at flat-pricing colleges
compared to their observationally identical counterparts who start at per-credit-pricing
institutions, though coefficients are mostly small and always negative.
We now directly examine impacts on credits accumulated over several years. Recall that
STARR data contain information about all courses taken in 2011-2012 and in all prior terms,
among students still enrolled in the 2011-2012 academic year. Thus for all students in the 2008,
2009, and 2010 cohorts that persist to 2011-2012, we calculate cumulative credits attempted and
earned as of Spring 2012. We make two important sample restrictions. First, we restrict our
29
Very few students enter one of these institutions in the spring term, so the fall enrollment restriction is not too binding. Students that delay entry into or eventually transfer to a Michigan public university from private or community colleges are also excluded to ensure that the sample is similar across cohorts, given that later cohorts would mechanically have few delayed or transfer entrants.
30
27
analysis to students enrolled (at least part time) in any Michigan public 4-year college in all fall
and spring semesters since high school graduation (as indicated by the NSC), excluding
observations associated with the University of Michigan-Ann Arbor.31 This restriction permits us
to abstract from students’ decisions to persist and instead focus on credits accumulated among
those that have decided to persist in all periods.32 Second, we only keep students with complete
consistency between their NSC and STARR records. 33 This restriction assures we accumulate all
credits attempted and earned by an individual.34
In Table 6 we analyze cumulative credits attempted, cumulative credits earned, and
whether cumulative credits earned are above the threshold for on-time, all as of Spring 2012.
Since these on-time thresholds differ by student level (sophomore, junior, senior), we present
estimates separately by cohort. Overall, we find little evidence that flat pricing encourages
students to attempt or accumulate more credits over time. On average, students have attempted
59.0 credits and earned 54.5 by the end of their second year in college, but there is little
difference between students at per-credit and flat-pricing institutions. Nor are students at flat
institutions more likely to have earned 60 credits, a marker for graduating within four years.35
Results for the 2009 and 2008 cohorts are qualitatively similar: the typical student is attempting
and earning fewer credits than the on-time benchmark and there is minimal difference between
students at flat and per-credit schools. Any modest average attempted credit advantage seen
31 So members of the high school class of 2008 (2009, 2010) must be enrolled in a MI public university for all 8 (6,
4) fall and spring terms since high school graduation.
32
Further, our intention is to construct markers of on-time credit accumulation that are only relevant for students that have already chosen to enroll. Given the minimal impact on persistence, we do not believe this restriction creates grave concerns about sample selection bias.
33 Though NSC-STARR consistency is quite high in the 2011-2012 academic year (98%, similar for flat and
per-credit schools), it deteriorates in earlier years and becomes slightly worse at per-per-credit institutions. Thus results for the 2008 and 2009 cohorts that rely on historical data (such as cumulative credits) should be interpreted with some caution.
34 We find similar effects on credits attempted in 2011-2012 with this restricted sample as with the full sample
reported earlier. These results are available from the authors upon request.
35
28
among students at flat pricing institutions is greatly reduced when looking at credits earned.
These patterns of minimal impact of marginal price on cumulative credits attempted or earned
and persistence are robust to various sample restrictions, methods for addressing non-random
student sorting (group FEs, high school FEs), and controls for different institutional
characteristics.36
VII. Discussion and Conclusions
Using rich administrative data on all in-state students at the 15 public universities in
Michigan, this paper provides the first evidence on whether students’ educational investments
respond to marginal price incentives. We find that a zero marginal price (above the full-time
minimum) compels about 7 percent of students to attempt about one class more (i.e., up to 3
additional credits). Yet, additional attempted credits do not appear to translate into more credits
earned in a semester or cumulatively, greater persistence, or reduced time-to-degree, though
estimates of these outcomes are admittedly less precise and more variable across specifications.
This apparent wedge between credits attempted and earned is due to the increased propensity of
students exposed to flat pricing to withdraw from classes. Further, flat pricing is associated with
a small, but measurable and robust, 0.05 point reduction in semester GPA.
Institutions have voiced divergent views about the likely effects of marginal price. Some
have reduced the marginal price to zero in order to encourage students to “Finish in Four,” as
Adam’s State’s plan is called. Others see per-credit pricing as an equitable way of generating
revenue from students who consume more resources; in this vein “flat” pricing is viewed as a
subsidy to students who would have taken large course loads anyway. Our findings support this
latter interpretation, suggesting that increases in marginal price may be a non-distortionary way
for institutions to raise revenue. Additional revenue could be used to finance other interventions
29
with a stronger track record of improving student success, to increase financial aid, or possibly to
lower the average tuition price faced by students taking lower credit loads.
Our finding that incremental pricing has minimal impacts on credit-taking and
achievement stands in contrast to the rather large literature that documents substantial student
responses to price in other choice environments, such as the decision to enroll in college. Yet, the
postsecondary environment in which students encounter marginal prices differs in a number of
ways from the setting in which students make choices about college-going. Our theoretical
extensions describe various reasons why we might expect responses to marginal price to be
muted in the context of higher education. Our results are consistent with the presence of
substantial adjustment frictions, large or uncertain marginal effort costs, or large nonlinear
returns to degrees. All of these would dampen the effects of marginal price on student
course-taking or cause the effects on attempted versus earned credits to diverge. Policies designed with
large student price elasticities in mind (informed by the enrollment and college choice literature)
may not translate well to the goal of supporting and hastening student progress with marginal
incentives.
Another explanation for the limited effects of marginal price on college outcomes is that
marginal pricing policies may simply be less salient than the overall (average) price, which
determines enrollment and college choice. In Michigan, we see some variation in the salience of
pricing policies (and their relation to cost savings and time-to-degree) across institutions. For
example, Lake Superior State University exclaims in large, bold font at the top of its webpage on
costs: “LSSU offers a flat tuition rate for those taking 12 to 17 credits. This means you can take
30
years!”37 Other colleges simply state the overall or per-credit tuition prices, sometimes buried in
tables on registrar webpages. Lastly, students may respond to some other feature of price than
marginal price, such as average or expected marginal price, as has been observed in other
settings (Ito, 2013).
Our study has several limitations that future work should address. Though our setting and
analyses control for many possible confounders, we cannot entirely rule out differences in
institutional characteristics as a source of bias. Examining the experience of institutions that have
recently changed their marginal price is a promising strategy for addressing this type of bias. The
main results also suggest a need to dig deeper into the choices students make after entering
college to better understand the mechanisms at work. A task for future work is to separate
competing explanations, possibly through an experimental information intervention along the
lines of Chetty and Saez (2013). Finally, there are several other possible effects of marginal price
we have not yet explored: major choice, financial burden, and interest exploration. These too are
important questions for future research.
31
REFERENCES
Abadie, A., Chingos, M. M., & West. M. R. (2013). Endogenous stratification in randomized experiments. NBER Working Paper No. 19742.
Anderson, M. L. (2008). Multiple inference and gender differences in the effects of early intervention: A reevaluation of the Abecedarian, Perry Preschool, and Early Training projects. Journal of the American Statistical Association, 103(484), 1481-1495.
Angrist, J., Lang, D., & Oreopoulos, P. (2009). Incentives and services for college achievement: Evidence from a randomized trial. American Economic Journal: Applied Economics, 1(1), 136-163.
Baum, S., Conklin, K., & Johnson, N. (2013, November 12). Stop penalizing poor college students. New York Times, Opinion.
Baum, S., McDemmond, M., & Jones, G. (2014, July). Institutional Strategies for Increasing Affordability and Success for Low-Income Students in the Regional Public Four-Year Sector: Tuition and Financial Aid. Accessed 10/16/2014
at http://hcmstrategists.com/maximizingresources/images/Tuition_Paper.pdf
Bettinger, E. (2004). How Financial Aid Affects Persistence. In College Choices: The Economics of Where to Go, When to Go, and How to Pay for It, ed. Caroline Hoxby. University of Chicago Press.
Bitler, M. P., & Karoly, L. A. (2015). Intended and Unintended Effects of the War on Poverty: What Research Tells Us and Implications for Policy. Journal of Policy Analysis and Managmeent. 34 (3): 639-696.
Black, D. and J. Smith (2006). Estimating the Returns to College Quality with Multiple Proxies for Quality. Journal of Labor Economics, 24(3), 701-728.
Bound, J., Lovenheim, M. F., & Turner, S. (2012). Increasing time to Baccalaureate degree in the United States. Education Finance and Policy, 7(4), 375-242.
Bound, J., Lovenheim, M. F., & Turner, S. (2010). Increasing time to Baccalaureate degree in the United States. NBER Working Paper Series, No. 15982.
Borenstein, S. (2012). The Redistributional Impact of Nonlinear Electricity Pricing. American Economic Journal: Economic Policy, 4(3), 56-90.
32
Castleman, B. L. and Long, B. T.. (2013). Looking Beyond Enrollment: The Causal Effect of Need-Based Grants on College Access, Persistence, and Graduation. NBER Working Paper No. 19306
Chetty, R., Friedman, J., Olsen, T., & Pistaferri, L. (2011). Adjustment Costs, Firm Responses, and Micro vs. Macro Labor Supply Elasticities: Evidence from Danish Tax Records. Quarterly Journal of Economics, 126, 749-804.
Chetty, R., & Saez, E. (2013). Teaching the Tax Code: Earnings Responses to an Experiment with EITC Recipients. American Economic Journal: Applied Economics, 5(1), 1-31.
Cornell Higher Education Research Institute. (2011). 2011 Survey of Differential Tuition at Public Higher Education Institutions.
Access: http://www.ilr.cornell.edu/cheri/upload/2011CHERISurveyFinal0212.pdf
Cornwell, C., Hee Lee, K., & Mustard, D. B. (2005). Student responses to merit scholarship retention rules. Journal of Human Resources, 40(4), 987-917.
DesJardins, S., & McCall, B. (2010). Simulating the effects of financial aid packages on college student stopout, reenrollment spells, and graduation chances. The Review of Higher Education, 33(4), 513-541.
DiNardo, J., Fortin, N. M., &Lemieux, T. (1996). Labor market institutions and the distribution of wages, 1973-1992: A semiparametric approach. Econometrica, 64(5), 1001-1044.
Dynarski, S. M., Hemelt, S. W., & Hyman, J. (2015). The missing manual: Using National Student Clearinghouse data to track postsecondary outcomes. Educational Evaluation and Policy Analysis, 37(1S), 53S-79S.
Dynarski, S. (2008). Building the stock of college-educated labor. Journal of Human Resources, 43(3), 576-610.
Dynarski, S. (2003). Does aid matter? Measuring the effect of student aid on college attendance and completion. American Economic Review, 93(1), 278-288.
Dynarski, S. (2002). The behavioral and distributional implications of aid for college. American Economic Review, 92(2), 279-285.
Ehrenberg, R. G. (2012). American higher education in transition. Journal of Economic Perspectives, 26(1), 193-216.
33
Garibaldi, P., Giavazzi, F., Ichino, A., & Rettore, E. (2012). College cost and time to complete a degree: Evidence from tuition discontinuities. Review of Economics and Statistics, 94(3), 699-711.
Goldin, C., Katz, L. F., Kuziemko, I. (2006). The homecoming of American college women: The reversal of the college gender gap. Journal of Economic Perspectives, 20(4), 133-156.
Goldrick‐Rab, S., Harris, D. N, Benson, J., & Kelchen, R. (2011). Conditional Cash Transfers and College Persistence: Evidence from a Randomized Need‐Based Grant Program. Institute for Research on Poverty Discussion Paper no. 1393‐11
Hemelt, S. W., & Marcotte, D. E. (2011). The Impact of Tuition Increases on Enrollment at Public Colleges and Universities. Educational Evaluation and Policy Analysis, 33(4), 435-457.
Hemelt, S. W., & Marcotte, D. E. (2015). The Changing Landscape of Tuition and Enrollment in American Public Higher Education. Unpublished Working Paper. University of North Carolina at Chapel Hill.
Hausman, J. A. (1981). “Labor Supply.” In How Taxes Affect Economic Behavior, ed. Henry J. Aaron and Joseph A. Pechman, 27–71. Washington, DC: Brookings Institution.
Hausman, J. A. (1985). Taxes and Labor Supply. In Handbook of Public Economics, Vol. I, ed Alan Auerbach and Martin Feldstein. Elsevier Science Publishers (North-Holland)
Ito, K.. (2013). How Do Consumers Respond to Nonlinear Pricing ? Evidence from Household Water Demand. Working Paper, Stanford University.
Ito, K.. (2014). Do Consumers Respond to Marginal or Average Price? Evidence from Nonlinear Electricity Pricing. American Economic Review, 104(2), 537-63.
Jacob, B., McCall, B. P., & Stange, K. (2013). College as Country Club: Do Colleges Cater to Students’ Preferences for Consumption? NBER Working Paper No. 18745. January 2013.
Kane, T. J. (2006). Public Intervention in Postsecondary Education, In Eric Hanushek and Finis Welch (eds.) Handbook on the Economics of Education, Amsterdam:
Elsevier/NorthHolland.
Kane, T. J. (1994). College entry by blacks sine 1970: The role of college costs, family
background, and the returns to education. Journal of Political Economy, 102(5), 878-911.