Research Master Political Science and Public Administration Master thesis - Final version
August 7, 2014
Marijn A.M. Nagtzaam S0846155
Supervisor: Dr. M.F. Meffert
Second reader: Prof. Dr. J.J.M. van Holsteyn
Abstract
The main hypothesis which is tested in this paper is that voters who experience more fear are more likely to vote for radical right parties. The underlying idea of this hypothesis is that important
explanations mentioned in the literature about the radical right vote are based on the experience of some sort of economic or symbolic threat. Research has shown that fear can influence people's decision-making and electoral behavior. Different analyses conducted in the paper support the claim
that fear as a personal characteristic plays a role on its own when it comes to voting for radical right
parties. While the measurement of fear was not optimal, the results show that further research should take the role of fear into account. These studies also have the task to find better ways to
Introduction
After the Second World War the extreme right and their ideas were - for obvious reasons - de-legitimized. Therefore, the extreme right was largely insignificant until the 1970s. In the mid-1980s through 'the development of a new, innovative master frame (...) the extreme right was able to escape marginalization' (Rydgren, 2005: 414). This new frame combined 'ethnonationalist xenophobia based on the doctrine of ethnopluralism with anti-political establishment populism'
(Rydgren, 2005: 432). In 1984 the French Front National was the first party which gained success with this new master frame. This success led to the adaption of the new frame by parties in other countries and a new 'party family' emerged (Rydgren, 2005).
In this paper I use the term radical right parties to refer to this group of parties, however in
the literature there is no consensus about the name which is given to this party family. These parties are also called extreme right parties (e.g. Carter, 2005), populist right parties (Ivarsflaten, 2008) or anti-immigrant parties (e.g. Fennema, 1997; Van der Brug et al., 2000). I use the term radical right party because this is the most often used term (Van der Brug & Fennema, 2007: 474). According to Rydgren (2007) the use of 'radical' in the name of this party family is better than 'extreme' because
these parties do not oppose to democracy as an idea. He reserves the term extreme for organizations who operate outside the democratic political institutions.
Radical right parties have received much attention in scholarly literature the last decades. One of the relevant questions is why people vote for radical right parties. The main focus of previous research has been on social and demographic background characteristics of those voters (e.g.
Lubbers et al., 2002; Van Gent et al., 2013), their anti-immigrant attitudes (e.g. Ivarsflaten, 2008; Rydgren, 2008), anti-establishment attitudes (Rooduijn, 2013) and the experience of economic difficulties (e.g. Lubbers et al., 2002). A common thread among many of these explanations is the perception of some economic or symbolic threat. This - possible - underlying dimension of fear as a
personal characteristic has received much less attention. Interest in emotions within the field of political psychology is relatively new, but the amount of literature which shows evidence that emotions shape political outcomes is rapidly growing. The consequences of emotions for voter decision-making in election campaigns is one of these topics (Brader and Marcus, 2013). Several studies confirmed that threat relates to right-wing attitudes (Onreat et al., 2013: 791). However,
when it comes to voting for radical right parties the role of emotions - and in particularly the role of fear - did not get direct attention. In other words, fear is tested indirectly through for example anti-immigrant attitudes, but not directly as a predictor on its own. Given the obvious goal of the radical right rhetoric - to induce fear and anxiety among the public - this is surprising.
Fear, which follows from cultural and economic threats due to immigration, is an emotion
whether fear has a direct influence on voting for radical right parties because if the hypothesis would
be confirmed this would mean that current explanations for the radical right vote have an important underlying dimension. My research question therefore will be: Does a general feeling of fear facilitate voting for radical right-wing parties, and is this a specific characteristic for radical right party voters? I intend to answer this question in a study based on data from the European Values Study 2008 for radical right parties in seventeen European countries.
I will first discuss the most important explanations for the radical right vote, followed by a discussion how fear could have an effect for the radical right vote. Next I will explain how I test the role of fear. In the last two sections of this paper the results of the analysis and a conclusion are given.
Explanations for the radical right vote
Anti-immigrant attitudes and levels of immigration
Authors who use the term anti-immigrant parties often use this term due to the importance of the anti-immigrant rhetoric used by these parties (e.g. Fennema, 1997) and the fact that grievance over immigration is the only characteristic which unites all these parties (Ivarslfaten, 2008: 17-18).
Furthermore, anti-immigration positions ‘dominates the images voters have of these parties’ (Rydgren, 2008: 740). While it is not the only attitudinal factor which matters, anti-immigrant attitudes are perhaps the most import ones and 'even if not all voters who hold anti-immigration attitudes vote for a new radical-right wing party, most voters who do vote for such parties hold such attitudes' (Rydgren, 2007: 250).
In an article about the electoral impact of the British National Party (BNP) at the 2010 British General election Cutts and Goodwin found that people who thought that the most important issue was immigration were five times more likely to vote for the British National Party (2014: 110). Different other studies have also shown that anti-immigrant attitudes facilitate voting for
radical-right parties (e.g. Lubbers et al., 2002; Norris, 2005; Zhirkov, 2014). These anti-immigrant attitudes should not be mistaken as a result from xenophobic attitudes, even if radical-right parties have xenophobic political programmes. Much more important as a predictor for the radical right vote is immigration scepticism (Rydgren, 2008: 760).
Zhirkov summarizes two interpretations which could explain anti-immigrant attitudes in
advanced Western democracies and Western Europe in particular. The first interpretation is based on the classic work The Authoritarian Personality (Adorno et al., 1950), and essentially argues that ‘anti-immigrant attitudes can be seen as an instance of general xenophobia and intolerance related to a wider authoritarian syndrome’ (Zhirkov, 2014: 287)1. The second interpretation puts emphasis
on perceived economic conflicts and explains anti-immigrants positions ‘in terms of realistic group
conflict theory and competition over jobs between immigrants and natives’ (Zhirkov, 2014: 287). Also with regard to other scarce resources such as housing, welfare state benefits, or even the marriage market voters could prefer to reduce competition in these areas (Rydgren, 2007: 250).
The latter explanation, however, might be too simplistic. In a study on the success of the Belgium Vlaams Blok, Coffé et al. (2007) for example found that there is a different relationship
between population from Maghreb and Turkey and Vlaams Blok vote share on the one hand and population from other countries and Vlaams Blok vote share on the other hand. The first has a (highly significant) positive correlation, while the second has a (non-significant) negative correlation. This suggests that it is not the overall number of presence of foreigners which matters but that the
religious or ethnic origin of immigrants, especially for those from an Islamic culture (2007: 149, 153), makes a difference. This relates to a discussion about the relationship between intergroup threat and out-group attitudes and the interplay between realistic group conflict theory and symbolic racism theory. I will return to this discussion in the next section about the role of fear.
While at the individual-level the effect of anti-immigrant attitudes is fairly robust, at the
aggregate level results of the relationship between the (relative) number of immigrants living in a country and vote share for radical right parties show mixed results. Only a small amount of researchers found a positive correlation between both (Van der Brug & Fennema, 2007: 483; see for example Knigge, 1998). Newman found that the real or perceived increase of immigrants in one’s
environment can trigger the perception of threat if the initial number of immigrants was low (Newman, 2013).
Based on the realistic group conflict theory the expectation would be that in constituencies or countries with relative more immigrants more people would vote for radical right parties, but research on this topic shows only weak support for this theory (Rydgren, 2007: 250). One of the
reasons therefore is that most competition over these scarce resources is not national, but local. But even when this is taken into account support for the theory is not strong. Rydgren shows that in only in the Netherlands and Denmark voters who 'live in immigration-dense areas [are] significantly more likely to vote for the radical right' (Rydgren, 2008: 761). In Austria, Belgium, France and Norway he did not find such effects.
Economic perceptions and conditions
Economic concerns are not limited to competition with immigrants. The perception of economic problems in general and the threat of losing one's job facilitates voting for radical right-wing parties. This applies, of course, also and especially to those already without a job (Lubbers et al., 2002; Steininger & Rotte, 2009). This is related to the relative deprivation thesis, which has mostly been operationalized in economic terms. Relative deprivation occurs when someone compares his or her
own current situation in a negative way with the past or with other groups (Rydgren, 2008). Although a negative evaluation of someone's own economic situation does seem to have a positive influence on the radical right vote, a bad economic situation does not automatically lead to an increase in votes for radical right parties. It might well be that in times of economic prosperity other issues than
the economy, such as for example anti-immigrant issues, are more salient. Therefore radical right parties might be more successful when socioeconomic issues are less important (Hofstadter, 2002; cited in Rydgren, 2008).
At the aggregate level, however, some researchers found a negative effect between unemployment levels and voting for radical right-wing parties (see for example Lubbers et al., 2002;
Knigge, 1998). This seems to be counterintuitive but 'it could be that people in these circumstances are afraid to lose what they have gained in times of economic prosperity' (Lubbers et al., 2002: 371) and therefore vote for such parties. Such counterintuitive findings suggest that it is less the actual experience that matters but a more diffuse experience of fear and anxiety caused by a perceived
threat. This fits well with the hypothesis that a general feeling of fear facilitates voting for radical right parties, but I will come back to this topic later.
The radical right vote as a protest vote
A core message of populist parties is the rejection of the political establishment, both parties and politicians. Especially voters who are disappointed by and cynical about the traditional parties and
who do not feel represented by them anymore, are supporters of populist parties. Also voters who have lower trust and confidence in democratic institutions and who are dissatisfied with how democracy works are more likely to vote for radical right parties (Lubbers and Scheepers, 2002; Norris, 2005). In other words, according to radical right voters ''the established order' has no idea of what ordinary people find important and only think about their own interests' (Rooduijn, 2013: 82).
stronger protest attitudes. Schumacher and Rooduijn further found that from both populist parties
they analyzed 'only the PVV has pure protest voters, which means that it is purely the anti-elitist message of the party that sways these voters' (2013: 132). This was the only radical right party they analyzed and shows support for the thesis that radical right parties attract pure protest voters. However, while radical right parties are often seen as protest parties, protest attitudes do not unite these parties to the same extent as anti-immigrant attitudes do (Ivarsflaten, 2008: 18). While
basically all radical right parties attract voters with anti-immigrant attitudes, not all radical right parties attract protest voters. Also Van der Brug et al. (2000) draw the conclusion that voters for radical right-wing parties should in the first place be considered as policy voters. Thus, there are studies which conform the idea of radical right voters as protest voters and there are studies which
reject this idea. An explanation therefore could be that the radical right vote is much more a protest vote when the radical right party first enters the political arena. Those who vote for a radical right party as a protest vote tend to go back to their original party of preference after one or two elections, leaving only the voters who identify themselves with the ideology of the radical right party as supporters of these parties (Rydgren, 2008). Therefore one could expect that in countries with
relatively younger radical right parties (such as Alliance for the Future of Austria in Austria, Ataka in Bulgaria, Party for Freedom and Proud of the Netherlands in the Netherlands) the effect of protest attitudes on the radical right vote is stronger than in countries with radical right parties who already are longer represented in parliament. In general the expectation is that voters who have lower trust
in democratic institutions are more likely to vote for radical right parties.
Nationalism and European integration
Another key characteristics of radical right parties is their nationalism. It is however a specific form of nationalism which applies to these parties. This form of nationalism 'emphasizes the antagonistic relationship between the Good nation and the Evil outsiders' (Rooduijn, 2014: 82). According to
Mudde this form of nationalism can be referred to as nativism. This type of nationalism can be defined as 'an ideology, which holds that states should be inhabited exclusively by members of the native group ("the nation") and that non-native elements (persons and ideas) are fundamentally threatening to the homogeneous nation-state' (Mudde, 2007: 19) and forms a combination of nationalism and xenophobia (Mudde, 2007: 24). The most important and threatening 'non-native
Related to this nativist character is the often Eurospectic view of radical right parties. Given
the threat that is perceived by non-native elements in this ideology, it is not surprising that also European integration is considered as a negative trend. An example of such a party is the British National Party. Cutts and Goodwin found Eurosceptic voters are more likely to vote for the BNP than voters who are in favor of closer cooperation with the European Union (Cutts and Goodwin, 2014: 110). Radical Right parties are opposed to admitting new members to the European Union and
further economic and political integration. These conflicts however tend to focus on social values and symbolic issues, rather than specific economic or policy issues.
Therefore I expect that both nationalistic people and those who are against (further) European integration are more likely to vote for radical right parties. Although there might be a
difference between the effect of these predictors in different countries. These effects might be stronger in countries who experience more disadvantages of globalization and European integration and less stronger in countries who experience more advantages of globalization and European integration.
Ideology and values
The ideological location of radical right wing parties is - as the name suggests - on the far right of the political spectrum. This means that voters for radical right wing parties tend to be more conservative, in favor of the status quo and opposed to social change. Therefore, these voters among other things consider the values of postmodernization as a threat to ‘traditional values and national culture’
(Zhirkov, 2014: 288). Postmodernization has winners and losers and those who are considered to be "modernization losers" want to undo the change that is associated with modernization (Minkenberg, 2003) because they have the chance of becoming ‘superfluous and useless for society’ (Betz, 1994: 32). These "modernization losers" in 'practical terms has usually come to refer to unemployed people and unskilled workers threatened by unemployment in the near future' (Rydgren, 2008).
Ideology in this sense is associated with the nativist character of radical right parties described above. Furthermore, parties from this party group share 'an authoritarian outlook (...) [and] aim for a society that is strictly ordered, and therefore emphasizes the importance of law and order' (Rooduijn, 2013: 82). Political conservatism can also be considered as motivated social cognition. Conservatism is here related to 'dogmatism, intolerance of ambiguity, openness to experience,
Socio-demographical characteristics of the radical right voter
Previous research has shown that unemployed, less educated, non-religious, younger and male2 voters are more likely to vote for radical right-wing parties in general (e.g. Lubbers et al., 2002; Van Gent et al., 2013; Zhirkov, 2014). The effects of unemployment on the radical right vote already have been discussed above. A further remark has to be made about the education level of radical right voters. While Lubbers et al. (2002) found that lower educated people are overrepresented under
radical right voters, other studies find that 'the radical right receives its strongest support from the mid-school stratum' (Rydgren, 2008: 249). Most of these socio-demographic characteristics lack an underlying theory. I will include these factors as additional predictors and treat them as control variables.
The role of fear
A common thread among the reviewed explanations above is the perception of some economic, cultural or symbolic threat. Given the obvious goal of the radical right rhetoric - to induce fear and anxiety among the public - it is surprising that it has not been tested before if the experience of fear has a direct influence on voting for radical right parties. Certainly now the amount of literature which
shows evidence that emotions shape political outcomes is rapidly growing (Brader and Marcus, 2013). Emotional reactions can be conceptually classified in various ways. The most recent approaches can be classified as 'neural process theories'. In these theories three dimensions of affective appraisal are considered to be important. Also the theory of affective intelligence, 'the most prevalent theoretical formulation in political psychology' (Brader and Marcus, 2013) has adopt these
three dimensions. These three dimensions focus on enthusiasm, anxiety and anger. In this study I focus on fear and anxiety since these are "defensive" emotions (Brader and Marcus, 2013: 177). It is precisely this defensive reaction against a specific threat which provide a link to the explanatory factors discussed earlier.
Fear is one of the most studied emotions and closely related with anxiety. Some scholars argue there are differences between both. For example the distinction between generalized anxiety disorders and specific fears made by clinical psychologists (see Brader and Marcus, 2013). However, the terms are used interchangeably by most political psychologists (Brader and Marcus, 2013: 177), which is what I will do in this paper. Fear is considered as ‘a product of an emotional system (…) that
monitors the environment for potential threats and adapts behavior accordingly. (…) [It] motivates (…) risk-aversive behavior, including actions aimed at prevention and protection, conciliatory acts, hiding, and flight’ (Brader and Marcus, 2013: 178). One of the many events which can activate fear are “stereotypic portrayals of threatening out-groups” (Brader et al., 2008, cited in Brader and
2
Marcus, 2013).
In a meta-analytic review Riek et al. describe the relationship between intergroup threat and out-group attitudes. They observe a shift from two competing theories towards a more integrated approach. At first realistic group conflict theory (RGCT) and symbolic racism theory where two competing theories. The RGCT described a process in which two groups had to compete for scarce resources. When this is the case, in-group solidarity may be increased, which leads to a larger
distinction between in-group and out-group and intergroup hostility. It is even less important if the self-interest of a member of the group is threatened directly. A member of the group can also perceive a threat when his or hers self-interest is not threatened directly but the interest of the group is threatened (Riek et al., 2006: 336-337; see also Sherif & Sherif, 1969 and Bobo, 1983). This is
related to the earlier mentioned relationship between economic perceptions and the radical right vote. In other words, the findings of Lubbers et al. (2002) that people seem to have a defensive reaction to 'protect' their jobs by voting for radical right parties when the feel threatened by out-groups.
On the other hand, the symbolic racism theory described a process were racism did not results
from competition over scarce resources but from conflicting values and beliefs. When members of one group perceive a larger gap between their own values and the values of another group, this may lead to increased negative out-group attitudes (Riek et al., 2006: 337-338). This approach seems more related to the anti-immigrant attitudes radical right voters have.
While these two views were considered as competing at first, more recently they are seen as complementary. In this view it is not only competition over scarce resources or value conflict which influence negative out-group attitudes, but a combination of both (Riek et al., 2006; McLaren, 2001; Wilson, 2001). At the end of their review Riek et al. concluded that integrative frameworks are indeed 'advantageous relative to examining each threat type separately' (Riek et al., 2006: 345).
However there are still uncertainties since it is difficult to know exactly the direction of causality between (perceived) threat and negative attitudes. Experimental studies could give a better insight in this relationship (Riek et al., 2006), however that is beyond the scope of this paper. This complementary view and the related complexity shows perhaps also why some studies on why people vote for radical right parties found counterintuitive or contradictory results, because the
focus often on one of these theories, while the interaction between both also seems important. It can also account for the findings of Coffé et al. (2007), since the symbolic racism theory can explain why it is only the presence of a specific group of foreigners which leads to voting for radical right parties.
Radical right parties often use a kind of rhetoric which focuses on threats resulting from both
level there is a positive relationship between threat indicators (for example inflation, unemployment
and life expectancy) and right-wing attitudes. According to Hatemi et al. ‘individuals with a higher degree of social fear have more negative out-group opinions, which, in this study, manifest as anti-immigration and prosegregation attitudes’ (2013, 279). Social fear, according to psychological theories, can arise when people ‘who are naturally more prone to insecure attachments to others, and thus disproportionately fear the loss of such attachments, are also more prone to being anxious
of new people and novel situations that might threaten those relationships’ (Hatemi et al., 2013: 280). Thus, the goal of the rhetoric used by radical right parties is to create a feeling of fear for such threats by those voters who are sensitive for such a rhetoric. The strategy used by radical right parties - offering easy 'solutions' for the perceived threats - can be particularly successful if they can
activate existing negative group stereotypes (Brader, Valentino and Suhay, 2008).
Fear might also reflect a more fundamental personal predisposition for anxiety. It is increasingly clear that “fear constitutes both a genetically informed, stable, but malleable trait-based disposition, as well as a transitory state-based response that can be elicited or manipulated by environmental conditions“ (Hatemi et al. 2013: 280). Thus, fearful reactions can also have a
genetically informed cause. Fear is also associated with political conservatism and extremism (Jost et al, 2007), which can arise from uncertainty avoidance and threat management.
Based on these arguments, one would expect that people who experience fear or are sensitive to the induction of fear are more responsive to the rhetoric which is used by radical right parties.
That’s why I expect that voters who experience more fear are more likely to vote for radical right parties.
Methodology
To test these explanations I will use two multilevel logistic regression models. A multilevel model makes it possible to account for methodological details and use predictors from different levels. The
model in this study has two levels. The first level of this model will contain individual predictors and the second level contains predictors at the country level. I use a logistic regression model since the dependent variable is dichotomous. I use two models to contrast radical right voters with both other party voters (model 1) and people who said they would not vote (model 2). There are two reasons to use two models instead of one. First, if one model would be used and in this model radical right
possible to also say something about the difference between voters for radical right parties and
people who would not vote.
The data for the individual level will be obtained from the European Values Study (EVS) 2008. Except for Finland (internet panel) and Sweden (postal survey) this study uses face-to-face interviews. A basic English questionnaire was translated into other languages. In some cases country specific questions were asked, but they are of no relevance for this study.
Case selection
Seventeen countries will be included in the analysis (see table 1). These countries are included because they have at least one
radical-right wing party based on a list of radical right-wing parties from Zirkov (2014), Werts et al. (2013) and expert surveys given in the documentation of the EVS3 (selected radical right parties are shown in table 1).
Another possibility would be to include only countries were radical right-wing parties are successful. However, this would lead to a biased case selection. Given this selection
of countries the initial sample size is 26.352. Including multiple countries has as an advantage that it is possible to say something about the relationship between fear and voting for the whole radical right
party 'family' instead of the relationship between fear and only one specific party.
The dependent variables
As discussed above I will conduct two multilevel logistic regression analyses to
compare radical right wing voters with
other party voters and citizens who abstain. The dependent variable for the first model is if a respondent would vote for a radical right-wing party. In the EVS respondents were asked for which
3
Based on these sources three other countries could also have been included: Norway, Sweden and the United Kingdom. However, it was not possible to identify the radical right voters in Sweden and the United Kingdom, since these were not (individually) included in the questionnaire. For Norway, see footnote 4.
Table 1. Selected countries and parties Country Radical right-wing parties
Austria Freedom Party of Austria
Alliance for the Future of Austria Belgium *
- Flanders Vlaams Belang - Wallonia National Front
Bulgaria Ataka
Denmark Danish People's Party
Finland True Finns
France National Front
National Republican Movement
Germany Republikaner
National Democratic Party German People's Party
Greece LAOS
Hungary Miép
Jobbik
Italy Lega Nord
Fiamma Tricolore Netherlands Party for Freedom
Proud of the Netherlands
Poland LPR
Romania PRM
Slovakia SNS
Slovenia SNS
Switzerland Swiss People's Party Swiss Democrats
Federal Democratic Union Freedom Party
Ticino League
Turkey MHP
party they would vote if there 'would be a general election tomorrow'. Those respondents who said
that they would vote for one of the parties mentioned in table 1 are coded with a 1 and respondents who said they would vote for another party are coded as a 0. The dependent variable for the second analysis is also a dichotomous variable which distinguish voters for radical right parties (coded as 1) and citizens who answered they would not vote if elections were held (coded as 0).
Self-reported vote is in theory not the only possible dependent variable. Also evaluation
scores by voters for radical right parties would be an option. The use of evaluation scores make it possible to measure the relationship between all voters and their attitude towards radical right parties directly. Together with a large range of possible answers a this could give possibilities to look in more detail to this relationship. Furthermore, if both linear regression models with evaluation
scores and logistic regression models with vote intention are used and results show the same pattern this gives more weight to the conclusions. However, evaluation questions were not asked in the EVS and therefore I will only use vote intentions. This is not per se a bad solution, but if evolution scores also could have been used it would just have mean I had some more options for my analysis.
Measuring fear
At the individual level the - for the goal of this study - most important predictor is 'fear'. This predictor will be based on five questions from the EVS which are about fear for different phenomena. These five items could be considered as possible threats. If respondents perceive these threats, these treats can induce fear. As discussed earlier this fear could both be more genetically informed as well
as politically motivated. Important is that respondents were asked whether they were afraid of a certain issues. Based on these five questions a fear scale will be made which will be used to analyze the influence of fear. Respondents were asked whether they were afraid of4:
1. The loss of social security;
2. The loss of national identity and culture;
3. (Country) paying more and more to the European Union; 4. A loss of power in the world for (country);
5. The loss of jobs in (country).
For each of these five items respondents could answer on a 10 point scale, ranging from 1 (very much afraid) to 10 (not afraid at all). For the fear scale these variables will be recoded in such a way that they range from not afraid at all (1) to very much afraid (10).
Based on a principal component analysis and a reliability analysis combining these five items into one fear scale can be justified. The principal component analysis (PCA) showed only one
4
component with an eigenvalue above one (Eigenvalue = 3.253 with 65.1 percent explained variance).
The results of a reliability analysis with the five items also supported the use of a single fear scale (α = .865). Excluding one of the items would have lowered Cronbach’s Alpha. In appendix A results of the same tests are shown per country. These results show support for a single fear scale in all countries. Differences between the countries are only small and for all countries only one component and a high Cronbach's Alpha was found.
For each respondent the scores off all the questions they answered will be add up and dived by the numbers of questions the respondent answered. Thus, the fear scale which will be used in my model is based on these five items and measured on a 10 point scale.
It should be noted that this way of measuring fear is not automatically the best way. One of
the reasons therefore is that not all persons have the same conceptualization about specific emotions (Brader and Marcus, 2013: 187), which makes measuring emotions trough surveys more difficult and could lead to validity problems. Furthermore, the questions which are used to create the fear scale might have a right-wing bias. This would of course be a problem. But since some of the (more economic) items are certainly not only related to radical right parties and the strong support
for one fear scale, this does not seem to be a problem. Therefore, to get a first impression about the effect of fear on voting for radical right-wing parties and the fact that PCA and reliability analysis show very strong support for a single fear scale the way fear is operationalized in this study is sufficient. But in the conclusion this reservations should be kept in mind.
Other explanatory variables at individual level
Next to the fear predictor other predictors mentioned in previous research will be included in both models. At the individual level sixteen other variables to control for other explanations for radical-right wing voting based on previous research will be included, these can be obtained from the EVS 2008 dataset. First, four variables are included which measure anti-immigrant attitudes. These are all
measured on a 10 point scale. The questions and the possible answers for these variables are given in table 2.
Table 2. Anti-immigrant attitudes
Predictor Question Scale *
Jobs Immigrants take away jobs from
[nationality]
01 - Do not take away 10 - Take away
Cultural life Immigrants undermine [country]
cultural life
01 - Do not undermine cultural life 10 - Undermine cultural life
Crime problems Immigrants increase crime problems 01 - Do not make it worse
10 - Make it worse Welfare system Immigrants are a strain on welfare
system
01 - Are not a strain 10 - Are a strain
To account for economic perceptions and conditions a dichotomous variable if a respondent is
unemployed or not will be included. Next, confidence in parliament and confidence in government (both measured on a 4-point scale, from 'a great deal' to 'none at all') and evaluation of the current government (measured on a 10 point-scale, from 'very bad' to 'very good') are included to test the hypothesis about the radical right vote as a protest vote. To test the hypotheses about nationalism and European integration two variables will be included. First, nationalism (how proud are you to be
a (country) citizen, measured on a 4 point scale, from 'not at all' to 'very proud'). Second, European unification (measured on a 10 point-scale, ranging from 'should gone further' to 'has gone too far'). Furthermore, a variable will be included with the self-reported position of a respondent on the left-right scale (measured on a 10-point scale, from 'left' to 'left-right')
Last but not least, some socio-demographic characteristics are included: male gender, age (in years), highest education level (measured on a 8-point scale), annual household income (measured on a 12-point scale), and attendance of religious services (measured on a 7-point scale, from 'more than once a week' to 'never, practically never').
Independent variables for country level
For the country levels I include the following variables in my model: unemployment level in 2008 and the relative number of immigrants in 2005. For unemployment and relative number of immigrants also the relative change compared to respectively 2007 and 2000 will be included. Unemployment figures are taken from the websites from Eurostat and Trading Economics (for Switzerland)5. Figures
about immigrants are obtained from publications from the United Nations6.
Results
In appendix B descriptive statistics for the variables included in the models are given (for most variables the average and the standard deviation is given). The first thing that should be noted is the relatively high amount of respondents in the European Values Study who said they would vote if
elections were held the next day. When these 'EVS-turnout' figures are compared with actual turnout figures of national elections 'EVS-turnout' is much higher (see table 3). Only for Turkey the difference is below five percentage points. For the other countries the difference is much higher. For France the difference is 29,3 percentage points and for Romania even 36,6 percentage points. This could influence especially the results of the logistic regression which compares radical right voters with
citizens who abstain. This last group is either underrepresented in the sample of the EVS or
5
http://appsso.eurostat.ec.europa.eu/nui/show.do?dataset=une_rt_a&lang=en and http://www.tradingeconomics.com/switzerland/unemployment-rate
6
Table 3. Turnout national elections and EVS results Country EVS Nat. elec. Year Difference
Austria 84,8% 78,8% 2008 6,0%
Belgium 96,1% 87,2% 2010 8,9%
Bulgaria 69,0% 60,2% 2009 8,8%
Denmark 97,3% 87,7% 2011 9,6%
Finland 88,6% 70,4% 2011 18,2%
France 89,5% 60,2% 2007 29,3%
Germany 79,5% 70,8% 2009 8,7%
Greece 88,8% 70,9% 2009 17,9%
Hungary 74,2% 64,4% 2010 9,8%
Italy 85,8% 80,5% 2008 5,3%
Netherlands 88,0% 74,7% 2010 13,3%
Poland 65,6% 48,9% 2011 16,7%
Romania 75,8% 39,2% 2008 36,6%
Slovakia 79,2% 58,8% 2010 20,4%
Slovenia 73,8% 64,7% 2011 9,1%
Switzerland 70,3% 48,6% 2011 21,7%
Turkey 88,7% 87,2% 2011 1,5%
Source election turnout: http://www.parties-and-elections.eu respondents are less likely to admit
they would not vote in elections.
Further, we can see in the appendix that there are substantial differences between radical right support in the different countries.
Support is highest in Switzerland (23%), Austria (19%) and Finland (12%) and lowest in Wallonia, France and Germany (2%). Two remarks have to be
made about vote intentions of
respondents in the EVS. First, since it is not a focused electoral study actual electoral choices from respondents could be different if elections are held
(much) later (Zhirkov, 2014). Second, since voting for radical right parties might be socially undesirable, respondents could decide not to answer they would vote for a radical right party (Vanhoutte & Hooghe, 2013). Also the fear levels between the countries differ quite substantial. Fear levels are highest in Finland, Slovenia and Turkey (with averages above 7) and lowest in Bulgaria,
Denmark, Poland and Romania (with averages below 5,5).
In table 4 the results of the two multilevel logistic regression analyses are given. The first model shows the radical right voters compared to voters for other parties. The second model shows the radical right voters compared to citizens who abstain. Below the results of both models are discussed7.
Radical right voters versus other party voters
As expected the fear scale has a significant influence in the model were radical right voters are contrasted with voters for other parties. A voter is 1,11 times more likely to vote for a radical right party if his or hers fear level increases with one unit. At the individual level most predictors have a significant effect in the expected direction based on the reviewed explanations. Only two predictors
have an unexpected effect, because income and unemployment have an odds ratio of 1,00 and thus has no effect while a negative respectively positive effect was expected. Furthermore, two variables
7 Some models were tested in which random slopes were used. Especially for predictors related to protest
have an effect which is in the expected direction, but are not significant. These two predictors are
nationalism and one of the anti-immigrant attitudes (crime problems). Given the consensus in the literature about anti-immigrant issues the fact that one of these items is not significant is surprising, but since the other three anti-immigrant attitudes are significant, there is no reason to doubt the relationship between anti-immigrant attitudes and voting for radial right parties.
Table 4. Voting for Radical Right Parties
Model 1:
Vote for Radical Right Party versus vote for other party
Model 2:
Vote for Radical Right Party versus abstain
Fixed effects 95% C.I. for
odds ratio
95% C.I. for odds ratio
Odds ratio Lower Upper Odds ratio Lower Upper
(Intercept) 0,00 *** 0,01 ***
Level 1 predictors
Fear scale 1,11 *** 1,06 1,16 1,02 0,97 1,08
Male 1,51 *** 1,28 1,78 1,78 *** 1,45 2,19
Age 0,98 *** 0,98 0,99 1,00 0,99 1,01
Education 0,93 ** 0,88 0,97 1,08 * 1,01 1,15
Income 1,00 0,96 1,05 1,06 1,00 1,13
Unemployed 1,00 0,69 1,45 1,01 0,65 1,55
Distrust in parliament 1,24 *** 1,09 1,45 0,87 0,73 1,02
Distrust in government 1,34 *** 1,17 1,52 0,97 0,82 1,15
Evaluation government 0,91 *** 0,86 0,95 0,96 0,90 1,02
Nationalism 1,13 1,00 1,27 1,45 *** 1,25 1,69
Left right scale 1,31 *** 1,26 1,37 1,39 *** 1,32 1,47
European unification 1,09 *** 1,05 1,12 1,04 1,00 1,06
Attendance religious services 1,09 *** 1,04 1,14 0,91 ** 0,86 0,97
Immigrants - Jobs 1,06 ** 1,04 1,14 1,01 0,96 1,06
Immigrants - Cultural life 1,07 *** 1,03 1,11 1,01 0,96 1,06
Immigrants - Crime problems 1,04 0,99 1,10 1,02 0,96 1,09
Immigrants - Welfare system 1,09 *** 1,05 1,15 1,06 1,00 1,12
Level 2 predictors
Unemployment 0,77 0,58 1,01 0,75 * 0,51 0,98
Unemployment change 0,98 0,94 1,03 1,02 0,97 1,07
Immigrants 1,01 0,92 1,11 0,97 0,86 1,07
Immigrants change 1,00 0,99 1,01 1,00 0,98 1,01
-
Random effects Std. Dev. Std. Dev.
Intercept 0,81 0,97
-
AIC 4548,4 2489,2
BIC 4716,1 2443,2
Deviance 4502,4 2443,2
-
N 10.817 2.698
Countries 18 18
The other predictors show a significant effect in the expected direction and thus confirm what
was mentioned in the literature review. The three other anti-immigrant attitudes (jobs, cultural life and welfare system) have a positive influence and are significant. Male, younger, less educated and less religious people are more likely to vote for radical right parties. Also people who have less confidence in parliament and government are more likely to vote for radical right parties. The odds ratio for the evaluation of government is below 1, but given the coding of this variable this means
that people who are less satisfied with the current government are more likely to vote for radical right parties. The effect of the left-right scale predictor is relatively high and shows that, not surprisingly, voters who tend to see themselves are more right are more likely to vote for radical right parties. The same applies for voters who think that European unification has gone too far. At
the second level the four predictors about unemployment and immigrants show that based on the odds ratio the effect of the current situation is stronger than the relative change compared to the past. However, the predictors at the second level are not significant.
Based on this model the effects of fear on the radical right vote is shown in more detail in
figure 1. This figure shows two Zelig simulations (see Kosuke et al., 2008 & Kosuke et al., 2009). The first simulation shows the effect fear has on an average voter. In this simulation all the predictors have mean or typical values. The chance a fearless person would vote for a radical right party is approximately 2 percent. This chance slightly increases to 4,5 percent for a fearful person. If we look at the second simulation, which shows the effect of fear for a potential radical right voter, the effect
is stronger. The predictors in this simulation have values which are typical or average for an radical right voter (e.g. male, younger, less educated, stronger anti-immigrant attitudes). For this simulation the chance of voting for a radical right party increases from 15 percent for a fearless to 35 percent for a fearful person.
Radical right voters versus citizens who abstain
The second model in table 5 show a contrast between radical right voters and respondents who said they would not vote in elections. When radical right voters are compared with citizens who abstain, the influence of fear is only slightly positive. But it has no significant influence anymore. Also most other predictors at the individual level are not significant anymore in this model. Only four predictors
stay significant and one predictor which wasn’t significant in the first model becomes significant in the second. This last predictor is nationalism which has a positive and relatively large odds ratio in this model. The predictors at the second level show a similar effect as in the first model, but again most of them are not significant. Unemployment levels in this model have a significant negative
effect.
In general, the results of the second model show that voters for radical right parties and citizens who would not vote in elections have more in common than voters for radical right parties have in common with voters for other parties. This is in contrast with findings from Zhirkov, who found that radical right voters are not only characterized by higher anti-immigrant attitudes
compared to voters of other political parties but also compared to abstainers (Zhirkov, 2014).
Fear levels for voters of different parties
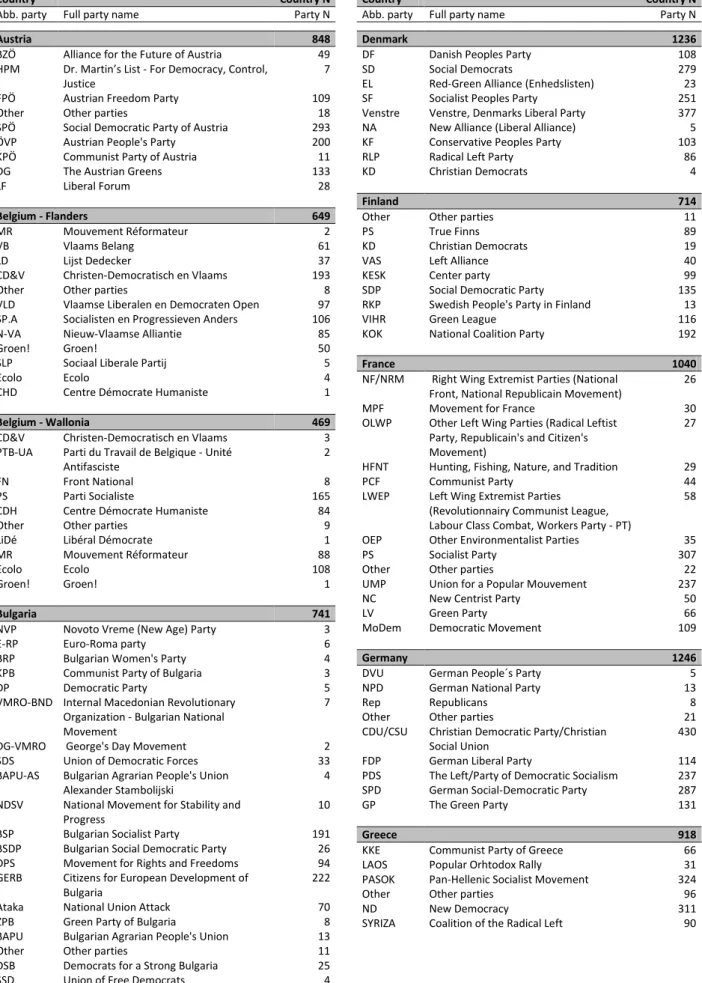
In figure 2 for each country the fear levels of voters for all national parties are shown8. This makes it possible to compare fear levels of voters of different parties within countries. The expectation would be that the voters of radical right parties have the highest average fear level. The parties are ordered
based on their position on a left-right scale (based on expert surveys used by the European Values Survey)9 (EVS, 2011). In Austria, Denmark, Finland10, Germany, France, the Netherlands, Slovenia and
8
In figure 2 abbreviations for the parties are used. In appendix C the full party names and the number of respondents who said they would vote for the party are given.
9
Switzerland the radical right parties indeed have the most fearful voters. Thus in two-thirds of the
countries it is not the radical right party that has the most fearful voters. However, in most of these countries the voters for radical right parties still have relative high fear levels. In three countries only one other party has voters with higher fear levels and in three countries two other parties have voters with higher fear levels. And in some of these cases the confidence intervals of the parties having voters with higher fear levels are extremely high, due to the fact that only few respondents
said they would vote for these parties. Thus, based on these countries one can also conclude that voters for radical right parties have relatively high fear levels compared to (most) other parties. Only in three countries the average fear level of voters for the radical right party are low compared with other parties. These countries are Bulgaria, Hungary and Slovakia. The question is whether there is
an explanation for these deviating cases.
In Bulgaria the radical right party is Ataka (Attack). Since 2007 public opinion research showed that support for Ataka declined (Smrčková, 2009: 61). On average respondents who said they would vote for Ataka had a fear level of 4.7. With an average score of 5.1 Bulgaria has the lowest average fear level of all countries included in the analysis (see appendix B). The expectation would still be that
voters for the radical right party have the highest fear level. But this could also be an indication that fear is less relevant in Bulgaria and therefore also a less important issue when it comes to party choice. Combined with a declining support for the party this could be a possible explanation of the unexpected findings in Bulgaria. However, based on the available data it is not possible to say if this
mechanism really exist. Furthermore, Ataka is described as a party with a complex identity by Kristen Ghodsee (2008). She argues that the party combines both radical right and radical left elements. Therefore it could be that the average fear level of voters for the is lower than expected, because the party does not only attract radical right (and based on the hypothesis fearful) voters.
The radical right party in Slovakia is Slovenská národná strana (Slovak National Party, SNS)
(average fear level of respondents: 5,4). Slovakia is also among the countries with on overall a relatively low fear level (5.5, see appendix B). When fieldwork for the EVS took place the Slovak National Party was part of the government coalition (Haughton & Rybář, 2008). This could be a possible explanation why the party did not attract fearful voters. If voters experience fear and hope for changes which would help take away their fear, it is less likely they would vote for a party which is
part of the government coalition. Therefore it could be that fearful voters went to other parties.
are ordered alphabetically. In countries were only for a few parties the left-right placement was missing, these parties are placed at the left. The radical right party in Romania (PRM) is placed more to the left. But in the documentation from the EVS it was mentioned that for this party it was difficult to place it on a left-right scale.
10
In Hungary there are two radical right parties. One is the Magyar Igazsag es Elet Partja
(Hungarian Justice and Life Party, Miép) with an average fear level of 7.1. The second one is a party which emerged after the decline of Miép (Halasz, 2009): Jobbik Magyarorszagért Mozgalom (Movement for a Better Hungary, Jobbik) with an average fear level of 6.7. Contrary to Bulgaria and Slovakia the average fear level in Hungary is relatively high (7.0, see appendix B). A possible explanation for the fact that in Hungary the most fearful voters say they would vote for other parties
than the radical right parties could be - somewhat contradicting - the success of Jobbik. Because of the success of the party other parties adopt policies which are in line with the believes of Jobbik (Stadelmann, 2013). As a result it is possible that fearful voters therefore feel not only the radical right party can solve their problems, but that other parties can do the same.
Despite these deviant cases, in general one could say the graphs in figure 2 support the main hypotheses that fearful voters are more likely to support radical right parties.
Conclusion
The main hypothesis which is tested in this paper is that voters who experience more fear are more likely to vote for radical right parties. The underlying idea for this hypothesis is that much of the
explanations mentioned in the literature about the radical right vote are based on the experience of some sort of economic or symbolic threat. Research has shown that fear can influence people's decision-making and electoral behavior. The effect of such psychological factors received much less attention in relation to voting for radical right parties. This paper is set up as a first exploration of the effect of a general experience of fear on the radical right vote.
To test the fear hypothesis data from the European Values Survey from 2008 was used. In this survey respondents were asked whether they were afraid of five different phenomena. At first sight these questions suggest two dimensions, a social and economic dimension. However, a principal component analysis and scale reliability showed high internal consistency between these five items.
Therefore, together these items show a single underlying fear trait. This fear scale is included in two multilevel logistic regression models in which also other predictors for the radical right vote were included. In the first model radical right voters were contrasted with voters for other parties and in the second model radical right voters were contrasted with citizens who said they would not vote if elections were held. In the first model the fear scale had a significant and positive effect on the
when they become more fearful and other explanatory variables were held constant. This effect was
even stronger for a typical radical right wing voter. Looking at the average fear levels of voters for different parties also showed that radical right parties often have support from one of the most fearful group of voters. These results show that a general feeling of fear indeed facilitates voting for radical right parties.
However, as argued in more detail before, the way fear is measured in this study is not optimal.
The questions which were used to create a fear scale may already have a right wing bias. Furthermore, the test which is used is not necessarily the best one to test whether fear as a personality characteristic facilitates voting for radical right parties. Next, this study uses self-reported vote intentions as a dependent variable. Another option would have been the use of evaluation
Literature
Betz, H.G. (1994) Radical Right-Wing Populism in Western Europe. Londen: MacMillan.
Bobo, L. (1988) Group conflict, prejudice, and the paradox of contemporary racial attitudes. In P. A. Katz & D. A. Taylor (Eds.), Eliminating racism: Profiles in controversy (pp. 85–114). New York: Plenum Press.
Brader, Ted, and George E. Marcus (2013) “Emotion and Political Psychology.” In Oxford Handbook of Political Psychology, ed. Leonie Huddy, David O. Sears, and Jack S. Levy. Oxford: Oxford University Press, 165-204.
Brader, Ted, Nicholas A. Valentino, and Elizabeth Suhay (2008) “What Triggers Public Opposition to Immigration? Anxiety, Group Cues, and Immigration Threat.” American Journal of Political Science 52 (4): 959–978.
Carter, Elisabeth (2005) The extreme right in Western Europe: Success or failure? Manchester University Press.
Coffé, Hilde, Bruno Heyndels, and Jan Vermeir (2007) "Fertile grounds for extreme right-wing parties: Explaining the Vlaams Blok's electoral success." Electoral Studies 26(1): 142-155.
Cutts, David, and Matthew J. Goodwin (2014) “Getting out the right-wing extremist vote: Extreme right party support and campaign effects at a recent British general election.” European Political Science Review 6(1): 93–114.
EVS (2011) European Values Study 2008: Integrated Dataset (EVS 2008). GESIS Data Archive, Cologne. ZA4800 Data file Version 3.0.0, doi:10.4232/1.11004.
Fennema, Meindert (1997) "Some conceptual issues and problems in the comparison of anti-immigrant parties in Western Europe." Party Politics 3(4): 473-492.
Ghodsee, Kristen (2008) "Left wing, right wing, everything: xenophobia, neo-totalitarianism, and populist politics in Bulgaria." Problems of Post-Communism 55 (3): 26-39.
Halasz, Katalin (2009) "The Rise of the Radical Right in Europe and the Case of Hungary: ‘Gypsy crime’ defines national identity" Development 52(4): 490-494.
Hatemi, Peter K., Rose McDermott, Lindon J. Eaves, Kenneth S. Kendler, and Michael C. Neale (2013) “Fear as a Disposition and an Emotional State: A Genetic and Environmental Approach to Out-Group Political Preferences.” American Journal of Political Science 57 (2): 279–293.
Haughton, Tim, and Marek Rybář (2008) "A change of direction: the 2006 parliamentary elections and party politics in Slovakia." Journal of Communist Studies and Transition Politics 24 (2): 232-255.
Ivarsflaten, Elisabeth (2008) "What unites right-wing populists in Western Europe? Re-examining grievance mobilization models in seven successful cases." Comparative Political Studies 41(1): 3-23.
Jost, John T., Jack Glaser, Arie W. Kruglanski, and Frank J. Sulloway (2003) “Political Conservatism as Motivated Social Cognition.” Psychological Bulletin 129 (3): 339–375.
Jost, John T., Jaime L. Napier, Hulda Thorisdottir, Samuel D. Gosling, Tibor P. Palfai, and Brian Ostafin (2007) “Are Needs to Manage Uncertainty and Threat Associated With Political Conservatism or Ideological Extremity?” Personality and Social Psychology Bulletin 33 (7): 989–1007.
Kosuke, Imai, Gary King, and Olivia Lau (2008) “Toward a Common Framework for Statistical Analysis and Development.” Journal of Computational and Graphical Statistics 17(4): 892-913.
Kosuke, Imai, Gary King, and Olivia Lau (2009) Zelig: Everyone’s Statistical Software, http://gking.hardvard.edu/zelig.
Lubbers, Marcel, Mérove Gijsberts, and Peer Scheepers (2002) “Extreme right-wing voting in Western Europe.” European Journal of Political Research 41(3): 345-378.
McLaren, L. M. (2003) Anti-immigrant prejudice in Europe: Contact, threat perception, and preferences for the expulsion of migrants. Social Forces, 81: 909–936.
Minkenberg, Michael (2003) "The West European radical right as a collective actor: modeling the impact of cultural and structural variables on party formation and movement mobilization." Comparative European Politics 1(2): 149-170.
Mudde, Cas (2007) Populist radical right parties in Europe. Cambridge: Cambridge University Press. Newman, Benjamin J. (2013) “Acculturating Contexts and Anglo Opposition to Immigration in the
United States.” American Journal of Political Science 57 (2): 374–390.
Norris, P. (2005) Radical Right: Parties and Electoral Competition. Cambridge, UK: Cambridge University Press.
Onraet, Emma, Alain van Hiel, and Ilse Cornelis (2013) “Threat and Right-Wing Attitudes: A Cross-National Approach.” Political Psychology 34 (5): 791–803.
Rydgren, Jens (2005) “Is Extreme Right-Wing Populism Contagious? Explaining the Emergence of a New Party Family.” European Journal of Political Research 44(3): 413–437.
Rydgren, Jens (2007) "The sociology of the radical right." Annual Review Sociology 33: 241-262. Rydgren, Jens (2008) “Immigration Sceptics, Xenophobes or Racists? Radical Right-Wing Voting in Six
West European Countries.” European Journal of Political Research 47(6): 737–765.
Riek, Blake M., Eric W. Mania, and Samuel L. Gaertner (2006) “Intergroup Threat and Outgroup Attitudes: A Meta-Analytic Review.” Personality and Social Psychology Review 10(4): 336–353. Rooduijn, Matthijs (2014) “Vox populismus: a populist radical right attitude among the public?”
Nations and Nationalism 20 (1): 80–92.
Stadelmann, Marcus (2013) "The Rise of the Extreme Right: The Movement for a Better Hungary (Jobbik)." National Social Science Journal 39: 97-103.
Sherif, M., & Sherif, C.W. (1969). Ingroup and intergroup relations: Experimental analysis. In M. Sherif & C. W. Sherif (Eds.), Social psychology (pp. 221–266). New York: Harper & Row.
Schumacher, Gijs, and Matthijs Rooduijn (2013) “Symphaty for the ‘devil’? Voting for populists in the 2006 and 2010 Dutch general elections.” Electoral Studies 32(1): 124-133.
Smrčková, Markéta (2009) "Comparison of Radical Right-Wing Parties in Bulgaria and Romania: The National Movement of Ataka and the Great Romania Party." Středoevropské politické studie (CEPSR) 1: 48-65.
Steininger, Martin, and Ralph Rotte (2009) “Crime, unemployment, and xenophobia?” Jahrbuch für Regionalwissenschaft 29(1): 29–63.
Van der Brug, Wouter, and Meindert Fennema (2007) "Causes of voting for the radical right." International Journal of Public Opinion Research 19(4): 474-87.
Van Gent, Wouter P. C., Elmar F. Jansen, and Joost H. F. Smits (2013) “Right-wing Radical Populism in City and Suburbs: An Electoral Geography of the Partij Voor de Vrijheid in the Netherlands.” Urban Studies, forthcoming. Doi: 10.1177/0042098013505889.
Vanhoutte, Bram and Marc Hooghe (2013) “The influence of social structure, networks and community on party choice in the Flemish region of Belgium: A multilevel analysis.” Acta Politica 48 (2): 209–236.
Wilson, T. (2001) Americans’views on immigration policy: Testing the role of threatened groups interests. Sociological Perspectives, 44: 485–501.
Appendix A) Principal component analysis and reliability scale per country
Country PCA Cronbach’s Alpha
Components with
eigenvalue above one Eigenvalue
Percent explained variance
Austria 1 3,334 66,7 ,875
Belgium 1 3,007 60,1 ,833
Bulgaria 1 3,218 64,4 ,860
Denmark 1 3,246 64,9 ,864
Finland 1 3,378 67,6 ,877
France 1 3,137 62,7 ,850
Germany 1 2,914 58,3 ,821
Greece 1 3,403 68,1 ,882
Hungary 1 3,002 60,0 ,831
Italy 1 3,123 62,5 ,849
Netherlands 1 3,056 61,1 ,841
Poland 1 3,574 71,5 ,899
Romania 1 3,378 67,6 ,880
Slovakia 1 3,279 65,6 ,869
Slovenia 1 2,871 57,4 ,813
Switzerland 1 3,371 67,4 ,879
Turkey * 1 3,258 81,4 ,924
Total 1 3,253 65,1 ,865
Appendix B) Descriptive statistics
Country N Valid N
(listwise) *
Would vote Vote RRP Abstain Fear scale Male Unemployed
Mean Std. Dev.
Austria 1510 593 / 195 85% 19% 43% 6,2 2,5 43% 2%
BE - Flanders 918 683 / 66 97% 8% 68% 5,9 2,1 49% 5%
BE - Wallonia 591 410 / 18 95% 2% 23% 6,5 2,1 47% 8%
Bulgaria 1500 372 / 171 69% 9% 14% 5,1 2,7 42% 9%
Denmark 1507 876 / 87 97% 9% 73% 5,4 2,4 50% 2%
Finland 1134 555 / 106 89% 12% 43% 7,1 2,2 49% 6%
France 1501 1028 / 134 89% 2% 15% 6,7 2,2 46% 5%
Germany 2075 932 / 218 79% 2% 6% 6,7 2,1 48% 11%
Greece 1500 621 / 95 89% 3% 16% 6,5 2,4 43% 4%
Hungary 1513 696 / 289 74% 3% 6% 7,0 2,3 48% 8%
Italy 1519 466 / 94 86% 10% 28% 5,6 2,5 48% 7%
Netherlands 1554 924 / 171 88% 11% 17% 5,6 2,0 45% 1%
Poland 1510 407 / 219 66% 4% 5% 5,2 2,3 44% 7%
Romania 1489 319 / 128 76% 6% 11% 5,3 2,6 44% 3%
Slovakia 1509 332 / 110 79% 9% 19% 5,5 2,3 40% 6%
Slovenia 1366 376 / 144 74% 11% 19% 7,1 2,1 46% 4%
Switzerland 1272 450 / 228 70% 23% 32% 5,5 2,3 46% 2%
Turkey 2384 695 / 185 89% 8% 26% 7,3 2,8 44% 14%
Total 26352 10735 /2658 83% 8% 21% 6,2 2,5 46% 6%
* Model 1 (Vote for radical right party vs. vote for other party) / Model 2 (Vote for radical right party vs. abstain).
Country Age Education Income Distrust parliament Distrust government
Mean Std. Dev. Mean Std. Dev. Mean Std. Dev. Mean Std. Dev. Mean Std. Dev.
Austria 46,3 17,7 5,1 1,4 6,4 1,9 2,9 0,8 3,1 0,7
BE - Flanders 49,0 17,6 4,9 2,0 7,2 1,9 2,7 0,7 2,9 0,7
BE - Wallonia 46,5 17,2 4,9 2,0 6,9 1,8 2,6 0,8 2,9 0,8
Bulgaria 50,2 17,7 5,3 1,8 2,3 1,2 3,4 0,7 3,3 0,8
Denmark 49,8 16,8 5,1 1,8 8,0 1,9 2,2 0,7 2,5 0,7
Finland 46,9 15,1 6,2 1,6 8,0 2,4 2,7 0,8 2,7 0,8
France 50,0 18,4 5,0 2,1 6,8 1,9 2,6 0,8 2,9 0,8
Germany 49,7 16,6 5,3 1,4 6,2 1,8 2,8 0,8 2,9 0,7
Greece 49,6 18,4 4,3 2,1 5,2 1,7 2,9 0,8 3,1 0,9
Hungary 44,6 17,6 4,8 1,6 3,6 1,0 3,1 0,8 3,2 0,8
Italy 47,9 18,2 4,7 1,9 6,3 2,1 2,8 0,8 3,0 0,8
Netherlands 54,8 17,3 4,8 2,0 7,3 2,1 2,6 0,7 2,6 0,7
Poland 44,6 17,2 5,0 1,8 4,1 1,8 3,1 0,8 3,1 0,8
Romania 48,1 17,3 4,7 1,8 3,0 1,8 3,0 0,9 3,0 0,9
Slovakia 53,6 16,6 4,8 1,6 3,6 1,1 2,6 0,8 2,6 0,8
Slovenia 48,5 18,1 4,7 2,2 5,7 1,9 2,6 0,7 2,7 0,7
Switzerland 49,8 17,8 5,2 1,7 8,4 2,0 2,3 0,7 2,4 0,7
Turkey 40,6 15,4 3,1 2,1 2,9 1,2 2,4 1,0 2,5 1,1
Country Evaluation
government Nationalism Left - right scale European unification
Attendance religious services
Mean Std. Dev. Mean Std. Dev. Mean Std. Dev. Mean Std. Dev. Mean Std. Dev.
Austria 4,6 2,2 3,3 0,8 5,2 2,0 6,9 3,0 4,8 1,9
BE - Flanders 4,7 1,8 3,1 0,7 5,3 1,8 6,1 2,5 5,3 1,9
BE - Wallonia 4,2 1,7 3,2 0,7 4,7 2,0 6,8 2,6 5,8 1,8
Bulgaria 3,2 1,8 3,1 0,8 5,3 2,5 4,1 3,0 4,7 1,6
Denmark 5,8 2,2 3,4 0,7 5,4 2,0 5,7 2,7 5,2 1,5
Finland 5,6 2,1 3,5 0,6 6,0 2,4 7,1 2,6 5,5 1,5
France 4,0 1,9 3,3 0,7 5,0 2,3 6,7 2,6 5,8 1,7
Germany 5,3 2,0 2,9 0,8 4,8 1,7 6,6 2,7 5,5 1,7
Greece 3,9 2,2 3,6 0,6 5,5 2,2 6,2 2,9 3,6 1,4
Hungary 3,2 1,9 3,2 0,7 5,5 2,1 5,8 2,7 5,4 1,7
Italy 3,9 2,1 3,3 0,8 5,3 2,4 6,0 2,8 3,7 1,8
Netherlands 5,6 1,6 3,1 0,7 5,4 1,8 6,1 2,4 5,1 2,1
Poland 4,4 2,0 3,5 0,6 6,0 2,0 4,8 2,6 2,9 1,5
Romania 4,6 2,3 3,2 0,7 5,8 2,2 4,2 3,0 3,4 1,4
Slovakia 5,5 1,9 3,3 0,7 4,9 2,0 5,1 2,6 3,9 2,2
Slovenia 4,7 2,0 3,6 0,6 5,0 2,0 5,4 2,8 4,8 1,9
Switzerland 6,4 1,9 3,3 0,7 5,2 1,8 5,9 2,7 5,3 1,8
Turkey 4,8 2,3 3,7 0,6 5,9 2,4 5,4 2,8 4,0 2,2
Total 4,7 2,2 3,3 0,7 5,3 2,1 5,8 2,9 4,6 2,0
Country Immigrants
Jobs
Immigrants Cultural life
Immigrants Crime problems
Immigrants Welfare system
Mean Std. Dev. Mean Std. Dev. Mean Std. Dev. Mean Std. Dev.
Austria 6,4 2,9 6,4 2,9 7,6 2,5 7,5 2,6
BE - Flanders 5,7 2,6 5,6 2,7 6,8 2,4 6,8 2,3
BE - Wallonia 5,9 2,8 5,9 2,8 6,4 2,5 7,1 2,4
Bulgaria 6,4 3,0 4,1 3,0 6,4 2,9 6,3 3,0
Denmark 3,1 2,3 4,5 2,7 7,2 2,4 6,6 2,5
Finland 4,9 2,8 4,0 2,7 6,9 2,4 6,5 2,4
France 4,7 2,8 5,0 2,9 5,2 2,7 6,1 2,7
Germany 6,4 2,6 6,0 2,6 7,5 2,3 7,6 2,4
Greece 6,7 2,8 5,5 3,0 7,3 2,6 6,7 2,8
Hungary 7,5 2,5 5,0 3,0 7,2 2,5 7,4 2,4
Italy 5,4 2,8 4,9 2,9 7,3 2,5 6,1 2,7
Netherlands 5,3 2,3 5,2 2,4 6,7 2,1 6,1 2,2
Poland 5,5 2,7 4,4 2,7 5,6 2,5 6,1 2,5
Romania 5,5 3,2 4,6 3,1 5,1 2,9 5,0 2,9
Slovakia 6,4 2,6 4,6 2,8 6,8 2,3 7,0 2,3
Slovenia 6,0 2,9 5,4 2,9 6,6 2,6 6,7 2,6
Switzerland 4,9 2,5 5,0 2,6 7,0 2,3 6,7 2,4
Turkey 6,9 2,7 6,6 2,7 6,6 2,7 6,7 2,6