Programs in the United States
Dylan Timmerman Spring 2019 Advisor: Dr. Todd BenDor
University of North Carolina at Chapel Hill Department of City and Regional Planning
Table of Contents
Abstract...3
Introduction...4
Background...5
Transfer of Development Rights...5
TDR Potential and Limitations...7
Methodology and Data...9
Data...9
Data Limitations...10
Database and Typology...11
Methodology...12
Results...14
TDR Program Inventory...14
Discussion...17
Conclusions...18
Further research...19
References...21
Abstract
Transfer of Development Rights (TDR) programs are a development management tool used in many jurisdictions around the country to shift development intensity between land parcels. The use of TDR programs is not universally adopted across the country, however, and the purposes of the programs varies. This project aims to compile a comprehensive listing of TDR programs and their primary attributes in order to categorize and map their implementation. This project also aims to examine a few socio-economic characteristics to determine their association with TDR program adoption through a logistic regression. The primary questions this project aims to address are; Are there spatial relationships between where TDR programs have been
implemented? Are there categories of TDR programs based on their function and who is implementing them that can be categorized? Are there socio-economic characteristics that are associated with an increase or decrease in the odds of a TDR program being present in an area? The inventory of TDR programs found 363 programs. The TDR programs identified are most commonly used to preserve important natural resources, promote development in particular areas through density incentivization, or a combination of these goals. Local government is the
Introduction
The use of market-based policy tools offers an alternative or enhancement to traditional
regulation-based instruments. Market-based trading programs can be used to guide development patterns and provide valuable ecosystem services, while mitigating or offsetting negative
externalities that come from the ongoing development and use of land and other natural resources (Nelson et. al., 2011; Hamstead and BenDor, 2010). As opposed to traditional
command and control policies such as zoning, development regulations, and permit limitations, market-based programs offer incentives for meeting these development goals and regulatory standards. This alternative approach offers the potential for achieving the goals of command and control policies in a compensatory manner (Hamstead and BenDor, 2010; Linkous and Chapin, 2014).
Transfer of Development Rights (TDR) programs are a prominent example of market-based policy instruments that utilize trading mechanisms to solve land use and environmental issues (Nelson et. al., 2011). TDR programs allow landowners to transfer development density from one area or land parcel to another in order to increase development opportunities while preserving land or other natural resources elsewhere. Although they are becoming more commonplace in policy and educational discourse, their implementation and success has been uneven. TDR programs are unevenly distributed geographically around the country, and number of trades and amount of land preserved under adopted programs varies (Nelson et. al., 2011; Linkous and Chapin, 2014). Some established programs have seen little to no trades occur, while others have been very successful in both preserving land and creating positive development patterns.
This project aims to understand what factors are associated with adoption of TDR programs. Why do programs exist where they do? For what purposes were they created?
data collected, including limitations to the data that was used. This paper closes with the results of the analysis, their implications for TDR programs, and areas of future research.
Background
Transfer of Development Rights
TDR programs are a growth management tool generally designed to allow the shift of
development between different areas (Nelson et. al., 2011). They are designed to offer land use flexibility to property holders and developers, while facilitating municipal development priorities through the creation of a market system. TDR programs are primarily administered at the local and county government level alongside other traditional zoning and development management practices.
TDR programs have taken a wide variety of forms meant to suit the development issues and land use patterns of the particular location in which the program is adopted. A program’s focus can be placed equally on preserving sending areas and developing receiving areas, or more emphasis can be placed upon one aspect (Linkous and Chapin, 2014). This flexibility allows TDR
programs to be designed to meet the needs of a local government, whether they are attempting to promote new growth, conserve resources, or offer greater flexibility to their zoning ordinances for property owners.
Entities with authority over land use practices can adopt an ordinance, plan, or legislative language that includes a mechanism for transferring development potential. A basic TDR
program establishes sending areas from which development density can be transferred, receiving areas where density can be transferred to, the type of development right that can transferred, and how this process is to take place. TDR sending areas are commonly designed to preserve rural land, land for agriculture, environmentally sensitive areas, open space, historic landmarks, or a combination of site types based on local priorities (Nelson et. al., 2011). Receiving areas are those that have been identified as suitable for additional development. These areas often include urban centers, areas targeted for future development, and areas of lower environmental or agricultural value (Nelson et. al., 2011). The amount of additional development that a receiving parcel can gain from a sending site is also established alongside the definitions of sending and receiving sites (Machemer and Kaplowitz, 2000).
The boundaries used to define what can be a classified as a sending or receiving area can differ from program to program based on the enabling legislation. A common method is to establish districts that can act as either a sending area, a receiving area, or both (Nelson et. al., 2011). These districts can be those already existing under a zoning ordinance, or entirely new districts created specifically for the TDR program. Transfers can then be allowed between certain districts or within a TDR designated district, depending on the program goals (Machemer and Kaplowitz, 2000). For example, a program aiming to preserve rural land may allow for the transfer of development from a rural district to a downtown district, while a program meant to promote high-density development in a certain area may only allow transfers between property in one district.
TDR Potential and Limitations
The literature on TDR programs is extensive and has grown considerably in the past few decades as they have seen increased adoption. These programs can provide an alternative to other
development regulations by allowing more flexibility within the local land use paradigm. Levinson (1997) found that when compared to uniform height zoning regulations, TDR
programs can achieve the same overall development in an area more cost-effectively. This is due to not all developments having the same height needs. Height regulations constrain some
developers while meaning little to those with no intentions on reaching the cap. Those who do not develop to the limit are also wasting their unused development potential. TDR programs allow for a more flexible approach that is more optimal for developers and avoids having unused development potential (Levinson, 1997).
The concept of TDR programs is firmly established as an option in designing a local growth management strategy in many regions across the country, though the way in which they have been utilized and their results have varied. Nelson et. al. (2011) created a comprehensive study on how TDR programs function and their relationship to planning practices by examining 239 programs across the country. They provide a look at how TDR programs can be created and implemented to meet different local growth management needs, including urban growth and conservation.
The effectiveness of TDR programs has also been shown to be impacted by local land markets. Linkous (2017) found that the function and effectiveness of a TDR market in Sarasota, Florida was tied to the unique characteristics of the area’s land market. Five characteristics were identified that influenced the program’s outcomes: the local real estate market, uncertainty and assumptions from landowners regarding potential outcomes of using the program, physical features of the sending and receiving zones, the number of potential buyers and sellers in the market, and the local political and planning landscape.
Previous research has utilized a case-study approach to examining common programmatic factors that can be used to measure TDR program success. Machemer and Kaplowitz (2002) found that although programs vary widely in their programmatic design structure and the context in which they function, they share similar characteristics that can be measured broadly across programs. Their research examined 14 TDR programs and their regulatory framework, program characteristics, and relationship to the community and environment in which they were
Methodology and Data
Data
To analyze TDR programs, I compiled a database of TDR programs around the country, both active and inactive. Programs were identified from four sources, which were selected based on their having already begun compiling TDR programs, their comprehensiveness, and relative recency.
The first source used was Arthur Nelson, Rick Pruetz, and Doug Woodruff’s (2014) text, The TDR Handbook: Designing and Implementing Transfer of Development Rights Programs (Nelson, et al., 2014). This comprehensive guide to TDR program development and application includes an extensive listing of 239 programs around the country, along with information on methods of implementation and program function. Second, I drew on work by Evangeline Linkous and Timothy Chapin (2014), who catalogued 31 county-level TDR programs in Florida and created a typology describing how programs evolved to meet different development goals. Third, I referenced Rick Pruetz’s (2019) Smart Preservation website, which contains an updated list of 257 TDR programs in the United States, as well as descriptions of each program based on data collected directly from TDR program documents and contact with program administrators. Finally, the fourth source consisted of primary data collection from Municode, a web hosting service for US municipal and county code and ordinance documents. Similar to methods employed by Linkous and Chapin (2014), I conducted a search of all listings in each state for TDR ordinances, where search terms included, “TDR”, “Transferable Development Rights”, Transfer of Development Rights”, “Density Transfer”, and “transfer”. I was able to locate an additional 69 programs from the Municode search. In total, I identified 363 current and former programs for use in this study.
Covariates data was also collected to be used for the analysis of TDR programs. Five covariates were used in this project. The first was the percentage of votes received by the GOP in the 2016 presidential election (Townhall, 2016). The second was the percentage of owner-occupied housing derived from the 2010 Census (Social Explorer, 2018). The third was the number of farms per square mile at a county level. This was derived from ESRI datasets that include 2012 Census of Agriculture statistics (ESRI Data and Maps, 2019). The fourth and fifth covariates were the population distribution between urban and rural, and the percentage of white residents. Both were derived from the 2010 Census (Social Explorer, 2018).
Data Limitations
There are several limitations in the data collection process for this study. Program information could not be collected directly from each jurisdiction due to time constraints and research capacity. The resources chosen to source data from were used in part to remedy this limitation. The Pruetz and Nelson sources utilized information collected directly from representatives from jurisdictions with TDR programs, and Municode provides ordinances and codes that are directly from jurisdictions. Municode was used to allow for a deeper search for TDR ordinances that were not previously identified by Pruetz, Nelson, and Linkous. This allowed for the
identification of more programs, but Municode is one of multiple ordinance hosting sites that exist. Additionally, many jurisdictions simply host their ordinances on their own websites or in physical form. Identifying every ordinance hosting site and jurisdictional website for the entire United States would require more time and resources than feasible within the scope of this project.
In cases where discrepancies were found between information from the secondary sources and the individual TDR ordinances, I chose to rely on the codified ordinance language.
Database and Typology
Jurisdictions with identified TDR ordinances were compiled into a spreadsheet and organized by state. Characteristics of ordinances were compiled, including the jurisdiction and state in which the program was created (including the type of jurisdiction and geographic identification for mapping purposes), the presence or absence of a state statute that enables or guides TDR ordinances, the program’s name, the ordinance or document section that codifies the program, the year of adoption and termination (if applicable), and the type of TDR program.
Typologies were created for jurisdictions and programs. I created a jurisdiction typology that broadly grouped the types of entities that were responsible for enacting and implementing the TDR programs. County represents county level governments [n=101]. Municipality represents a variety of incorporated units of governments as found in most states [n=166], Township [n=44] and Town [n=46] represent a form of county subdivision used in the northeast and portions of the Midwest. This method of county subdivision is used in Connecticut, Massachusetts, Maine, New Hampshire, New York, Rhode Island, Vermont, Wisconsin, Pennsylvania, Michigan, and New Jersey. District is a unique category used for Washington D.C., and Regional [n=5] represents programs that are based on a geography not tied to a specific political unit.
The program typology was derived from that of Linkous and Chapin (2014), who consider programs as they fit into three categories, which are based on the stated goals of the program and the types of sending and receiving areas set out in program enabling ordinances. The program typology for this project included a fourth category not used by Linkous and Chapin (2014)
developed or are being targeted for new development. Their focus is more on preserving sending areas than on developing the receiving areas.
Hybrid TDR programs place a stronger emphasis on the development of receiving areas, while also often including agricultural and environmental preservation as goals. These programs are intended to promote smart and compact growth patterns in communities. Hybrid TDR programs, as with Conventional programs, generally shift development potential from undeveloped areas to areas targeted for new development or
redevelopment at a higher density. This is used as a tool to spur new development by providing incentives for developers in the form of increased density allowances without increasing the overall density of a region.
Rural TDR programs are designed to shift development potential between a rural sending area and a rural receiving area to guide future development in desirable patterns. These programs seek to preserve undeveloped land while managing growth patterns, combining elements of Conventional and Hybrid TDRs. However, Rural TDRs tend to focus on shifting development potential entirely within rural landscapes. They generally hope that this will facilitate future expansion of proximate developed areas into rural areas in a more controlled manner.
Urban TDR programs focus on redeveloping urban landscapes, shifting unused
development potential entirely within an urban area. These programs are also typically designed to preserve historic landmarks and existing structures that do not make full use of their development intensity allowed under existing zoning ordinances, while allowing landowners elsewhere in the city to make use of that development potential. Urban TDRs often share the goal of Hybrid TDRs to spur higher density development without
increasing the overall density of a given area.
Methodology
Bureau. The programs were then mapped using ArcGIS software. The map builds upon the TDR database and provides a visual inventory of TDR programs across the country. The TDR
program map was then spatially joined with census tract spatial data to identify census tracts with and without TDR programs. The census tracts are used as the unit of analysis for this project.
The TDR program, census tract, and covariate data were then imported into Stata for analysis using logistic regression. The collected covariate data was merged with the TDR program and census tract data at the census tract level. A logistic regression allows for the testing of various independent variables to determine whether there is a significant predictive relationship between them and a binary dependent variable. The covariate data collected following the TDR inventory are the independent variables in this analysis. The dependent variable in this analysis is the presence of a TDR program in a given census tract. The logistic regression tests the seven covariates to determine if they impact the odds of a TDR being present in a tract.
Results
TDR Program Inventory
The inventory of TDR programs revealed 363 active and former programs. Conventional TDRs are the most prevalent type of program with 219 observations, making up over 60 percent of all identified programs. Hybrid TDRs are the second most frequent program type observed, with 69 identified. Urban TDRs account for 48 programs, and Rural TDRs account for 27 programs.
Table 1: TDR Program Type
Program Type Count Percent
Conventional 219 60.33
Hybrid 69 19.01
Rural 27 7.44
Urban 48 13.22
Total 363 100
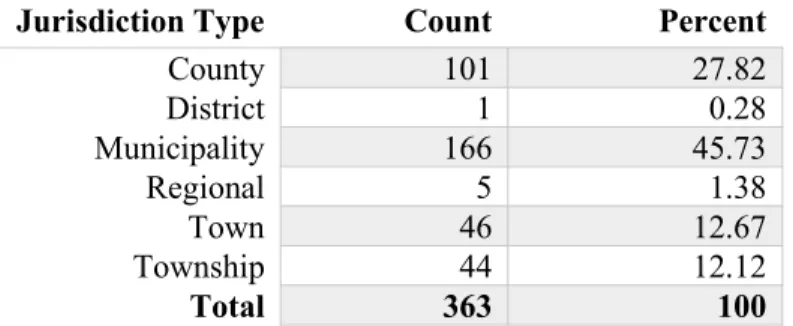
Municipality jurisdiction type was found to have the most TDR program observations. There are 166 Municipality level programs, accounting for almost 46 percent of all programs identified during this project. County level programs have 101 observations, accounting for the second most prevalent type. Town and Township displayed similar frequency, with 46 Town level programs and 44 Township level programs being identified. Washington D.C. is the only District jurisdiction type in this study and had 1 identified program, while 5 Regional programs were observed.
Table 2: Jurisdiction Type
Jurisdiction Type Count Percent
County 101 27.82 District 1 0.28 Municipality 166 45.73
Regional 5 1.38
Town 46 12.67
Township 44 12.12
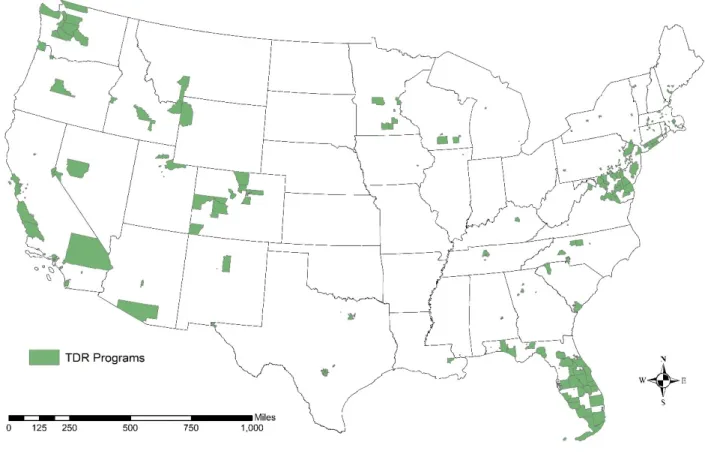
The distribution of programs across states is highly varied, with 38 states plus Washington D.C. having at least one TDR program. Florida was found to have the most programs, with 98
observations accounting for 27 percent of total programs identified. Conventional TDRs account for the majority of Florida programs with 56 observations. Hybrid TDRs account for 21
programs, Urban TDRs account for 14, and Rural TDRs account for 7. Pennsylvania has the second most TDR programs with 37, and California has the third most TDR programs with 34. Complete tables of programs and program types by state can be found in the Appendix.
Figure 1: Map of Transfer of Development Programs
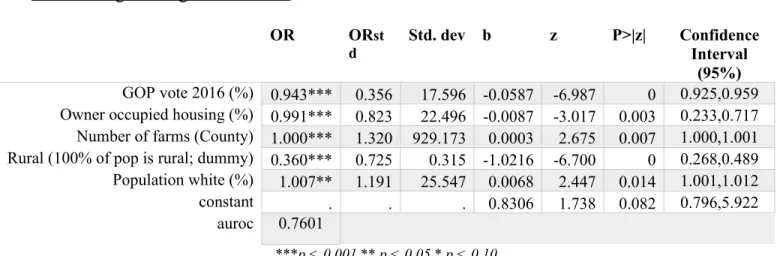
Logistic Regression
presence of a given variable. The odds ratios presented below measure how much a change in each variable impacts the likelihood of a TDR program’s presence. An odds ratio of 1 indicates that the variable does not impact the odds of a TDR program, while an odds ratio over 1
indicates the variable is associated with a higher likelihood of TDR presence, and an odds ratio under 1 indicates the variable is associated with a lower likelihood of TDR. Three levels of significance were used for this analysis: p < 0.001 (very significant), p < 0.05 (significant), and p < 0.10 (less significant). The statistically significant results are those with the smallest p values, indicated by asterisks.
Table 3: Logistic Regression Model
OR ORst d
Std. dev b z P>|z| Confidence Interval
(95%)
GOP vote 2016 (%) 0.943*** 0.356 17.596 -0.0587 -6.987 0 0.925,0.959 Owner occupied housing (%) 0.991*** 0.823 22.496 -0.0087 -3.017 0.003 0.233,0.717 Number of farms (County) 1.000*** 1.320 929.173 0.0003 2.675 0.007 1.000,1.001 Rural (100% of pop is rural; dummy) 0.360*** 0.725 0.315 -1.0216 -6.700 0 0.268,0.489 Population white (%) 1.007** 1.191 25.547 0.0068 2.447 0.014 1.001,1.012 constant . . . 0.8306 1.738 0.082 0.796,5.922
auroc 0.7601
***p < 0.001 ** p < 0.05 * p < 0.10
The AUROC for this analysis resulted in a value of 0.76, indicating that this model is only moderately useful for predicting the presence of a TDR program. The independent variables I used to predict have the following statistically significant impacts on the odds of TDR presence:
A higher GOP voting percentage is associated with a reduction in the odds of TDR presence.
A higher percentage of housing being owner-occupied is associated with a very slight reduction in the odds of TDR presence.
The number of farms is associated with an extremely small increase in the odds of a TDR program.
Having 100% of the population being rural is associated with a large reduction in the odds of TDR presence.
Discussion
This section includes a discussion of the results as they pertain to the purpose of the project. This project aimed to create an inventory of TDR programs in the United States and examine some socio-economic factors to determine their significance as predictors of program existence.
The results of cataloguing TDR programs have identified 363 programs implemented at both the county and local government level. The programs are divided into four types based on their primary goal. The majority of the programs have a natural resource conservation focus as a primary driver of implementation. Conventional TDRs designed to shift development in order to protect important natural resources account for 60.33 percent of programs. Development pattern guidance is also a prominent driver of TDR program adoption. Rural TDRs and Hybrid TDRs, which combine for 26.45 percent of programs, have both development and conservation goals as primary focuses. Urban TDRs are primarily driven by development pressures in built-up areas. These account for 13.22 percent of programs. This variation indicates that programs are not uniform in their purpose, though many have commonalities, and have only a few primary categories of drivers.
Implementation of TDR programs is mostly done at the local sub-county government level. Municipalities, Towns, and Townships together account for 70.52 percent of the jurisdiction types in which TDR programs are implemented. Despite this distribution, a study of program effectiveness will be needed to determine if local level programs are better. The distribution of programs by state is also varied. Florida has a much greater number of TDR programs than any other state, though Pennsylvania and California jurisdictions are also prominent users of TDR. As with jurisdiction type, causality will need to be expanded upon with further research.
GOP party platform and its view of TDR programs or similar market-based ecosystem service programs.
A higher percentage of housing being owner-occupied is associated with a reduction in odds of TDR presence. The odds ratio for owner-occupied housing was found to be 0.991. This indicates that a 1% increase in owner-occupied housing results in 0.9% decrease in the odds of a TDR program.
The number of farms is also associated with the odds of a TDR program. The odds ratio resulting from the model was 1.000, indicating a very small shift in the odds of TDR presence with a change in the number of farms. The standard deviation provides a better look at the effects of farm numbers. As TDR programs are often intended to conserve farmland and open space, an increase in the number of TDRs alongside farmland seems logical.
Having 100% of the population being rural is associated with a reduction in the odds of TDR presence. This analysis used a binary variable for rural and non-rural, with 1 indicating 100% rural and 0 being the base case of not 100% rural. A tract that was indicated as rural is 64% less likely to have a TDR program than a base case tract. Because this analysis considers rural to be 100% rural population distribution, a more nuanced approach in creating tiers of population distributions could lead to more interpretable results.
A higher percentage of the population being white is associated with an increase in the odds of a TDR program’s presence. An increase of 1% in a tract’s white population is associated with an increase of 0.68% in the odds of a TDR program.
Conclusions
jurisdiction. There is a wide disparity across the country between states that widely use TDR programs and those with only a few or none. The reasons for this can be investigated further
The analysis conducted in this project displayed points in the data that need to be further manipulated in order to provide more interpretable results. Political leanings and land use patterns are associated with changes in the odds of TDR programs being in a certain area. GOP voting, housing ownership trends, rural and farm characteristics of an area, and racial
demographics influence TDR adoption based on this model.
The logistic regression also exposed inconsistencies in the data used. The GOP voting
percentages and farm density data are county level datasets, while the analysis was done at the census tract level. A regression at a different analysis level, such as the county or municipality, may result in more interpretable data that can better compare different TDR programs and the variables within specific jurisdictions that result in changes in their odds of existence.
Further research
This project and the creation of a searchable database and map of TDR programs around the country is the first step in an ongoing process of better understanding what factors influence TDR adoption and rates of success. Multiple key questions were brought up but left unanswered during my research that could be the focus of future expansion of this project. The data I
collected focused primarily around program existence, location, and purpose. This allowed for a broad overview of TDR programs, but did not enable me to delve into the specifics of each program’s operations. Specifically, future research is needed to understand how the programs have played out once implemented. The following questions are examples of some avenues for future research that were identified during the course of this study
How many transfers has each program seen take place?
How many acres of land have been preserved under each program? What factors influenced program adoption and usage?
Another area of future study is looking at different types of market-based policy instruments Transfer of Development Rights (TDR) and Water Quality Trading (WQT) programs are both examples of market-based policy instruments that utilize trading mechanisms to solve land use and environmental issues. TDR programs allow landowners to transfer development potential from one site to another. WQT programs offer a similar incentive, allowing pollutant dischargers the opportunity to continue discharging into waterbodies in exchange for reductions in pollutant levels in other locations. This is in effect transferring pollutant potential as opposed to
development potential.
References
ESRI Data and Maps. 2019. “USA Counties.” ArcGIS Online.
https://www.arcgis.com/home/item.html?id=a00d6b6149b34ed3b833e10fb72ef47b.
Fawcett, Tom. 2006. “An Introduction to ROC Analysis.” Pattern Recognition Letters 27: 861– 74.
Hamstead, Zoe, and Todd BenDor. 2010. “Over-Compliance in Water Quality Trading
Programs: Findings from a Qualitative Case Study in North Carolina.” Environment and Planning C 28: 1–17.
Levinson, Arik. 1997. “Why oppose TDRs?: Transferable development rights can increase overall development.” Regional Science and Urban Economics 27: 283-296.
Linkous, Evangeline R. 2017. “Transfer of Development Rights and Urban Land Markets.” Environment and Planning A 49 (5): 1122–1145.
Linkous, Evangeline R. and Timothy S. Chapin. 2014. “TDR Program Performance in Florida.” Journal of the American Planning Association 80, no. 3 (Summer): 253-267. DOI: 10.1080/01944363.2014.985697
Machemer, Patricia, and Michael Kaplowitz. 2000. “Transferable Development Rights: A Market-Based Land Use Control.” In Property Rights, Economics, and the Environment, edited by Michael D. Kaplowitz, 143-174. Stamford: JAI Press.
Machemer, Patricia, and Michael Kaplowitz. 2002. “A Framework for Evaluating Transferable Development Rights Programmes.” Journal of Environmental Planning and Management 45, no. 6: 773-795.
Nelson, Arthur C., et. al. 2011. The TDR Handbook: Designing and Implementing Transfer of Development Rights Programs. Island Press. ProQuest Ebook Central,
http://ebookcentral.proquest.com/lib/unc/detail.action?docID=3317535.
Pruetz, Rick. 2019. “TDR Updates.” Smart Preservation. http://smartpreservation.net/tdr-updates/.
Social Explorer. 2018. “Census 2010.” Accessed March 3, 2019. https://www.socialexplorer.com/tables/C2010.
Townhall. 2017. “Election Results.” Accessed March 1, 2019. https://townhall.com/election/2016/president/.
Appendix
Total 363 100.00
Total 219 69 27 48 363
WY 1 0 0 0 1
WI 4 0 3 0 7
WA 20 2 2 3 27
VT 1 2 0 0 3
VA 3 1 0 0 4
UT 4 1 1 0 6
TX 2 2 0 1 5
TN 1 0 0 1 2
SC 1 2 1 0 4
RI 0 2 0 1 3
PA 33 0 3 1 37
OR 2 1 0 0 3
NY 10 4 0 4 18
NV 2 0 0 0 2
NM 1 1 0 0 2
NJ 4 5 0 0 9
NH 2 0 0 0 2
NC 1 8 0 1 10
MT 1 0 0 0 1
MS 0 1 0 0 1
MN 4 0 1 1 6
MI 0 2 0 1 3
ME 4 1 0 0 5
MD 10 1 2 0 13
MA 12 5 1 0 18
LA 0 0 0 1 1
KY 1 0 0 0 1
IL 1 0 0 0 1
ID 2 0 1 1 4
IA 0 0 0 1 1
GA 0 3 0 1 4
FL 56 21 7 14 98
DE 3 0 0 0 3
DC 0 0 0 1 1
CT 4 0 0 0 4
CO 7 2 4 2 15
CA 20 0 1 13 34
AZ 2 1 0 0 3