The Impact of Physician Assisted Suicide on Suicide Rates and Individual Propensities for Suicidal Action
By Kaitlyn Mallie
Senior Honors Thesis Political Science
The University of North Carolina at Chapel Hill
03 April, 2018
Abstract
In the past decade, Physician Assisted Suicide (PAS)1 has emerged as a heavily contested policy issue for state governments. A central political argument against PAS claims that access to PAS practices enables terminally ill individuals—who were once statistically unlikely to commit suicide—to develop an increased risk for suicidal action. This study analyzes this claim by examining the relationship between policy and behavior, and assessing whether PAS
legislation influences suicide risk. By analyzing annual suicide rates released by state health departments, I find that PAS legislation causes suicide rates to increase. Furthermore, I additionally measured individuals’ propensities for suicidal action by assessing which
demographic traits enable an individual to be most at risk of committing suicide, and comparing these traits with traits that increase an individual’s risk of pursuing PAS. I find that some of the risk factors for suicide do not align with the risk factors for PAS, implying that PAS enables certain individuals to develop an increased risk of suicide. Therefore, this study provides two pieces of evidence that PAS ultimately affects suicidal behavior.
Contents
I. Introduction ………. 5 II. Literature Review………....7 III. Theoretical Framework………..13
Brief Discussion on the Effects of Legislation on Human Behavior Definitions
Theoretical Analysis
IV. Hypotheses………...30 V. Research Design………...32
Rate of Suicide
Individual Propensities for Suicide
VI. Defining the Independent and Dependent Variables……….37 VII. Operationalization of Variables………....38 VIII. Results………..43
Rate of Suicide
Individual Propensities for Suicide
Figures and Tables List of Figures
Table 1: Oregon Annual Suicide Rate per 100,000 Population………...43
Table 2: Washington Annual Suicide Rate per 100,000 Population ……….…..43
Figure 1: Oregon PAS as a Percentage of all Suicides………44
Figure 2: Washington PAS as a Percentage of all Suicides…….………44
Figure 3: A Comparison of Washington and Oregon PAS as a Percentage of All Suicides...45
Figure 4: Demographic Characteristics Rate Ratios………50
Table 3: US Education Level Demographics………...51
Table 4: Oregon Education Level Demographics……….………...51
Table 5: Washington Education Level Demographics………..………...51
Table 6: California Education Level Demographics……….………...51
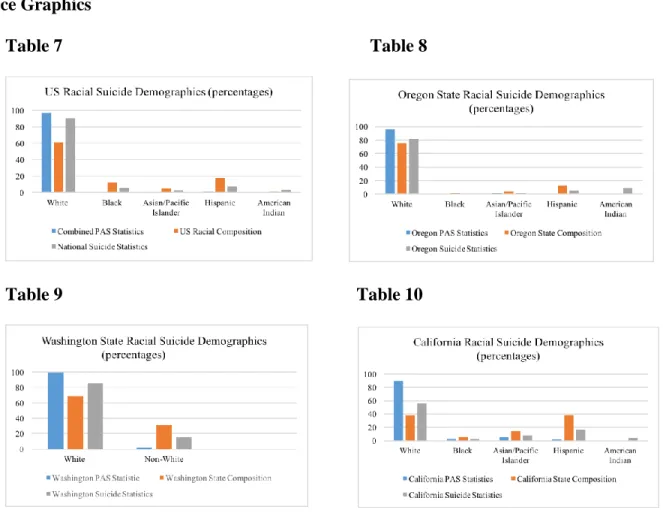
Table 7: US Racial Suicide Demographics……….……….53
Table 8: Oregon Racial Suicide Demographics……….……….….53
Table 9: Washington Racial Suicide Demographics……….………...53
Table 10: California Racial Suicide Demographics……….………53
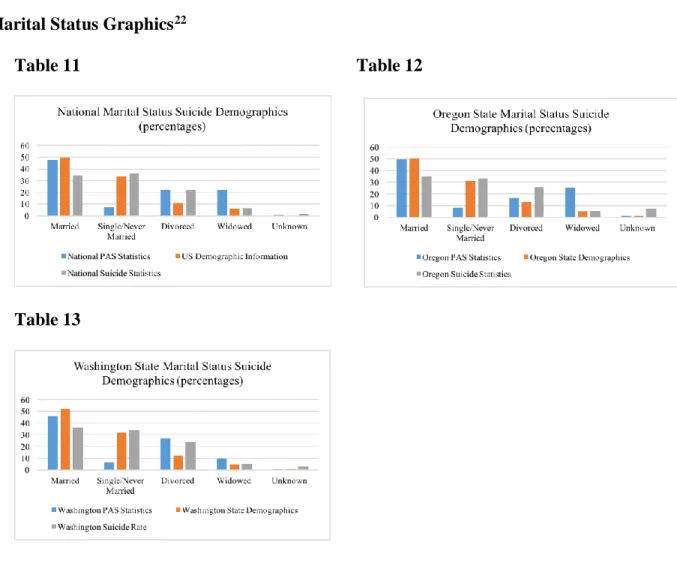
Table 11: National Marital Status Suicide Demographics……….……….….54
Table 12: Oregon State Marital Status Suicide Demographics……….…………..….54
I. Introduction
In 2017, the Washington DC council passed a Physician Assisted Suicide law with resounding support from council members, and an 11-2 vote (Nirappil, 2017). Despite this success, the law quickly received significant backlash from the public and opposing members of Congress who immediately began developing strategies to nullify the law (Nirappil, 2017). This recent enactment of PAS legislation has culminated into a divisive debate on the morality and usage of Physician Assisted Suicide. Conservative opponents fear that the introduction of assisted-death legislation is likely to encourage premature death and suicidal behavior. This claim is heavily contested by supporters of PAS legislation, who claim that Physician Assisted Suicide gives more agency to terminally-ill individuals and provides an alternative to long-term suffering (Nirappil, 2017). At the core of this debate lies a moral divide as to whether assisted death is an appropriate policy action to aid the terminally ill.
Furthermore, the Washington DC law is only the most recent legislation passed on the matter. In the past two years, both California and Colorado have enacted similar legislation in their respective regions. Prior to 2016, Vermont, Washington, and Oregon had additionally authorized assisted-death laws (Death with Dignity, 2017). As Physician Assisted Suicide legislation continues to be enacted, state legislatures are forced to address the possibility of PAS legislation within their own states. For instance, in 2017, over a dozen states considered new PAS legislation and/or have considered removing laws specifically restricting PAS (Death with Dignity, 2017). This trend indicates that more states are likely to pass assisted death laws in the near future, and it is important to measure the effects of existing PAS laws prior to this
As formerly mentioned, conservative opponents to the law claim that PAS encourages suicidal behavior and increases an individual’s suicide risk. However, with such limited research on the effects of PAS on suicidal behavior, it is unclear if these claims deserve credence. My research will attempt to either validate or disprove these assertions by evaluating the realized effects of PAS on suicide risk and behavior. In order to accomplish this, my project will analyze the rate of suicide before and after the enactment of PAS legislation to observe whether PAS increases overall suicide rates in the US. I believe that assessing the impact of PAS on suicide rate is one attempt to measure whether PAS influences normal suicide behavior by measuring PAS’s impact on the overall number of suicides in a given year
Furthermore, I will additionally analyze the demographic of people who commit suicide in the US, and compare that information with the demographic of people who exercise their right to Physician Assisted Suicide. From my research, I will determine to what degree these
demographic factors are similar, and discover whether the introduction of PAS legislation affects the demographic of people who are statically likely to commit suicide. If my data indicates that the demographic traits of suicide victims in the US are vastly different than those of PAS pursuers, it is likely PAS is affecting the typical demographic features of suicide victims. My data analysis can serve as a quantifiable description of the effects of PAS, which may be critical information in the future of this policy debate. The culmination of research on these two factors serves to effectively assess PAS’s impact on suicide behavior.
overall suicide rate in the US, and if PAS enables certain demographics of individuals—who were once statistically unlikely to commit suicide—to exercise their right to PAS. This evidence will indicate whether or not normal suicide behavior is affected after the enactment of PAS in participating states.
II. Literature Review
Literature examining suicide trends and determinants generally agrees that demographic factors play an important role as determinants for suicide risk; however, the role of said
demographic factors is often contested within contemporary research. This literature review will focus specifically on prior research that examines the effects of certain demographic factors on suicide risk.
i. Education
Therefore, international cultural and social factors regarding national education programs and/or suicide may have influenced the results.
Conversely, related studies have contradicted these findings and found both positive and negative correlations between suicide and education level. A vast majority of studies discovered a negative relationship between education and suicide rates, implying that a higher education level decreases one’s risk of suicide (Lewinsohn, 1993; Stack, 1998; Fernquis, 2011; Li, 2011; Li, 2016). Consequently, this research found that individuals with low education levels were most likely to commit suicide. These studies employed a variety of methods, analyzed a wide array of geographic regions, and similar results were found across racial groups and age demographics. Thus, the theory that low-educated individuals are at a higher risk of suicide appears to be most widely-applicable and comprehensive.
Nevertheless, a small pocket of literature produced conflicting results, and instead found a positive correlation between median years of school completed and increased suicide rate (Barnes, 1975). These studies found that individuals with low levels of education were at a lower risk of committing suicide than individuals with higher levels of educational attainment.
However, these studies were scant, and often outdated and internationally-based. Thus, I do not believe that the findings from these studies are entirely applicable or universal.
ii. Race
Literature relating to the relationship between race and suicide has produced largely varying results. Many contemporary studies have found that white individuals are more likely to commit suicide than minorities (Manton, 1987, Kenneth, 1987, Kubrin, 2009). Most of these studies are nation-wide, comprehensive research studies that analyze individual suicide data to measure race. These research studies are constructed very similarly to my own, and produced relatively consistent results. Therefore, I anticipate that these results will be similar to mine.
Conversely, there is a notable amount of literature claiming that minorities are at a higher risk of suicide (Manton, 1987; Garlow, 2005). However, most of these studies found that the correlation between race and suicide is only realized when looking at specific age groups. For instance, one study found that in older populations, non-whites tend to commit suicide at higher rates. However, this study was directly contradicted by other research, which claimed that non-whites commit suicide at higher rates when they are younger, but not when they are older (Manton, 1987; Garlow, 2005). Thus, there is conflicting evidence concerning the relationship between age, race, and propensity for suicide. In addition, the research structures of the studies that claim minorities are at the highest risk of suicide tend to be smaller case studies, and focus on specific geographic regions. Therefore, these results may not be applicable for the general US population.
Overall, the research relating to race is generally similar to my own project, as I restricted my secondary research to strictly US studies to avoid varying international definitions of race. Despite this control, I still found notable discrepancies in results and consequently will be completing my own analysis on race and suicide. I will be assessing whether my data presents a disproportionate representation of one racial group within suicide statistics, or if suicide remains racially neutral. I will then compare my findings to the racial breakdown of individuals who have exercised their right to PAS, and check for any discrepancies among the two groups.
iii. Marital Status
Previous analysis of the relationship between marriage and suicide is relatively limited. The foundation of this line of study is a report by Emile Durkheim in 1897, who proposed that married men without children are less likely to commit suicide then single men. Conversely, Durkheim found that married men with children are the most at-risk of committing suicide. A majority of contemporary studies are engineered to either validate or disprove Durkheim’s theory (Pickering, 2014).
Related studies tend to test the Durkheim theory using a cross-cultural perspective. I have chosen to focus primarily on US studies to control for the varied cultural inferences of marriage that may affect suicide risk. Moreover, most contemporary literature disproves the Durkheim theory and finds that there is an inverse relationship between marriage and suicide. Therefore, both married men and women are less likely to commit suicide, or have suicidal thoughts. Furthermore, marriage is often viewed as a protective factor against the risk of suicide (Leenaars et al, 2006; Pickering, 2014).
gender-specified studies have found that this theory holds true for men, but not always women. This discovery indicates that men who divorce are at a higher risk of suicide than women who divorce (Smith, 1988). However, this claim is not universal, and one study found that women are at the same risk of suicide whether they are divorced or married, implying that marital status is
ineffective in predicting suicidal behavior in women (Kposowa, 2010). Additional research also found gender discrepancies in reference to the relationship between widowhood and suicide. These studies found that widowhood remains a huge risk factor for men, but does not increase a woman’s likelihood to commit suicide (Leenaars et al, 2006; Pickering, 2014). Therefore, it is possible that the aforementioned relationships between marital status and suicide cannot be equally applied across genders.
In addition, most studies testing the relationship between marital status and suicide are relatively outdated, and often use data from the mid to late 20th century. Thus, results from this literature could potentially be moot as a result of the evolving cultural implications of marriage, divorce, etc. For instance, one study found that the gap was shrinking between the risk of suicide among married individuals and divorced individuals as a result of increased acceptability and prevalence of divorce in the US (Leenaars et al, 2006). Therefore, I am relatively limited in my ability to predict how marriage will affect suicide rate. Despite this, literature does seem to indicate that marriage serves as a strong protective factor against suicide. Thus, I can predict that married individuals may be less likely to commit suicide.
iv. Physician Assisted Suicide
There are two studies that are relatively similar to my own— Legal physician-assisted dying in Oregon and the Netherlands: evidence concerning the impact on patients in
Oregon's data (Finlay, 2007). These studies looked at data in Oregon and the Netherlands that provided demographic information about those who exercised their right to assisted death. Each study assessed whether there was disproportionate representation of “vulnerable individuals” among PAS pursuers, which included analyzing the prevalence of minority groups and low-educated individuals within these statistics. This research is similar to my study, as I am also analyzing demographic statistics for assisted death participants. My research, however, compares individual data of suicide victims to the individual data of physician assisted suicide pursuers, and then measures for any demographic discrepancies. Within the Vulnerable Groups studies, the researchers neglect to observe populations outside of assisted death participants. Therefore, they cannot accurately assume that their findings are significant, because they do not analyze the typical demographic variables of suicide victims at large or Oregon state’s population for
comparison. Thus, their conclusions are drawn based off of blanket observations as they neglect to account for typical suicide behavior.
Furthermore, there is one study, Predictors of Pursuit of Physician-Assisted Death (Smith, 2015), that measures the relationship between marital status and Physician Assisted Suicide users. This is the only study that analyzes this relationship, and in doing so discovered that PAS users tended to be unmarried. Therefore, this study found similar results as the suicide studies that I previously analyzed, and also determined that marriage served as a protective factor against PAS.
In sum, there is a fairly significant amount of literature examining the variables I have chosen, but it is important to create a study that clarifies the relationship between these
Once I establish these relationships, I will be able to assess whether or not the enactment of PAS influences the normal demographic variables of suicide victims.
III. Theoretical Framework
i. A Brief Discussion of the Effects of Legislation on Human Behavior
In developing the premise of this project, it is important to first analyze whether legislation affects human behavior at all before making assumptions about how legislation affects behavior. Therefore, before I can assess whether Physician Assisted Suicide influences both the suicide rate and typical demographic factors of suicide victims, it is important that I analyze the general relationship between legislation and people’s behavior. Therefore, I have dedicated the first portion of my research to answering the following question: does legislation affect human behavior? I have chosen three cases: abortion, motor voter laws, and marijuana legislation in order to evaluate this relationship. I analyzed research studies in order to measure the impact of the legislation for each of these policy areas. I am specifically looking for a change in rate of participation relating to the given legislation, or a shift in the normal demographic factors of participants.
There has been considerable research concerning how various public policies can affect individual choices. Prohibitions can often deter individuals from some behaviors, and
legalization is sometimes the impetus for engaging in others. In order to evaluate these trends, I choose to review research from three prominent policy domains. These areas are especially useful because many of the findings relate directly to my own research and utilize research designs that are largely similar to my own.
The first case that I selected to evaluate the impact of policy on human behavior is abortion. I chose abortion because it is a similar policy to Physician Assisted suicide in that the legislation is not enacted with the intention of influencing behavior, but rather to decriminalize an existing phenomenon. In other words, abortion legislation is not explicitly intended to increase the number of abortions or incentivize abortions, just as Physician Assisted Suicide is not designed to increase or incentivize suicides. Furthermore, there is both national and state-level abortion legislation, which allows me to analyze the effects of abortion laws on a multidimensional level.
Brief History
Abortion has remained a relevant policy issue since the development of common law in the United States. Despite some medical restrictions, abortion was widely used by early
Despite the criminalization, women continued to seek the operation. This was particularly true during times of national economic strife. By the 1960s, it is estimated that illegal abortions ranged from 200,000 to 1.2 million per year (Gold, 2017). Many of these abortions were
completed in non-medical, dangerous fashions, which resulted in a significant safety risk for women. The deaths and trauma that resulted from these abortions eventually led to a push for a reform in abortion legislation. The correlation between abortion-related deaths and increased approval ratings for pro-abortion legislation was validated by researchers who successfully evaluated this phenomenon by analyzing death rates among women who had died as a result of fatal abortions and correlated spikes in abortion’s favorability (Gold, 2017). Furthermore, poor women were disproportionately affected by the criminalization of abortion, and had the highest risk of having a fatal abortion (Gold, 2017). As a result, several states passed state-level abortion laws decriminalizing abortion. Many women were in support of these laws, and traveled great lengths to attain legal abortions. Furthermore, state-level abortion laws inspired women to become involved in advocating for a federal decriminalization of abortion (Gold, 2017). This advocacy for the legalization of abortion persisted until the Roe v. Wade (1973) decision, which re-legalized abortion in the US.
Analysis
travelled to New York City alone in order to have a legal abortion (Gold, 2017). New York was critically important, as it was the only state in which non-resident women could legally obtain an abortion. Research indicates that this legalization was very significant, and that abortion rates increased by 12% for every 100 miles a woman lived closer New York in the years prior to Roe (Joyce, 2012). For those who were able to travel to New York due to geographic convenience or plausibility, this abortion legalization incentivized women to obtain abortions, increasing the overall abortion rate (legal and illegal) in the US (Joyce, 2012). These findings suggests that women who were geographically capable of attaining an abortion were opting to do so, and thus legalization was a significant factor in deciding if a women chose to have an abortion.
women who were seeking abortions. This evidence supports the claim that state-level legislation affects citizens’ behavior.
Secondly, I analyzed the impact of the national legalization of abortion following the Roe v. Wade ruling in 1973. There are two ways to assess whether the national legalization of
abortion affected individuals’ behavior. Firstly, I analyzed research studies that focused solely on the difference between the rate of abortion prior to federal legalization and after legalization. These studies unanimously found that there was an increase in the amount of abortions directly following decriminalization (Weinstock, 1975; Cates, 1978; Hansen, 1980). Although the rate has varied throughout the last forty years (Henshaw, 1998), the direct effect of legalization presented a significantly higher overall abortion rate. Furthermore, studies found that the demographic of people having abortions also changed, and that there has been an increase in middle class and minority women seeking abortions (Weinstock, 1975; Cates, 1978; Hansen, 1980). This research implies that legislation and decriminalization did influence the behavior of American women.
women’s behavior in two distinct fashions. If these results were applied to Physician Assisted
Suicide laws, we may predict to see an increase in the overall suicide rate and a shift in normal suicide victim demographic factors.
Motor Voter Laws
The second case chosen for this assessment differs slightly from the other two. While abortion legislation was not designed to increase overall abortions, motor voter laws are intended to incentivize people to vote. Therefore, this legislation is specifically designed to affect human behavior. This makes motor voter laws unique, and important to examine within this study because the aftereffects of these laws measure to what degree the government can consciously and effectively influence citizen’s behavior, and how susceptible the public is to be motivated by legislation.
Brief History
In 1993, Congress enacted the National Voter Registration Act of 1993 under the leadership authority of President Bill Clinton (MOTOR, 2005). The NVRA is commonly referred to as a “motor voter law,” and was drafted in order to increase voter turnout. This bill
aimed to do so by simplifying the processes for registering to vote and maintaining one’s registration (MOTOR, 2005). Prior to the enactment of this bill, the US was experiencing a consistent trend of low voter turnout (Lawler, 2009). This is characterized by the preceding presidential elections in 1988 and 1992, which produced voter turnout rates of 50% and 55%, respectively (Lawler, 2009). These low turnouts resulted in the drafting of motor voter laws.
Analysis
evaluating existing research studies that measured the state voting rates before and after the enactment of motor voter laws at the state level. Because these states passed motor voter laws prior to the enactment of the NVRA, the state legislation’s impact is measured without the influence of a potentially confounding national motor voter law. Moreover, research studies found that these states had significantly higher voter turnout than states without motor voter laws (Knack, 1995; Franklin, 1997). This increase in state voter turnout was evident in each state that passed state-level motor voter laws. Furthermore, studies conclude that this upsurge in voting was the result of an increase in minority voter participation (Knack, 1995; Franklin, 1997). Thus, the state motor voter laws were effective in mobilizing minority voter, who were once
statistically unlikely to vote in state elections. Therefore, participating states crafted highly successful motor voter laws, and were capable of increasing overall voter participation, and more specifically, minority voter participation.
In addition, I analyzed the impact of the national motor voter law, the NVRA. In order to properly assess whether the NVRA effectively increased voter turnout, I analyze the voting rates before and after the enactment of the motor voter law. Although research indicates that state-level motor voter laws were successful, it is beneficial to additionally measure the effect of the enactment of the NVRA in order to assess whether this federal law affected voting behavior nationwide and in states that did not previously enact motor voter laws. Several studies have measured the impact of this bill in order to assess its efficacy in affecting voting behavior. In reference to voter turnout, there is some inconsistency in contemporary research, as some studies have found that the NVRA increased voter turnout while others found little to no impact
assessing overall voter turnout, the NVRA was ineffectual at mobilizing voters (Martinez, 1999; Hill, 2003; Lawler, 2009). However, these measurements include analyzing voter turnout during midterm and presidential elections. Conversely, when researchers focused exclusively on
presidential elections, they found an increase in voter turnout following the enactment of the NVRA (Lawler, 2009). Therefore, there is some evidence that the NVRA may have positively influenced voter behavior. However, the amount of conflicting evidence makes it challenging to declare causality and definitively conclude that the NVRA increased voter turnout. Furthermore, it is difficult for researchers to determine whether the NVRA was the definitive or sole cause for the increased voting rates found in some studies, as research indicates that midterm elections actually saw a drop in turnout post-NVRA (Hill, 2003). This drop in voter turnout is likely to be the result of confounding factors unrelated to the NVRA that affect overall voter turnout.
Consequently, it is difficult to measure the true impact of the NVRA. Therefore, the overall impact of this national motor voter law remains unclear.
Despite this ambiguity, most of the studies measuring the aftereffects of the NVRA’s found a common trend in reference to the legislation's impact on certain demographic groups. In states that were compliant with the NVRA’s guidelines, there was a deviation in typical
demographic voting patterns. This slight shift in the normal voting demographic included an increase in minority and low-income voter participation. This shift was small, but nonetheless noted in several studies (Knack, 1995; Lawler, 2009). Hence, the NVRA did have an effect on voting behavior, although the predicted impact differed from the actualized effects.
197). Nonetheless, the aforementioned state-level motor voter laws saw considerable increases in voter participation and demographic voting changes, indicating that the state laws were
successful in affecting behavior prior to the enactment of the NVRA (Knack, 1995; Franklin, 1997).
In sum, state-level motor voter laws saw far more success and drastically different results than the NVRA. Similar to abortion, the resulting effects of motor voter laws indicate that state-level legislation has the power to make a considerable impact on human behavior.
Marijuana Laws
The final case selection chosen to determine the relationship between legislation and human behavior is that of medical and/or recreational marijuana. This case differs from the previous two, in that there is currently no federal legislation legalizing the use of marijuana. Therefore, the impact of marijuana laws analyzed within this study will be entirely at the state level. This analysis parallels that of Physician Assisted Suicide legislation, which is likewise only legal in certain states and at the state-level. Furthermore, marijuana laws are intrinsically similar to both abortion and PAS legislation, as they are not passed with the intention of
increasing marijuana use but rather to decriminalize existing usage. This differs from motor voter laws, which aim to incentivize voter turnout.
Brief History
mandatory sentencing for some marijuana offenses (Matin, 2016). However, the most restrictive measure regarding marijuana was the 1970 Controlled Substances Act, which was enacted a few months prior to President Nixon's declaration of the “war on drugs” (War on Drugs, 2017). Marijuana was categorized as a Schedule 1 drug, which is defined as a drug that is considered the most dangerous, due to its addictive tendencies and lack of proven health or medical benefits (War on Drugs, 2017). The war on drugs was expanded under Reagan in the 1980s, reinforcing the dangers of marijuana drug use (War on Drugs, 2017).
Despite this, in 1996, the state of California voted to legalize marijuana for medical purposes with Preposition 215 (Garcia, 2018). Since 1996, twenty-nine states and the District of Columbia have subsequently developed similar legislation, allowing for comprehensive medical marijuana services in over 50% of US states (Garcia, 2018). In nine of these states and the District of Columbia, marijuana has been completely legalized, including both medical and recreational use (Vox, 2014). This legislation represented a shift in the public’s opinion
concerning marijuana, and an increased acceptance for utilizing marijuana for medical purposes (Khatapoush, 2004). Despite the state-level legislation, marijuana remains a Schedule I substance
under the federal Controlled Substances Act (Garcia, 2018). Thus, marijuana is presently criminalized at the federal level. Consequently, I am limited to analyzing the impact of state-level marijuana legislation, as there is not currently a federal law that decriminalizes marijuana.
Analysis
found a positive correlation between marijuana legislation and increased marijuana consumption in individual states (Cerda, 2011; Pacula, 2013; Wen, 2014). Therefore, a majority of studies agree that there was an increase in marijuana usage after the passage of marijuana legislation. Nevertheless, research additionally indicates that despite a correlation, it is difficult to pinpoint causality, as shifting social norms have also been estimated to affect marijuana use (Cerda, 2011; Kerr, 2017). Therefore, research could not definitively determine that marijuana legislation alone caused an increase in marijuana usage. Furthermore, some researchers found that marijuana usage was increasing at similar rates in states without marijuana legislation and that marijuana use in total is increasing nationally (Khatapoush, 2004). Thus, there are likely additional factors influencing marijuana use, and marijuana legislation cannot be solely credited for this shift in behavior.
Nonetheless, marijuana legislation did appear to be influening who was using marijuana products at the state-level. In most states with marijuana laws, adolescent usage increased at higher rates than in states without marijuana legislation (Cerda, 2011; Pacula, 2013; Wen, 2014). This indicates that while we cannot prove that marijuana legislation definitively affects usage rates, it is likely that legislation does impact who is using, and at what rate. Thus, research indicates that marijuana legislation is affecting the typical demographic factors of marijuana users in participating states, and thus influencing marijuana-related behavior.
Case Analysis
integral role in determining who will be affected by specific legislation. These three cases demonstrate that certain demographics of people are likely to be more affected by legislation than others. However, the demographic group most at risk of being affected by legislation varies by social policy and geographic location, indicating that legislation does not affect all people uniformly. Therefore, legislation may not influence populations in the way it is projected to, but it is likely to nonetheless affect the lives of certain individuals. Using this frame of analysis, I find that legislation does influence human behavior.
Furthermore, research suggests that legislation at the state-level appears to be more effective at influencing the behavior of its constituency than at the national level. In the case studies with both state and national legislation i.e. abortion and motor voter laws, research indicates that state-level legislation has a large effect on behavior, while similar federal legislation is less influential. These findings are critical to my analysis of Physician Assisted Suicide legislation, as PAS laws are currently only represented at the state level.
I believe these findings support my hypotheses in reference to the impact of Physician Assisted Suicide legislation in that certain suicide demographic variables are more likely to be affected than others. However, this research did not provide definitive evidence that PAS would cause suicide rate to increase, or that a PAS law would incentivize suicide. I believe the
ii. Definitions
There are several key words and expressions that will be regularly used throughout this paper. I have defined each of these expressions below.
I define physician assisted suicide as the voluntary termination of one's own life by administration of a lethal substance with the direct or indirect assistance of a physician. Therefore, suicides must be facilitated by a physician through the state-sponsored legislations, and following all appropriate guidelines in order to qualify as PAS. In order to access PAS in any of the participating states, one must be a resident of the state, mentally competent, over the age of eighteen, and diagnosed with a terminal illness that will result in death within six months (How to Access, 2017). Therefore, PAS is only available to a specific group of individuals.
Before discussing my variables, it is necessary to explain the expressions “normal suicide behavior” and/or “typical suicide behavior.” These expressions will be used quite frequently throughout the paper to describe the standard statistical trends associated with suicide in a geographic region. These trends can include the ordinary suicide rate in a given year, and/or the statistically normal demographic traits of individuals who commit suicide. Therefore, when I refer to a variable that influences normal/typical suicide behavior, I am likely referring to a variable that causes a change in annual suicide rate, or a shift in the statistical probability that an individual will commit suicide.
when I use the expression “individual propensities for suicidal action,” I am simply describing an individual’s likelihood to commit suicide because of the traits he or she possesses. The specific
traits that I am analyzing are my three independent variables: education level, race, and marital status.
For assessing education level, I am using the Organization for Economic Cooperation and Development’s (OECD) definition of education standards. The OECD defines low levels of education attainment as not achieving beyond lower secondary education. In the US, lower secondary education refers to high school. Furthermore, the OECD defines middle levels of education as those who have completed upper secondary and/or post-secondary non-tertiary education. High levels of education attained refers to individuals having completed short-cycle tertiary education and/or Bachelor's or equivalent level (OECD, 2012).
For assessing marital status, I will be employing five potential relationship categories. These five categories include: never married/single, married, widowed, divorced, and marital status unknown. I have chosen these categories as a result of the available data. Categories such as domestic partnership or family status will not be included.
For assessing race, I will be using a US standard definition of race. I will be including six categories, which include: White, Black, American Indian, Asian/Pacific Islander, Hispanic, and race unknown. These are the standard US definitions of race as they are collected by the US Census Bureau and the Center for Disease Control. There will not be a biracial category, nor any subcategories underneath any of the six racial groups listed above.
iii. Theoretical Analysis
Some researchers find that demographic factors play a significant role in determining suicide risk while others emphasize the importance of individual experiences as the leading determinant of risk (Overholser, 2009). Therefore, suicide literature can be fairly inconsistent. Despite some ambiguity, my hypotheses are derived from the results of studies that employed similar methods as my own research does.
For the first variable, education, the results were less inconsistent than my following two variables. When forming a theory concerning education level, I looked specifically at how
education-focused studies were designed. I looked for studies that were completed in the US, and directly compared individuals’ education level with overall suicide rates. Most studies found that a low education level increases one’s risk for suicide (Smith, 1988). The research models within these studies ranged from smaller, representative case studies to large-scale quantitative
population studies. Therefore, existing literature has effectively reached a consensus despite differences in methodology and geographic demography. As a result, I trust that this research is comprehensive and applicable, and that my own research will garner similar results. As a result, I anticipate discovering that individuals with high education levels are less likely to commit
suicide, whereas low education serves as a potential risk factor for suicide.
are not necessarily representative of suicide behavior on a national scale. Conversely, the studies that found white individuals are at the highest risk of suicide were conducted similarly to my own research: they were expansive quantitative studies that examined race-specific suicide rates over an extended period of time (Manton, 1987, Kenneth, 1987, Kubrin, 2009). Furthermore, there were simply more studies overall that found white individuals committed suicide at higher rates than black individuals. Consequently, I predict that whites are more likely to commit suicide than minorities, as I find the existing research to be more extensive and applicable. In addition, the research methods in these aforementioned studies are quite similar to the method I have employed in this study. Therefore, I predict to yield similar results and explains why I believe my findings will indicate that white men are at the highest risk of suicide.
Finally, the available information concerning the demographic factors of individuals who exercise their right to PAS is extremely limited. There are few known studies that have analyzed the demographic traits of PAS pursuers in the United States. Two of these studies analyzed whether “vulnerable groups” were at higher risk of PAS (Battin MP, van der Heide A, Ganzini L, 2007; Finlay, 2007). Within the “vulnerable groups,” people with low educational status and racial and ethnic minorities were analyzed. These studies found that neither of these two groups of individuals were at a higher risk of pursuing PAS. This information is consistent with the literature I analyzed on suicide risk and race, but directly conflicts with my predictions about the relationship between educational attainment and suicide risk. Most of the literature on suicide indicated that lowly educated individuals were more likely to commit suicide; however, PAS studies found that low education was not a risk factor for PAS. Therefore, these studies’ findings imply that there may be a difference in the typical educational demographic for suicide victims and for PAS pursuers. Furthermore, an additional study found that PAS users tended to have higher education attainments, further validating the findings of the previous two studies (Smith, 2015). This study, Predictors of Pursuit of Physician-Assisted Death, is also the only US study that researched the correlation between marital status and suicide risk. Researchers found that PAS users tend to be unmarried. This information is similar to the demographic information for suicide, which indicates that unmarried, widowed individuals have the highest risk for suicidal action. The Predictors study does not specify whether it is specifically widowhood that is a risk factor for PAS, but rather that unmarried status is a risk. Therefore, I anticipate that the
legislation results in suicide deaths of individuals who were once demographically unlikely to commit suicide prior to PAS laws. Although there are very few studies on the manner, these studies tested similar variables as my study, so I am trusting their results when developing my own hypotheses. I additionally only looked at studies which analyzed PAS in the US, and ignored those which measured the impact of assisted death in European countries.
Furthermore, I believe that broadening the spectrum of which individuals are statistically likely to commit suicide will ultimately result in the overall rate of suicide (including PAS deaths) to increase. I am making this prediction based upon logic, rather than on previous literature. If certain demographics of terminally ill individuals, who were once not at risk of committing suicide, are now committing suicide via PAS, we would expect to see an overall increase in suicide rates. Consequently, I predict that normal suicide behavior will be doubly affected by the enactment of PAS in these ways.
IV. Hypotheses
I have developed four hypotheses. The first hypothesis predicts how PAS will affect the state-level suicide rate. The second two hypotheses are composed of two parts. The first part of the hypotheses evaluates the prevalence and predictability of the demographic traits of PAS pursuers and/or suicide victims in comparison with the demographic traits of the general
population. The second part presents my predictions concerning my three independent variables and their relationship with the demographic traits of PAS pursuers and suicide victims. The third hypothesis discusses whether or not any of the three variables has a different impact on PAS risk compared to suicide risk.
2. Hypothesis Two: Those who exercise their right to Physician Assisted Suicide will reveal fairly homogenous and predictable demographic traits, which are defined below.
1. White individuals are more likely to exercise their right to PAS than minorities are.
2. Highly educated individuals are more likely to exercise their right to PAS than lower educated individuals are.
3. Unmarried individuals are more likely to exercise their right to PAS than married individuals are.
3. Hypothesis Three: The typical demographic traits of a suicide victim in the US will be less predictable than those of a PAS pursuer, but will nonetheless be predictable. These traits are enumerated below.
1. White individuals are more likely to commit suicide than minorities. 2. Lower educated individuals are more likely to commit suicide than highly
educated individuals.
3. Unmarried, specifically widowed, individuals are more likely to commit suicide than married individuals.
V. Research Design Rate of Suicide
In order to measure the effect of Physician Assisted Suicide legislation on human behavior, it is necessary to test whether typical suicide risk was influenced by the enactment of PAS. I chose to measure whether or not suicide behavior was affected in two different ways. I designed the first method to test whether overall suicide rates increased as a result of PAS legislation. In order to measure this impact, I chose to compare the rate of suicide in participating states i.e. Oregon and Washington, before and after the enactment of PAS—looking specifically at whether the overall suicide rate in a given state was affected.
To analyze a potential variation in overall suicide rates, I studied suicide data both before and after PAS legislation was enacted. I gathered data from annual suicide reports beginning in 1990 in Oregon and 2000 in Washington and ending in 2015 for each state. These starting years were chosen in order to analyze the suicide rate for approximately eight years prior to the enactment of PAS legislation in each state. This data contains the total number of suicides in a given year, which I converted to establish annual suicide rates per 100,000 people. However, these rates did not include Physician Assisted Suicides within their calculations.2 Therefore, the first suicide rate line3 included all non-PAS suicides from 1990-20154 and 2000-2015.5 Nonetheless, this suicide rate does not accurately record all suicides in a given year, because it did not include the
hundreds of suicides completed via PAS. Therefore, in order to accurately gauge the impact of
2 The health departments in both Oregon and Washington classify PAS deaths as medical deaths within their mortality reports, and thus do include PAS deaths within their suicide data
information.
PAS, it is necessary to compare this suicide rate with a suicide rate that was inclusive of PAS deaths. As a result, I have created two different annual rates of suicide: the first rate of suicide does not include PAS deaths, while the second suicide rate does include PAS deaths. The PAS-inclusive suicide rate begins at the year that PAS legislation was enacted in each state.6 I created a suicide rate that included PAS deaths by taking the total number of suicides within each year and adding the total number of PAS deaths that occurred in the same year, and then calculated the new suicide rate per 100,000 people.7
Furthermore, I developed two models to compare suicide rates before and after PAS: one for the state of Oregon and one for the state of Washington. These states were chosen because they each introduced PAS legislation more than five years ago, allowing me to observe the
implications of said legislation over an extended period of time. For every year, each rate observed is calculated per 100,000 people. The suicide rate that does not include PAS deaths is represented by a solid blue line, while the suicide rate that includes PAS deaths is represented by a solid orange line in each of the graphs. I plotted the annual suicide rate (non-PAS) for Oregon from 1990 to 2015, and for Washington from 2000 to 2015. I chose the respective beginning years of 1990 and 2000 in order to observe the suicide rates several years prior to the passage of PAS legislation in each state, and then compare these rates with the average suicide rates after the enactment of PAS.
After all of the rates are plotted, I looked specifically for a few distinctive trends. Firstly, I analyzed the rates to see if the non-PAS suicide rates decreased after the enactment of PAS. My reasoning for this is as follows: if the demographic of people who were statistically likely to
6 PAS legislation was enacted at the end of 1997 in Oregon and in 2008 in Washington.
commit suicide prior to PAS legislation are choosing to exercise their right to PAS instead of committing suicide independently, then I would predict to see a decreased non-PAS suicide rate, and a PAS-inclusive suicide rate that is similar to the projected rate of suicide before PAS legalization. Therefore, the PAS-inclusive suicide rate would emulate the state’s suicide rate prior to enactment of PAS legislation.
However, per my hypotheses, I predict that the demographic of PAS pursuers will differ from the demographic of suicide victims, thus resulting in a new faction of people—who were once not at risk of suicide—choosing to commit suicide via PAS. If these hypotheses are correct, I would expect to see an increased rate of total suicides,8 and an unchanged rate of non-PAS suicide. Hence, the same demographic of people would continue to commit suicide regardless of PAS, and a new demographic of people would exercise their right to PAS, increasing the overall suicide rate.
In addition, I calculated PAS as a percentage of all suicides for each year from the time of enactment in both Oregon and Washington. I included these calculations in Figure 1 and Figure 2. These percentages will indicate PAS’s total share of all suicides and illustrate whether that share is increasing over time.
Individual Propensities for Suicide
The second method utilized to assess PAS’s impact on normal suicide behavior was to measure the differences between the demographic of people who commit suicide and the demographic of people who exercise their right to PAS in order to determine an individual’s propensities for suicide. The purpose of comparing these two demographic factors was to
analyze whether PAS incentivized individuals who were once statistically unlikely to commit suicide, to commit suicide with PAS. A demographic shift would imply that PAS does influence behavior, because it increases certain individuals’ propensities for suicidality.
In order to analyze a potential variation in normal suicide demographic traits, I chose three variables to observe: education-level, race, and marital status. I used demographic data from the CDC Multiple-Cause Mortality Report to find data concerning the relationship between these three variables and suicide victims in the US. The CDC provided individual data
concerning every suicide death in 2015, and the education level, race, and marital status of each victim was included. After obtaining this information from the mortality files, it was necessary to locate similar data for PAS victims. Data that disclosed demographic information about PAS victims was released from state health departments in Oregon, Washington, California, and Colorado.9 This data also reported on the three aforementioned variables, and has been released annually from the time of the law’s enactment in each state. I collected and consolidated the data from each year, so this data represents nearly twenty years of PAS demographic information.
Once consolidated, I isolated and evaluated each of the variables. I created a bar graph for each variable, directly comparing the demographic information from suicide deaths and PAS deaths. Furthermore, I provided state population demographic information in each graph to give context and control for potential population aberrations. This representation made the
distinctions between the data clear and easy to identify.
9 Vermont and Washington DC have also enacted PAS legislation. Vermont has privacy
There are four graphs presented for each of the three independent variables:10 education level, race, and marital status. These four graphs differ by geographic region11. For each variable, there is a graphic that displays US data and compares US suicide statistics to PAS suicide
statistics. The PAS data are combined data from all participating states with data available.12 The other three graphs are of Oregon, Washington, and California:13 all states that have PAS laws and have released demographic data concerning PAS victims. These graphs compare state-specific PAS information with state-level suicide data. Furthermore, each of the graphs contains population information for its specific region in order to assess whether PAS or suicide deaths are over or underrepresented within a given demographic category. Data across all graphs is measured in percentages.
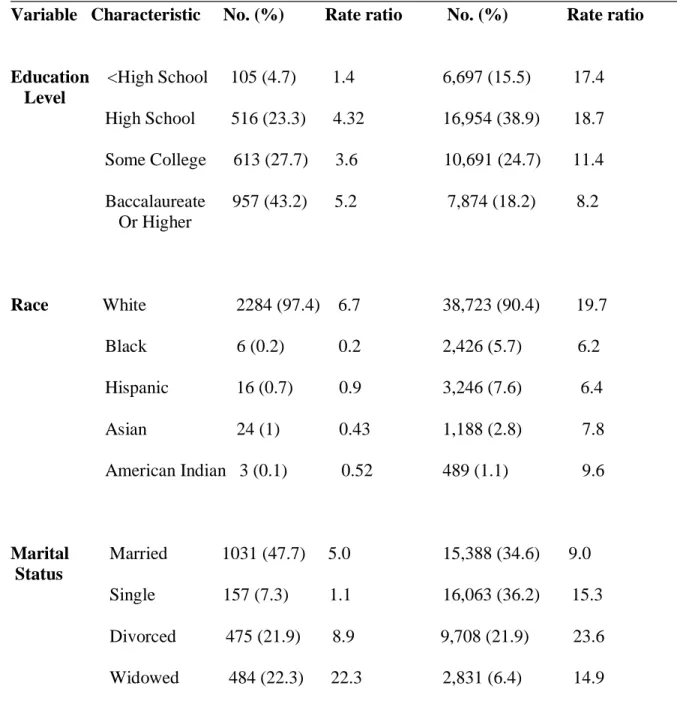
The bar graphs were generated in order to clearly present the data at face value, and see a direct comparison between PAS and suicide demographic factors. However, I additionally created rate ratios for each of the variables and their characteristics in order to evaluate which characteristics are most present among PAS pursuers and suicide victims. For reference, a rate ratio is defined as the ratio of the incidence rate in an exposed group divided by the incidence rate in an unexposed comparison group. The incidence rate is the number of individuals who developed the outcome of interest, i.e. committed suicide, in a given time period (LaMorte,
10 Physician Assisted Suicide is an additional independent variable, but does not have an
independent set of graphs. Instead, there is PAS-related data included on the graphs for the other three variables: education level, race, and marital status, in order to compare PAS data with suicide data.
11 There are only three graphs for marital status because California does not release data information concerning the marital status of PAS pursuers.
12 Vermont and Washington DC do not have data available, and thus, demographic data relating to PAS deaths within these regions are not included in my findings.
2006). The rate ratios for PAS were created by taking the total number of PAS pursuers within a certain category and finding the ratio between said pursuers and typical population demographic variables. I used the same methods for suicide victims, and was then able to compare the rate ratios from PAS and suicide. All rate ratios are calculated per 100,000 people. This information allows me to determine which characteristics present the highest risk for both PAS and suicide, and whether or not these risk factors are different between the two.
VI. Defining the Independent and Dependent Variables
For this project, I have utilized two isolated dependent variables. The first dependent variable is the rate of suicide within a given year, while the second dependent variable is an individual’s propensities for suicide. I have chosen two dependent variables in order to measure the impact of PAS on multiple levels and effectively gauge the overall influence of Physician Assisted Suicide on normal suicide behavior. By testing PAS’ effect on suicide rate, I am evaluating whether state-level suicidality has increased due to the enactment of PAS. This variable measures the impact of PAS at the state level. The data I use for this variable contains annual suicide rates both before and after the enactment of PAS.
My independent variables differ for each dependent variable. For my first dependent variable, rate of suicide, my independent variable is the enactment of PAS. I am evaluating whether PAS legislation increases or decreases the total suicide rate within a given year. My second dependent variable has four independent variables: education level, race, marital status, and physician assisted suicide. Each of these variables are being evaluated on how they affect an individual’s suicide risk. For education level, I am analyzing whether lower or higher levels of education attainment render an individual more likely to commit suicide. In reference to race, I am measuring the overall impact of race on suicidality, and whether one’s race increases or decreases his or her probability of committing suicide. Furthermore, for marital status, I am assessing whether an individual's relationship status affects likelihood of suicidal action. Finally, I will measure the effects of each of these variables on PAS risk, and compare the typical
demographic traits of suicide victims to those of PAS pursuers. More information concerning my datasets can be found below.
VII. Operationalization of Variables Dependent Variables
am measuring the suicide rate in Oregon from 1990-2015, and in Washington from 2000-2015. I received annual data reports for suicides from the Oregon Department of Health and the
Washington Department of Health, and used these reports to establish the aforementioned suicide rates.
Moreover, the operational definition for my second dependent variable, individual
propensities for suicide, is the likelihood that an individual will commit suicide as a result of the demographic traits that they possess. These traits refer to characteristics or attributes that are overrepresented among suicide victims, indicating that an individual’s possession of these traits enables him to be statistically more likely to commit suicide. I will measure propensity for suicide by observing demographic data of suicide victims, and determining which demographic traits are most commonly spotted among victims. If a certain trait is particularly prevalent among suicide victims, it is likely that that trait increases an individual’s propensity for suicide. I
obtained data on suicide demographic information the CDC Mortality Files for nation-wide suicide statistics, and from the National Violent Death Reporting System for state-wide suicide statistics, each ranging from 2003-2015. Furthermore, I collect data for PAS statistics from state health departments from Oregon, Washington, California, and Colorado. These states were chosen because they each have physician assisted suicide laws, and have related data available for analysis.
Independent Variables
In reference to individual propensity for suicide, I operationalized my first independent variable, education level, by measuring an individual’s number of degrees and/or years in school.
For instance, education level is divided into four primary categories. The first category is “less than high school.” This category indicates that an individual did not receive a high school diploma, or any educational attainment beyond that. The second category is “high school degree,” which implies that an individual completed high school, but did not pursue a degree higher than a high school diploma. The third category is “some college,” which can indicate two different academic achievements. “Some college” can refer to an individual receiving their Associate’s Degree from community college, or it could imply that someone has taken some college courses, but has not yet received their college degree. Lastly, “college graduate,” refers to an individual who has received a minimum of a bachelor’s degree. When I refer to a “low educated” individual, I am implying that the individual has a high school degree or lower. When I am referring to “highly educated” individuals, I am implying that the individual has a
bachelor’s degree or higher. I received education level data from the CDC Mortality Files for nation-wide suicide statistics, and from the National Violent Death reporting System for state-wide suicide statistics each ranging from 2003-2015. Furthermore, I received education level data from the Oregon, Washington, California, and Colorado Departments of Health for PAS statistics, ranging from the year of enactment until 2015.
from the CDC Mortality Files for nation-wide suicide statistics, and from the National Violent Death reporting System for state-wide suicide statistics, each ranging from 2003-2015.
Furthermore, I received race data from the Oregon, Washington, California, and Colorado Departments of Health for PAS statistics ranging from the year of enactment until 2015.
Moreover, I operationalize my third independent variable, marital status by measuring the marital status of an individual at the time of death. Therefore, if an individual was once divorced, but was married when she died, she would be considered married within my data sources.
Likewise, a married individual who was separated but not divorced at the time of death would also be considered married. This variable is divided into four primary categories: married, single/never married, divorced, and widowed. I received marital data from the CDC Mortality Files for nation-wide suicide statistics, and from the National Violent Death reporting System for state-wide suicide statistics, each ranging from 2003-2015. Furthermore, I obtained marital status data from the Oregon, Washington, California, and Colorado Departments of Health for PAS statistics ranging from the year of enactment until 2015.
My last independent variable, Physician Assisted Suicide has been previously defined as the voluntary termination of one's own life by administration of a lethal substance with the direct or indirect assistance of a physician (Physician, 2017). This type of suicide is only permitted by law in Oregon, Washington, Vermont, California, Colorado, and Washington DC. Therefore, data concerning PAS deaths can only come from the aforementioned states and DC. Consequently, I obtained PAS data and statistics from the Oregon, Washington, California, and Colorado Departments of Health14 ranging from the year of enactment until 2015.
Control variables
I decided upon implementing a few control variables in order to render accurate results. The first control variable I employed was age. I only analyzed data from suicides of individuals who were over the age of eighteen. PAS legislation is only available to individuals older than
eighteen, so I felt that I must control my minimum suicide age in order to ensure that I was analyzing the same general age demographic. Furthermore, literature indicates that there are specific factors that lead to adolescent suicide that are often irrelevant factors for adult suicide (Parallada, 2008).
Furthermore, my second control was intended death. Thus, I only analyzed the data of
intentional suicides. Accidental suicides or accidental self-inflicted injuries were excluded within this study. Pursuing PAS is a voluntary action/intentional suicide, and thus I limited my suicide analysis to voluntary suicides as well. On a related note, I additionally only analyzed PAS data of individuals who died as a direct result of PAS. I did not include data for individuals who were given the physician administered medication, but opted not to take it, or for individuals who died prior to taking the medication. The only data analyzed, in reference to PAS, was that of
individuals who took the medication and voluntarily committed suicide with the aid of a physician.
variables in a given region. Furthermore, in my chart that includes rate ratios for PAS and US suicides, I control for population demographic variables by establishing a rate for each
independent variable characteristic, which indicates the rate of suicides for a specific
characteristic in a given population. Therefore, these figures control for population demographic factors.
VIII. Results Table 1
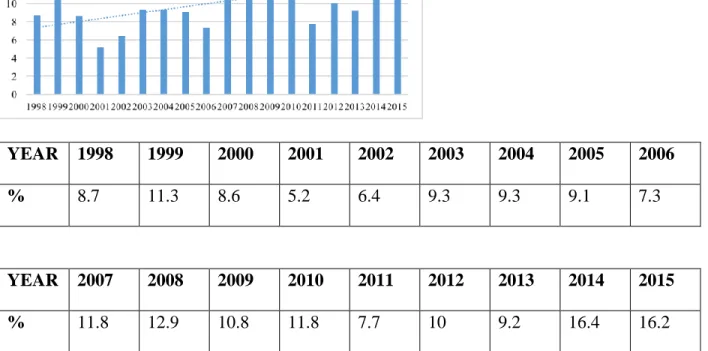
Figure 1: Oregon PAS as a Percentage of All Suicides
YEAR 1998 1999 2000 2001 2002 2003 2004 2005 2006
% 8.7 11.3 8.6 5.2 6.4 9.3 9.3 9.1 7.3
YEAR 2007 2008 2009 2010 2011 2012 2013 2014 2015
% 11.8 12.9 10.8 11.8 7.7 10 9.2 16.4 16.2
Figure 2: Washington PAS as a Percentage of All Suicides
YEAR 2009 2010 2011 2012 2013 2014 2015
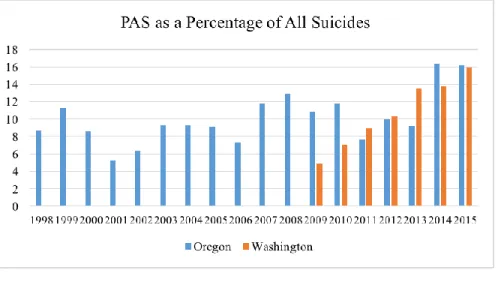
Figure 3: A Comparison of Washington and Oregon PAS as a Percentage of All Suicides
Rate of Suicide
Tables 1 and 2 display the comparison of PAS-inclusive and non-PAS suicide rates.15 There are several critical observations to be made from these results. Firstly, it is important to monitor the suicide rate prior to PAS in order to gauge the normal suicide rate fluctuations in Oregon and Washington. In Oregon, the annual suicide rate in 1997 was approximately .4 per 100,000 deaths more than in 1990. In Washington, there was a significant upsurge in the rate of suicides, with an increase of nearly 2 per 100,000 suicide deaths between 2000 and 2008. Neither of these rates consistently increased, however, and it was not uncommon for a rate to decrease one year and increase the next. Despite these fluctuations, there was an overall increase in suicide rate until the time that PAS legislation was enacted in each state.
The second important component to observe is the rate of suicide directly after the enactment of PAS. In both Oregon and Washington, there was an initial drop in the non-PAS suicide rate in each state. In Washington, the rate dropped by approximately 1 per 100,000 people after one
year of PAS, while in Oregon, the rate dropped nearly 2.5 per 100,000 people within two years of the enactment of PAS. These figures are significant, as they are both considerable decreases in the rate of suicide. However, Washington regularly experienced large variations in suicide rate depending on the year, and thus, it was not uncommon for Washington's suicide rate to decrease by 1 per 100,000 deaths in a year’s time. Therefore, these results should be treated with caution. Furthermore, the PAS inclusive suicide rate in Washington in 2009 was still lower than the non-PAS suicide rate in 2008, indicating that less people overall committed suicide. Therefore, it is difficult to definitively assume that the initial drop in 2009 was directly caused by the enactment of PAS legislation. These causality issues prevent me from decisively claiming that the initial drop in suicide rate after the enactment of PAS was directly caused by PAS legislation in Washington.
However, the weakened rate of suicide in Oregon is arguably more significant than that of Washington for a number of reasons. Firstly, Oregon’s rate of suicide prior to PAS occasionally decreased, but these decreases were typically minimal and inconsequential. Yet, in 1999, the non-PAS suicide rate dropped from 16.03 per 100,000 to 13.87 per 100,000 deaths. This drop occurred two years after the enactment of PAS,16 and the rate of both non-PAS and PAS-inclusive suicide rates actually increased in the first year of PAS. Therefore, there is more evidence that this fluctuation was not a typical part of suicide behavior in Oregon, and could have been related to PAS. Nonetheless, for similar reasons as above, I cannot definitively state that PAS was the primary cause for this initial decrease. However, from analyzing suicide rates
in Oregon for eight years prior to PAS, it seems unlikely that typical suicide influences17 caused for such a significant decrease in rate.
Furthermore, in order to assess whether PAS increased the overall suicide rate in each state, I analyzed the differences between the non-PAS suicide rates before and after PAS. I was looking specifically at whether PAS caused a shift (either a decrease or increase) in the non-PAS suicide rate, but I did not find a change in behavior. Therefore, PAS did not encourage or
discourage individuals from either state to increase or decrease their typical suicidal behavior. However, each state experienced hundreds of PAS deaths that were not included in the non-PAS suicide rate. Therefore, each state endured an anticipated number off non-PAS suicides in addition to hundreds of PAS suicides. Thus, the overall suicide rate in each state ultimately increased. Below is a more detailed description of this phenomenon.
Over the span of nine years in Washington (2000-2008), the suicide rate increased by just under 2 per 100,000 people. By contrast, the PAS-inclusive suicide rate over the span of seven years (2009-2015) increased by approximately 3.6 per 100,000 deaths, while the non-PAS rate increased by just over 2 per 100,000 people within the same time period. Therefore, the suicide rate in Washington, without including PAS deaths in its calculations, was increasing at a constant rate from 2000-2015. This consistency indicates that the non-PAS suicide rate was likely unaffected by the introduction of PAS. Thus, Washington was experiencing typical numbers of suicides each year, which would not imply unexpected or abnormal growth in the suicide rate. However, once PAS suicides are included to overall number of suicides, we find a sizable upsurge in the overall suicide rate, characterized by an increase of 3.6 per 100,000
people. Therefore, there is strong evidence that PAS ultimately increased the overall suicide rate in Washington.
Furthermore, in Oregon, the non-PAS suicide rate remained relatively steady throughout the last 25 years. In general, the suicide rate did not experience extended periods of growth or decline, but rather experienced some brief fluctuations. In fact, the suicide rate did not begin steadily increasing until after 2008. Since PAS was enacted in Oregon in 1997, it is unlikely that PAS caused the eventual gradual increase in suicide rate from 2008-2015. Therefore, like
Washington, the non-PAS suicide rate appeared to be unaffected by the introduction of PAS. Thus, Oregon was experiencing normal and expected rates of suicide each year, which does not provide evidence that PAS increased the overall suicide rate. However, once PAS suicides are added to the consistent rate of non-PAS suicides in Oregon, we do find an increase in the overall suicide rate. Furthermore, this increase is fairly sizable, as there was a 5 per 100,000 people increase in suicide rate since the enactment of PAS in Oregon.
Figures 1 and 2, which display PAS’s percentage of all suicides in each state, additionally validate my aforementioned discoveries. Firstly, these charts illustrate that PAS makes up a sizable share of total suicides, which indicates that PAS makes a significant impact on overall suicide rates. Secondly, it is apparent that each state reveals that the percentages increase with time. In Washington, PAS as a percentage of all suicides increases every year, nearly
suicides, but is accounting for an increasing share of suicides with time. In addition, Figure 3 shows a direct comparison between Oregon and Washington and illustrates that the percentages in each state appear to look very similar over time. This graphic also shows that PAS is
increasing in its share of all suicides.
Individual Propensities for Suicidal Action
Figure 4: Demographic Characteristics Rate Ratios
PAS patients 1998–2015 US Suicides 2015 (n = 44,417) ______________________________________________________________________________ Variable Characteristic No. (%) Rate ratio No. (%) Rate ratio
Education <High School 105 (4.7) 1.4 6,697 (15.5) 17.4 Level
High School 516 (23.3) 4.32 16,954 (38.9) 18.7 Some College 613 (27.7) 3.6 10,691 (24.7) 11.4 Baccalaureate 957 (43.2) 5.2 7,874 (18.2) 8.2
Or Higher
Race White 2284 (97.4) 6.7 38,723 (90.4) 19.7 Black 6 (0.2) 0.2 2,426 (5.7) 6.2
Hispanic 16 (0.7) 0.9 3,246 (7.6) 6.4 Asian 24 (1) 0.43 1,188 (2.8) 7.8 American Indian 3 (0.1) 0.52 489 (1.1) 9.6
Marital Married 1031 (47.7) 5.0 15,388 (34.6) 9.0 Status