Introduction
Organophosphorus pesticides (OPs) are a class of insecticides that act by irreversibly inacti-vating acetylcholinesterase, causing a build-up of acetylcholine in the synapse that leads to uncontrolled activation of sodium ion channel receptors (Fukuto 1990). Acute OP toxicity results from this acetylcholinesterase inhibi-tion; however, biological effects of chronic low-dose exposure may not be mediated by this pathway (Ray and Richards 2001), and these alternate mechanisms have been shown to result in persistent behavioral and/ or neurocognitive deficits in animals (Icenogle et al. 2004; Levin et al. 2002; Ricceri et al. 2003; Timofeeva et al. 2008; Vatanparast et al. 2013). Paraoxonase 1 (PON1), an antioxidant, is a key enzyme that deactivates
certain OPs (Costa et al. 2003). The first metabolism step, mediated primarily by P450 enzymes, converts the organothiophosphate to an oxon, the biologically active form, which PON1 then hydrolizes (Costa et al. 2003). Some functional polymorphisms in PON1 have been extensively studied and correlate strongly with enzyme expression levels (–108 C/T, T having reduced enzyme expression) or substrate-specific catalytic efficiency (Q192R, Q having slower catalytic efficiency for the chlorpyrifos oxon) (Costa et al. 2003).
Before 2001, residential applications of OPs to control pests were common in the United States particularly in urban, multi-housing units. In July 2000, the Environmental Protection Agency (EPA) and Dow Chemical agreed to eliminate all
residential use of chlorpyrifos in the United States by 31 December 2001. In December 2000, the U.S. EPA and registrants agreed to phase out and eliminate all indoor residential uses of diazinon by 31 December 2002 (U.S. EPA 2000, 2001). Diet from conventionally grown produce continues to be an important route of exposure in the general population to these and other OPs. Although OP pesticides continue to be widely used in agriculture, their usage has decreased over the last few decades—from 225 million pounds in 1980 to < 100 million pounds in 2007 (Grube et al. 2011); this decline is consistent with biomonitoring data, which show a decline in
Address correspondence to S. M. Engel, Department of Epidemiology CB#7435, UNC Gillings School of Global Public Health, Chapel Hill, NC 27599-7435 USA. Telephone: (919) 966-27599-7435. E-mail: [email protected]
Supplemental Material is available online (http:// dx.doi.org/10.1289/ehp.1409474).
We gratefully acknowledge the tremendous con-tributions of G. Berkowitz in developing the Mount Sinai New York Children’s Environmental Health cohort, and for all the centers, staff, students, com-munity partners, participants, and families, without whom these studies would not have been possible.
These studies were supported by grants from the National Insititutes of Health (5P01ES009600, R01ES008977, 5R01ES11158, 5R01ES012468, 5R01ES10165, 1P01ES11261, 5R01ES014575, 1R01ES015517, P01ES09584, P30ESO1896, 2P01ES09605-06, 2PO1ES09601, R01ES09883, and P60MD00222), the U.S. Environmental Protection Agency (R827027, 82860901, RD832141, R827039, R82670901-5, RD83170901, and R826886), the New York Community Trust, and the Agency for Toxic Substances and Disease Registry/Centers for Disease Control and Prevention (CDC)/Association of Teachers of Preventive Medicine.
A.B. has served as a consultant on cases unrelated to the issues covered in this paper and has partici-pated as a member of the Board for The Organic Center, a nonprofit organization that provides infor-mation for scientific research about organic food and farming. The other authors declare they have no actual or potential competing financial interests.
Received: 13 November 2014; Accepted: 23 September 2015; Advance Publication: 29 September 2015; Final Publication: 1 June 2016.
Prenatal Organophosphorus Pesticide Exposure and Child
Neurodevelopment at 24 Months: An Analysis of Four Birth Cohorts
Stephanie M. Engel,1 Asa Bradman,2 Mary S. Wolff,3 Virginia A. Rauh,4 Kim G. Harley,2 Jenny H. Yang,5
Lori A. Hoepner,6 Dana Boyd Barr,7 Kimberly Yolton,8 Michelle G. Vedar,2 Yingying Xu,8 Richard W. Hornung,8
James G. Wetmur,9 Jia Chen,3 Nina T. Holland,2 Frederica P. Perera,6 Robin M. Whyatt,6 Bruce P. Lanphear,10
and Brenda Eskenazi2
1Department of Epidemiology, UNC Gillings School of Global Public Health, Chapel Hill, North Carolina, USA; 2Center for Children’s Environmental Health, School of Public Health, University of California, Berkeley, Berkeley, California, USA; 3Department of Preventive Medicine, Icahn School of Medicine at Mount Sinai, New York, New York, USA; 4Department of Population and Family Health, Mailman School of Public Health, Columbia University, New York, New York, USA; 5Department of Biostatistics, UNC Gillings School of Global Public Health, Chapel Hill, North Carolina, USA; 6Department of Environmental Health Sciences, Columbia Center for Children’s Environmental Health, Mailman School of Public Health, Columbia University, New York, New York, USA; 7Department of Environmental Health, Rollins School of Public Health, Emory University, Atlanta, Georgia, USA; 8Division of General and Community Pediatrics, Cincinnati Children’s Hospital Medical Center, Cincinnati, Ohio, USA; 9Department of Microbiology, Icahn School of Medicine at Mount Sinai, New York, New York, USA; 10Simon Fraser University, Vancouver, British Columbia, Canada
Background: Organophosphorus pesticides (OPs) are used in agriculture worldwide. Residential
use was common in the United States before 2001.
oBjectives: We conducted a pooled analysis of four birth cohorts (children’s centers; n = 936) to evaluate associations of prenatal exposure to OPs with child development at 24 months.
Methods: Using general linear models, we computed site-specific and pooled estimates of the
association of total dialkyl (∑DAP), diethyl (∑DEP), and dimethylphosphate (∑DMP) metabolite concentrations in maternal prenatal urine with mental and psychomotor development indices (MDI/PDI) and evaluated heterogeneity by children’s center, race/ethnicity, and PON1 genotype. results: There was significant heterogeneity in the center-specific estimates of association for
∑DAP and ∑DMP and the MDI (p = 0.09, and p = 0.05, respectively), as well as heterogeneity in the race/ethnicity-specific estimates for ∑DAP (p = 0.06) and ∑DMP (p = 0.02) and the MDI. Strong MDI associations in the CHAMACOS population per 10-fold increase in ∑DAP (β = –4.17; 95% CI: –7.00, –1.33) and ∑DMP (β = –3.64; 95% CI: –5.97, –1.32) were influ-ential, as were associations among Hispanics (β per 10-fold increase in ∑DAP= –2.91; 95% CI: –4.71, –1.12). We generally found stronger negative associations of ∑DAP and ∑DEP with the 24-month MDI for carriers of the 192Q PON1 allele, particularly among blacks and Hispanics. conclusions: Data pooling was complicated by center-related differences in subject characteristics,
eligibility, and changes in regulations governing residential use of OPs during the study periods. Pooled summary estimates of prenatal exposure to OPs and neurodevelopment should be inter-preted with caution because of significant heterogeneity in associations by center, race/ethnicity, and PON1 genotype. Subgroups with unique exposure profiles or susceptibilities may be at higher risk for adverse neurodevelopment following prenatal exposure.
citation: Engel SM, Bradman A, Wolff MS, Rauh VA, Harley KG, Yang JH, Hoepner LA,
median urinary OP metabolite levels over a 6-year period in a representative sample of the U.S. general population (Barr et al. 2011). Nonetheless, residents in agricultural areas can be exposed if employed in agriculture, or by take-home exposure on clothes or shoes from household agricultural workers and by pesticide drift (Curl et al. 2002).
Starting in 1998, the National Institute of Environmental Health Sciences (NIEHS) and EPA jointly funded multiple Children’s Environmental Health and Disease Prevention Research Centers across the United States. Four Centers pursued research on prenatal exposure to OP insec-ticides: Columbia University (“Columbia”), Mount Sinai Medical Center (“Mount Sinai”), University of California at Berkeley CHAMACOS study (“CHAMACOS”), all starting in 1998, and Cincinnati Children’s Hospital HOME Study (“HOME”) starting in 2003. These four centers targeted urban (Mount Sinai and Columbia), urban and suburban (HOME), and rural/agricultural (CHAMACOS) populations, of varying sociodemographic and racial/ethnic charac-teristics. Uniform biomarkers of exposure and metabolism and neurodevelopmental assessments were employed. Because indi-vidual centers had limited power to explore associations within susceptible subgroups, we describe a pooled analysis of these four cohorts in relation to the mental and psycho-motor development of children 24 months of age, taking into account both genetic and demographic susceptibility factors.
Methods
The enrollment criteria and procedures used by each center are described below and summarized in Table 1:
Study populations. The University of California, Berkeley, Center for Environmental Research and Children’s
Health. Between October 1999 and
October 2000, the Center for the Health Assessment of Mothers and Children of Salinas (CHAMACOS) study enrolled 601 pregnant women living in the Salinas Valley of California and receiving prenatal care at the Natividad Medical Center or one of five prenatal care clinics serving farmworker populations. Eligible women were < 20 weeks’ gestation at enrollment, were eligible for Medi-Cal, were ≥ 18 years of age, spoke English or Spanish, and planned to deliver at the Natividad Medical Center. Prenatal maternal spot urine specimens were obtained at enrollment on average at 13 weeks gesta-tion and again at 26 weeks gestagesta-tion. There were 538 infants after subtracting losses due to miscarriage, moving, or dropping from the study before delivery. Subsequent exclusions included gestational or preexisting diabetes, hypertension, twin births, stillbirths, and one very low birth weight infant (< 500 g), resulting in a final sample size of 488 preg-nancies (Eskenazi et al. 2004). The Bayley Scales of Infant Development, 2nd Edition (BSID-II) was administered to children in Spanish and/or English by psychometricians who were unaware of the child’s exposure level (n = 372). The BSID-II is a standardized developmental test that assesses current devel-opmental functioning and generates a Mental Development Index (MDI) and Psychomotor Developmental Index (PDI) (Bayley 1993). Together these describe the child’s current level of cognitive, language, and fine and gross motor development. Psychometricians were trained using standardized protocols and were supervised for quality assurance
by a clinical neuropsychologist. Assessments were performed in a private room at the CHAMACOS research office or in a recre-ational vehicle modified to be a mobile testing facility (Eskenazi et al. 2007).
Cincinnati Children’s Environmental
Health Center HOME Study. The Health
Outcomes and Measures of the Environment (HOME) Study enrolled a total of 468 women between March 2003 and January 2006. Because the HOME Study contains a nested, randomized trial of in-home lead and injury hazard controls, women had to have been living in housing built before 1978. Additional eligibility criteria included < 19 weeks gestation upon enrollment; living in Brown, Butler, Clermont, Hamilton, or Warren counties in Ohio; intention to continue prenatal care and deliver at collabo-rating obstetric practices; HIV negative; and not receiving seizure, thyroid, or chemotherapy/radiation medications. From these women, prenatal urine specimens were obtained at approximately 16 and 26 weeks gestation. A total of 389 women delivered live-born, singleton infants without birth defects. The BSID-II was administered to 236 of these children at 24 months in a clinic setting by one of three examiners who were trained to reliability, and recertified in administration and scoring every 6 months. Examiners were blind to the exposure characteristics of the children (Chen A et al. 2014).
The Columbia Center for Children’s Environmental Health. The Columbia study enrolled 727 pregnant women between 1998 and 2006. The cohort was restricted to nonsmoking women 18–35 years old who self-identified as either African-American race or Dominican ethnicity, and who had resided in Northern Manhattan or the South Bronx
Table 1. Summary of study design characteristics by cohort.
Subject characteristics
UC Berkeley Center for Environmental Research and Children’s Health
CHAMACOS Cohort
Cincinnati Children’s Environmental Health Center
HOME Study Columbia Center for Children’s Environmental Health Cohort
Mount Sinai Children’s Environmental Health and Disease Prevention Research Center Cohort Study location &
source population Agricultural population in the Salinas Valley, California Urban and suburban population residing in Brown, Butler, Clermont, Hamilton, or Warren counties in Ohio
Urban population residing in South Bronx or Northern Manhattan in New York City
Urban population consisting of women receiving antenatal care at the Mount Sinai Hospital or two private obstetric practices on the Upper East Side of Manhattan, New York City
Years of enrollment 1999–2000 2003–2006 2000–2001 1998–2002
Eligibility criteria Receiving prenatal care at a
designated clinic; < 20 weeks’ at enrollment; eligible for medical; 18 years or older; English or Spanish speaking
Living in housing built before 1978; < 19 weeks gestation at enrollment
African-American or Dominican women; 18–35 years of age; first prenatal care visit < 20 weeks gestation
Primiparous; English or Spanish speaking; first prenatal care visit < 26 weeks gestation.
Exclusion criteria Twins; gestational or preexisting
diabetes; hypertension; stillbirths; birth weight < 500 g
Twins; HIV positive; receiving seizure, thyroid, or chemotherapy/radiation medications
Twins; diabetes; hypertension; known HIV infection; smoking; Illicit drug use
Twins; diabetes, hypertension or thyroid diseases; Illicit drug use or alcohol abuse during pregnancy; severe pregnancy complications including very premature birth (< 32 weeks or < 1,500 g at delivery); congenital malformations Exposure measurement 2 urine samples at 13 and 26 weeks
gestation averaged on a creatinine-corrected basis
2 urine samples at 16 and 26 weeks gestation averaged on a creatinine-corrected basis
1 urine sample at 32 weeks
in New York City for > 1 year before preg-nancy. Women were excluded if they reported illicit drug use; had diabetes, hypertension, or known HIV; or had their first prenatal visit after gestational week 20. Women were considered fully enrolled if a 48-hr personal air sample and a blood sample was obtained either from the mother during her third trimester or from cord blood at delivery. The Columbia study used a blood-based biomarker of chlorpyrifos as the primary dosimeter of exposure in their population (Whyatt et al. 2004); however, from a subset of 91 women enrolled in 2000 and 2001, a maternal urine sample was obtained in the late third trimester (32.4 weeks; SD = 3.0) and analyzed for urinary OP biomarkers. Among these 91 women, the BSID-II was administered to 63 children in a study office by one of five trained bilingual research assistants who were assessed for reliability and blinded to exposure status. Every effort was made to maximize reliability in scoring by using standardized training procedures and regular quality control (Rauh et al. 2006).
T h e M o u n t S i n a i C h i l d r e n ’ s Environmental Health and Disease Prevention Research Center (Mount Sinai).
The Mount Sinai study enrolled 479 primipa-rous women with singleton pregnancies from the Diagnosis and Treatment Center prenatal clinic and two adjacent private practices between 1998 and 2002. Women were excluded if they had their first prenatal visit after 26 weeks of gestation; had chronic diseases such as diabetes, hypertension, or thyroid disease or developed a serious preg-nancy complication that could affect fetal growth and development; and consumed more than two alcoholic beverages per day or who used illegal drugs (Berkowitz et al. 2003). Seventy-five women were subsequently excluded because of medical complications, very premature births (< 32 weeks gesta-tion or < 1,500 g), delivery of an infant with congenital malformations, inability to obtain biological specimens before delivery, change of residence, or refusal to continue participation (Engel et al. 2007). Prenatal maternal spot urine specimens were obtained in the third trimester (mean = 31.2 weeks, SD = 3.7). Birth data were available for 404 mother– infant pairs. The BSID-II was administered to 225 of these children in English or Spanish at the study office by a trained examiner who was unaware of their exposure level and was supervised by a developmental psychologist. All examinations were scored by two indepen-dent examiners, and any discrepancies were resolved by discussion and review of materials (Engel et al. 2011).
Biomarkers of OP exposure. For all studies, maternal urine samples were analyzed at the Centers for Disease Control and Prevention
(CDC; Atlanta, GA) for six dialkylphosphate metabolites (including three diethylphosphate metabolites and three dimethylphosphate metabolites). CHAMACOS, Columbia, and Mount Sinai urine samples were analyzed at the CDC in 2002–2003, and those from the HOME study in 2010. Laboratory and quality control methods have been previ-ously reported (Barr et al. 2005; Bravo et al. 2004). For the CHAMACOS and HOME studies where two prenatal urine samples were obtained, the average of the creatinine-corrected log10 urinary metabolite values was used as the best estimate of prenatal exposure. For the Mount Sinai and Columbia studies, only one prenatal urine sample was obtained. In cases where concentrations of individual metabolites were below the limit of detection (LOD) and an instrument-read value was not provided, a random value < LOD was imputed using maximum likelihood estimation based on a log-normal distribution truncated at the LOD. For samples in which a metabo-lite value was missing due to analytic inter-ference (n = 23), the missing value within a class (diethyl or dimethyl) was imputed using the other non-missing values within that class, as has been previously described (Engel et al. 2007; Eskenazi et al. 2004). A complete description of the proportion of urines with biomarker values below the LOD or missing due to analytic interference is presented in Supplemental Material, Table S1. Diethyl and dimethylphosphate metabolites were then summed on a molar basis to obtain total diethylphosphate (∑DEP) and total dimethyl-phosphate (∑DMP) biomarker concentra-tions, respectively, which were subsequently summed to obtain total dialkylphosphate (∑DAP) levels. Individual metabolites were corrected for urinary dilution by dividing by urinary creatinine concentrations before aver-aging (CHAMACOS and HOME) and then summing (all cohorts). Urine specimens that contained < 10 mg/dL of creatinine (n = 4) were not used in the analysis. Summed metab-olite concentrations that were extremely low (e.g., the sum of three metabolites < LOD) were truncated at 3 SDs below the geometric mean to avoid including influentially low values.
PON1 genotyping. We used existing cord blood PON1 –108C/T and Q192R polymorphism information from each of the centers. Although maternal PON1 geno-types were available for some cohorts, they were not available for all. DNA extraction and genotyping methods have been previ-ously described for the Mount Sinai (Chen J et al. 2003, 2005; Wetmur et al. 2005), CHAMACOS (Holland et al. 2006), and HOME populations (Rauch et al. 2012). For the Columbia cohort, child DNA was obtained from cord blood and genotyped for
the –108C/T and Q192R polymorphism using TaqMan.
terms using a 1-df (degree of freedom) Wald chi-square test (α = 0.05) (Desquilbet and Mariotti 2010), and the overall model Akaike information criterion (AIC) (favoring the model with the lowest AIC).
We next assessed heterogeneity by race/ ethnicity using an expanded model which additionally included smoking and drug use during pregnancy, but not center, because center and race/ethnicity, smoking, and drug use during pregnancy could not be simultane-ously adjusted for in a regression model due to non-overlapping distributions in these factors by center. We then assessed whether any race/ ethnicity-specific associations varied by center by examining center-related heterogeneity within race/ethnicity groups.
Finally, to calculate an overall pooled association, we implemented linear mixed models in PROC MIXED, with a random intercept for center or race/ethnicity alter-nately. We additionally examined whether including Bayley examiner as a random effect along with center substantially improved the overall model fit. Finally, we assessed inter-actions with child PON1 genotype (three-level categorical) overall and stratified by
race/ethnicity (white, black, Hispanic). We considered all interactions to be significant at p < 0.10 using an F-test with 2 df. For main effects, we calculated 95% confidence inter-vals (CIs) and examined the magnitude of the point estimate, the width of the interval, as well as whether the interval crossed the null value. All analyses were conducted in SAS version 9.3. All subjects provided written informed consent at baseline and follow-up and institutional review board approval was obtained by the University of North Carolina at Chapel Hill, the Mount Sinai Medical Center, the Cincinnati Children’s Hospital Medical Center, the University of California at Berkeley Committee for the Protection of Human Subjects, and the Columbia University Medical Center.
Results
Participant characteristics by center. We present participant characteristics by center in Table 2. Maternal education was lowest among CHAMACOS participants, and highest among HOME participants. Hispanics made up the majority of partici-pants from the CHAMACOS and Mount
Sinai centers, although Mount Sinai also enrolled a substantial number of white and black participants. All Columbia participants reported black race, but 40% reported their country of origin as the Dominican Republic; these participants were classified as Hispanic in this analysis. The majority of HOME participants were white, although there were also black and Hispanic participants enrolled.
Exposure distributions by center.
Prenatal urinary ∑DAP, ∑DEP, and ∑DMP biomarker concentrations can be found in Figure 1; see also Supplemental Material, Tables S1 and S2. Geometric mean ∑DAP and ∑DMP concentrations were substantially higher in the CHAMACOS cohort than in all other cohorts, whereas the ∑DEP exposure distributions were fairly similar across cohorts.
Twenty-four–month mental development index. The overall pooled dose–response function is consistent with a log10 linear term, although above approximately 2 nmol/g creatinine there is a leveling off, in large part due to a deviation in dose–response functions among cohorts, with HOME and Columbia demonstrating positive associations above that exposure level, whereas CHAMACOS Table 2. Distribution of demographic characteristics in individual cohorts.
Subject characteristics
UC Berkeley CHAMACOS Cohort
(N = 377)
Cincinnati Children’s HOME Study
(N = 265) Columbia University (N = 60)
Mount Sinai School of Medicine
(N = 234)
n Percent n Percent n Percent n Percent
Born before 2001 246 65.3 0 0 24 40 211 90.2
Maternal education
Less than high school 304 80.6 20 7.6 23 38.3 67 28.6
High school graduate/GED 36 9.6 26 9.8 20 33.3 48 20.5
Any college 37 9.8 219 82.6 17 28.3 119 50.8
Language spoken in homea
English 17 4.5 252 95.1 46 76.7 195 83.3
Any Spanish 356 94.4 0 0 10 16.7 38 16.2
Other 4 1.1 0 0 1 1.7 1 0.4
Maternal marital statusb
Not married/not living with partner 65 17.2 40 15.1 45 75.0 113 48.3
Married/living with partner 312 82.8 225 84.9 15 25.0 121 51.7
Parity
Nulliparous 116 30.8 115 43.4 30 50.0 234 100.0
Parous 261 69.2 150 56.6 30 50.0 0 0
Maternal country of origin
Other 332 88.1 15 5.7 24 40.0 41 17.5
USA 45 11.9 250 94.3 36 60.0 162 69.2
Maternal race/ethnicity
White 3 0.8 190 71.7 0 0 51 21.8
Black 0 0 59 22.3 36 30.0 57 24.4
Hispanic 369 97.9 5 1.9 24 40.0 123 52.6
Other 5 1.3 11 4.2 0 0 3 1.3
Maternal age at delivery (years)c 377 26.5 (5.2) 265 29.9 (5.3) 60 24.7 (5.2) 234 23.8 (6.5)
Any alcohol use during pregnancy 90 23.9 125 47.2 9 15.0 29 12.4
Any illicit drug use during pregnancy 6 1.6 12 4.5 0 0 15 6.4
Any smoking during pregnancy 18 4.8 26 9.8 0 0 39 16.7
Child sex
Male 185 49.1 122 46.04 18 30.0 126 53.9
Female 192 50.9 143 53.96 42 70.0 108 46.2
Breastfeeding at 3 months 273 72.4 167 63.02 37 61.7 101 43.2
24-month Psychomotor Development Index (PDI)c 377 97.6 ± 10.5 264 91.1 ± 14.0 60 94.5 ± 9.4 228 93.6 ± 11.6
24-month Mental Development Index (MDI)c 377 85.8 ± 11.7 265 89.6 ± 14.3 60 84.4 ± 11.9 234 87.9 ± 13.8
aFor Mount Sinai, primary language indicates the subject’s endorsement (n = 139), or when missing, the language in which the questionnaires were administered over the course of the
and Mount Sinai both found negative asso-ciations. Nonetheless, a formal investiga-tion of the suitability of a log10 linear term using a 1-df Wald chi-square test (α = 0.05) (Desquilbet and Mariotti 2010) did not reject linearity in the overall pooled exposure variable (Figure 2). All estimates are expressed per 10-fold increase in creatinine-corrected log10-transformed ∑DAP/DEP/DMP.
In a model adjusted for center, maternal education, marital status, maternal age at delivery, alcohol use during pregnancy, child sex, Caldwell Home environment score, and breastfeeding, there was significant hetero-geneity by center in the association between ∑DMP and ∑DAP and the MDI (p = 0.05 and p = 0.09, respectively) (Table 3). CHAMACOS, Columbia, and Mount Sinai found negative associations between increasing ∑DAP exposure and the MDI, whereas the HOME study found a positive association. Only the CHAMACOS center-specific asso-ciation reached statistical significance. In CHAMACOS, the MDI score at 24 months declined by 4.17 points per 10-fold increase in creatinine-corrected, log10 transformed ∑DAP (∑DAP β = –4.17; 95% CI: –7.00, –1.33). The overall pooled association was also negative (∑DAP β = –1.28; 95% CI: –2.58, 0.03), and stronger after adjustment for maternal race/ethnicity, smoking, and drug use during pregnancy (∑DAP β = –1.48; 95% CI: –2.77, –0.19), although technically the inclusion of these covariates violates the positivity assumption. Nonetheless, significant heterogeneity in the center-specific associa-tions limits the interpretability of the pooled estimates. This heterogeneity was driven in large part by the strong negative associa-tion in the CHAMACOS cohort. With the CHAMACOS population removed, the overall pooled association was attenuated (∑DAP β = –0.71; 95% CI: –2.25, 0.83). Overall, the heterogeneity evident in the center-specific associations argues against interpreting the pooled association.
We also explored heterogeneity in the pooled associations with MDI according to race/ethnicity without adjustment for center (Table 4). There was significant heterogeneity in the ∑DAP and ∑DMP associations with the MDI by race/ethnicity (p = 0.06 and p = 0.02, respectively), with the strongest negative associations found among Hispanics for ∑DAP and ∑DMP (∑DAP β = –2.91; 95% CI: –4.71, –1.12; ∑DMP β = –2.34; 95% CI: –3.77, –0.91). The CHAMACOS population accounted for approximately 70% of all Hispanics included in this pooled analysis. Across racial/ethnic groups, the overall pooled association was still negative (∑DAP
β = –1.39; 95% CI: –2.67, –0.10), although this was to a large degree driven by the strong negative association among Hispanics.
We also examined heterogeneity of the associations with MDI by the child PON1 –108C/T and PON1 Q192R polymorphisms, in the whole population and within subgroups of race/ethnicity (Table 5). There was no signif-icant heterogeneity attributable to the –108 C/T polymorphism in the whole population for the ∑DAP, ∑DEP, or ∑DMP metabo-lites. However, among whites there was signifi-cant heterogeneity in estimates by genotype category, albeit in an unexpected direction. Although the T allele is considered the at-risk allele, corresponding to lower PON1 enzyme activity, white carriers of the TT genotype had higher MDI scores with increasing ∑DAP exposure (∑DAP β = 5.35; 95% CI: –0.41, 11.11), whereas the associations in the CC and CT genotype categories were inverse, and all confidence intervals included the null value. Among blacks and Hispanics, no signifi-cant heterogeneity by PON1 –108C/T was detected. There was a significant inter action with the Q192R polymorphism overall for ∑DEP (p = 0.01), with inverse associations between exposure and MDI among carriers of the QR or QQ genotype, but not RR carriers. No significant heterogeneity was found overall for PON1 Q192R and ∑DAP or ∑DMP. Among blacks, there was significant hetero-geneity between ∑DAP and PON1 Q192R
(p = 0.08), although the confidence intervals were very imprecise. Inverse associations were found for carriers of the QR genotype, but not for the RR or QQ (at-risk) genotype.
In sensitivity analyses, we examined whether there was significant heterogeneity (at p < 0.10) in the ∑DAP/∑DEP/∑DMP associations among Hispanics from different cohorts, among whites from different cohorts, and among blacks from different cohorts, and found none (data not shown). We also found that adjustment for a prenatal lead exposure biomarker did not substantially improve the fit (by AIC), nor did exclusion of lead from the model confound any associations of OP metabolites with the MDI (data not shown). And finally, we explored whether the overall fit of the pooled mixed effects model was improved with the addition of Bayley examiner and found no substantial difference in the main effect estimates compared with those that do not include Bayley examiner (data not shown).
Twenty-four–month psychomotor develop-ment index. Associations between OP metabo-lites and the PDI were generally null at the 24-month visit, with no indication that any associations were nonlinear, and with no substantial heterogeneity by center (Table 3), race/ethnicity (Table 4), or PON1 genotype (data not shown).
Figure 1. Distributions of dialkylphosphate metabolite sums in individual cohorts. The 25th, 50th, and 75th percentiles by center are represented by the lower, middle, and upper bars in the central boxes. The arith-metic mean by center is marked by the open diamond. Outliers at the upper and lower end of the exposure distribution are indicated by circles. Whiskers indicate 95% CIs.
4
3
2
1
0
–1
∑DAP
Log
10
concentration (nmol/g creatinine)
∑DEP ∑DMP
Discussion
In this pooled analysis of four prospectively enrolled NIEHS/EPA-funded Children’s Environmental Health and Disease Prevention Research Centers, we estimated that each 10-fold increase in prenatal exposure to
∑DAPs is associated with an approximate 1-point decrease in the 24-month MDI, whether pooled across four cohorts without adjustment for race/ethnicity (β = –1.28; 95% CI: –2.58, 0.03), or pooled across race/ ethnicities without adjustment for cohort
(β = –1.48; 95% CI: –2.77, –0.19). Although the estimates in general lead to the same conclusion, they should both be interpreted with caution given that there was evidence of significant heterogeneity, particularly for the ∑DMP metabolites, that could in part be attributed to center and race/ethnicity, as well as a significant threat of residual confounding by factors exhibiting non-positivity across centers. As described above, non-positivity occurs when there is a lack of exposed and unexposed individuals at all levels of the observed confounders—in this case, differences in eligibility and enrollment criteria resulted in some centers that lacked study subjects at all levels of key covariates of concern (e.g., prenatal smoking and drug use, years of birth, language spoken in the home). We addition-ally found evidence of heterogeneity in asso-ciations by PON1 genotype. In particular, we found evidence of heterogeneity in associations of ∑DAPs with the MDI according to PON1 –108C/T genotype among whites, hetero-geneity with ∑DEPs and MDI according to PON1 Q192R in the whole population, and with ∑DAPs and PON1 Q192R among both whites and blacks. There was no evidence of an association with PDI.
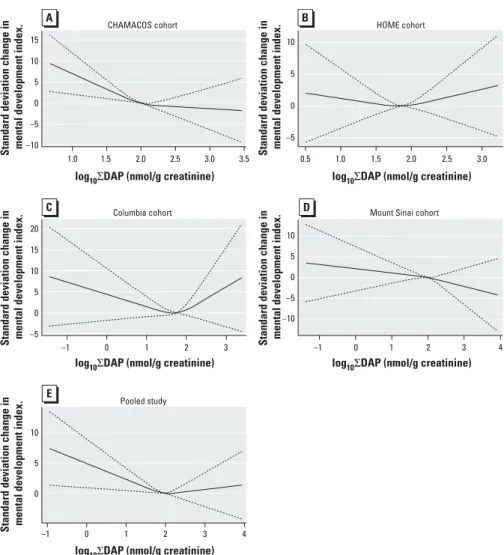
Although in some respects these cohorts were ideally suited for pooling because of their similar data collection tools for covariate and outcome data and biomarker measures obtained from the same laboratory, there are also differences among these cohorts that limit the interpretability of the overall pooled estimates. Eligibility and enrollment charac-teristics differed by center, as did the types of populations targeted (urban/suburban vs. agricultural) and the time frame of enroll-ment. Although some of the study-specific exclusions are unlikely to present a bias in the absence of a strong association between exposure and the characteristic in question (e.g., smoking and parity), other differences present more cause for concern (e.g., target population, enrollment year, gestational age at delivery exclusions). Mount Sinai excluded births < 32 weeks or < 1,500 g, CHAMACOS Figure 2. Restricted cubic splines for log10∑DAP association with the 24-month MDI in the
(A) CHAMACOS cohort, (B) HOME cohort, (C) Columbia cohort, (D) Mount Sinai cohort, and (E) pooled population. Splines demonstrate a roughly linearly declining relationship in the individual cohorts and the overall pooled population below approximately 2 nmol/g creatinine, which attenuates at higher concentra-tions. Although the HOME (B) and Columbia (C) cohorts appear to show a U-shape curve, the 95% CIs (dashed lines) demonstrate substantial imprecision around these estimates.
CHAMACOS cohort
Columbia cohort
Pooled study
Standard deviation change in mental development index. Standard deviation change in mental development index. Standard deviation change in mental development index.
Standard deviation change in mental development index. Standard deviation change in mental development index.
log10ΣDAP (nmol/g creatinine)
log10ΣDAP (nmol/g creatinine) log10ΣDAP (nmol/g creatinine) log10ΣDAP (nmol/g creatinine) log10ΣDAP (nmol/g creatinine)
Mount Sinai cohort HOME cohort 15
10
5
0
–5
–10
10
5
0
–5
10
5
0
–5
–10
10
5
0 20
15
10
5
0
–5 –1
–1
1
1
1.0 1.5 2.0 2.5 3.0 3.5 0.5 1.0 1.5 2.0 2.5 3.0
0
0
2
2
3
3 4
–1 0 1 2 3 4
Table 3. Association of creatinine-corrected log10 prenatal OP metabolite levels and 24-month MDI and PDI considering heterogeneity by center.
Model
CHAMACOS
[β per 10-fold
increase (95% CI)]a
HOME
[β per 10-fold
increase (95% CI)]a
Columbia
[β per 10-fold
increase (95% CI)]a
Mount Sinai
[β per 10-fold
increase (95% CI)]a
Center-OP-interaction (p-value)a
Pooled
[β per 10-fold
increase (95% CI)]a
Pooled (extended model)
[β per 10-fold
increase (95% CI)]b
24-month MDI n = 366 n = 257 n = 53 n = 225 n = 901 n = 901 n = 890
Log10∑DAP (nmol/gC) –4.17 (–7.00, –1.33) 0.97 (–1.82, 3.76) –0.79 (–4.17, 2.59) –1.14 (–3.12, 0.84) 0.09 –1.28 (–2.58, 0.03) –1.48 (–2.77, –0.19)
Log10∑DEP (nmol/gC) –1.40 (–4.12, 1.32) –1.10 (–3.42, 1.22) 0.11 (–2.88, 3.11) –0.22 (–1.85, 1.42) 0.81 –0.57 (–1.69, 0.54) –0.82 (–1.93, 0.28)
Log10∑DMP (nmol/gC) –3.64 (–5.97, –1.32) 0.73 (–1.59, 3.04) 0.13 (–2.33, 2.58) –0.80 (–2.52, 0.91) 0.05 –0.91 (–1.98, 0.16) –1.06 (–2.12, 0.00)
24-month PDI n = 368 n = 258 n = 55 n = 228 n = 909 n = 909 n = 898
Log10∑DAP (nmol/gC) –1.35 (–4.10, 1.41) 1.09 (–1.63, 3.80) –0.39 (–3.67, 2.90) –0.27 (–2.17, 1.63) 0.67 –0.23 (–1.48, 1.03) –0.08 (–1.34, 1.18)
Log10∑DEP (nmol/gC) –0.91 (–3.54, 1.72) –0.32 (–2.57, 1.93) –0.35 (–3.13, 2.42) 0.52 (–1.03, 2.06) 0.79 –0.02 (–1.09, 1.04) 0.15 (–0.91, 1.22)
Log10∑DMP (nmol/gC) –1.29 (–3.56, 0.97) 0.83 (–1.41, 3.08) –0.42 (–2.79, 1.95) –0.45 (–2.11, 1.21) 0.63 –0.35 (–1.39, 0.68) –0.30 (–1.34, 0.73)
∑DAP = ∑DEP + ∑DMP.
aModels were adjusted for maternal education, marital status, and age at delivery, alcohol use during pregnancy, child sex, Home environment score quartile, and breastfeeding at
least 3 months after birth, and include metabolite × center interaction terms. Tests for interaction were calculated using F-tests with 3 degrees of freedom. bAdditionally adjusted for
excluded births < 500 g, and Columbia measured exposure late in the third trimester of pregnancy, thus resulting in a truncated gestational age distribution that effectively excluded many preterm births. The Mount Sinai and Columbia populations individu-ally found no associations between organo-phosphorus pesticide exposures and length of gestation (Berkowitz et al. 2004; Whyatt et al. 2005), but the HOME and CHAMACOS populations did, at least for some of the metabolites (Eskenazi et al. 2004; Rauch et al. 2012). Although these were relatively weak associations overall, still, to the extent that early delivery lies intermediate on the causal pathway between exposure and neurodevelop-ment, exclusions of very early deliveries may have to some extent biased estimates of asso-ciations. We believe, however, that any bias is likely to be small given that on a population level, births < 32 weeks gestation or < 1,500 g account for < 1% of singleton births in the United States (Martin et al. 2015). Of more significance are cohort differences in target population and enrollment year, which are sure to have a pronounced impact on the type and intensity of parent OP exposures.
Another challenge to pooling these four unique cohorts was in reconciling the underlying exposure biomarker distributions. The distribution of the ∑DAP biomarkers was severely right skewed. And although the ∑DEP biomarker concentrations were very similar across the cohorts, the median ∑DMP exposure biomarker concentrations were considerably higher in the CHAMACOS study than in the Mount Sinai (42% higher), HOME study (78% higher), and Columbia (256% higher) populations. The advantages of the log10 transformation in the presence of right skewed data include achieving a more normal distribution and reducing the impact of outliers in modeling. Moreover, the dose–response function in our pooled popula-tion was consistent with a log10 linear term. Applying a log10 transformation to these data results in the expansion of values at the low end of exposure and the constriction of values at the high end of exposure. For example, an increase in exposure concentration from 0.9 to 9.0 nmol/gC and from 9.0 to 90 nmol/gC both equate to a 1-log10 unit change. As a result, the absolute increase in exposure concentration implied by a change in log10
units is relative to where you are in the natural distribution. This feature comprises the major limitation of the log10 transformation— specifically, the interpretability of effect esti-mates in reference to an absolute change in exposure level is lost. This is particu larly prob-lematic when comparing across centers with dissimilar exposure distributions. Moreover, it is possible that to some extent our findings of center and race-driven heterogeneity in asso-ciations are in part a result of this transforma-tion, in that the absolute change in biomarker concentration for the CHAMACOS study per log10 unit might be on average higher than the other centers, resulting in more elevated effect estimates in the CHAMACOS study.
Although DAP metabolites are the most commonly reported internal dosimeter of OP pesticide exposure, these biomarkers are nonspecific; the same metabolite can derive from multiple parent OPs that may differ in toxicity and potency. Therefore, a given DAP biomarker concentration from CHAMACOS, where subjects were exposed to pesticides used in agriculture as well as other sources of exposure (e.g., diet or resi-dential use), may not mean the same thing
Table 4. Association of creatinine-corrected log10 prenatal OP metabolite levels and 24-month MDI and PDI considering heterogeneity by race/ethnicity.
Model
White
[β per 10-fold
increase (95% CI)]a
Black
[β per 10-fold
increase (95% CI)]a
Hispanic
[β per 10-fold
increase (95% CI)]a
Race/ethnicity- OP interaction
(p-value)a
Pooled
[β per 10-fold
increase (95% CI)]b
24-month MDI n = 231 n = 142 n = 499 n = 872 n = 890
Log10∑DAP (nmol/gC) –0.29 (–2.89, 2.31) 0.49 (–2.07, 3.05) –2.91 (–4.71, –1.12) 0.06 –1.39 (–2.67, –0.10)
Log10∑DEP (nmol/gC) –1.46 (–3.62, 0.69) 0.09 (–2.15, 2.33) –1.00 (–2.57, 0.58) 0.60 –0.82 (–1.92, 0.29)
Log10∑DMP (nmol/gC) –0.21 (–2.39, 1.98) 1.10 (–0.94, 3.14) –2.34 (–3.77, –0.91) 0.02 –0.97 (–2.00, 0.07)
24-month PDI n = 234 n = 144 n = 502 n = 880 n = 898
Log10∑DAP (nmol/gC) 2.34 (–0.21, 4.88) –0.47 (–2.97, 2.03) –0.41 (–2.18, 1.37) 0.18 0.26 (–1.00, 1.51)
Log10∑DEP (nmol/gC) 1.15 (–0.97, 3.27) –0.57 (–2.75, 1.62) 0.27 (–1.24, 1.78) 0.54 0.32 (–0.75, 1.40)
Log10∑DMP (nmol/gC) 1.62 (–0.52, 3.75) –0.12 (–2.15, 1.91) –0.53 (–1.95, 0.89) 0.25 0.06 (–0.96, 1.08)
∑DAP = ∑DEP + ∑DMP.
aModels were adjusted for maternal education, marital status and age at delivery, alcohol, drug use or smoking during pregnancy, child sex, quartiles of Home environment score,
breastfeeding at least 3 months after birth, and birth before 2001, and include metabolite × race/ethnicity interaction terms. “Other” race/ethnicity was excluded due to small numbers. Tests for interaction were calculated using F-tests with 2 degrees of freedom. bPooled models include all race/ethnicity categories.
Table 5. Association of creatinine-corrected log10 prenatal OP metabolite levels and 24-month MDI according to PON1 genotype.
PON1 genotype
Pooled Blacks Whites Hispanics
n
Pooled β per 10-fold
increase (95% CI)
log10∑DAP
(nmol/gC)a
Pooled β per 10-fold
increase (95% CI)
log10∑DEP
(nmol/gC)a
Pooled β per 10-fold
increase (95% CI)
log10∑DMP
(nmol/gC)a n
β per 10-fold
increase (95%CI)
log10∑DAP
(nmol/gC)b n
β per 10-fold
increase (95% CI)
log10∑DAP
(nmol/gC)b n
β per 10-fold
increase (95% CI)
log10∑DAP
(nmol/gC)b
–108 C/T 766 11 203 429
CC 280 –2.35 (–4.58, –0.12) –0.61 (–2.55, 1.33) –1.78 (–3.59, 0.03) 75 –0.50 (–4.33, 3.32) 58 –5.12 (–10.71, 0.48) 140 –2.31 (–5.95, 1.32)
CT 346 –0.12 (–2.22, 1.97) –0.24 (–2.17, 1.69) –0.45 (–2.17, 1.26) 37 3.47 (–1.74, 8.68) 96 –0.37 (–4.30, 3.56) 207 –1.55 (–4.43, 1.32)
TT (at risk) 140 –1.22 (–4.48, 2.03) –1.74 (–4.56, 1.07) 0.14 (–2.34, 2.61) 7 –1.38 (–15.23, 12.47) 49 5.35 (–0.41, 11.11) 82 –5.54 (–9.67, –1.40)
p-Interaction 0.36 0.68 0.39 0.45 0.04 0.29
Q192R 762 112 206 429
RR 229 0.51 (–1.98, 3.01) 2.09 (–0.14, 4.31) 0.08 (–2.16, 2.32) 56 3.52 (–0.21, 7.26) 17 9.71 (–4.79, 24.22) 103 –3.86 (–7.97, 0.25)
QR 354 –2.31 (–4.60, –0.02) –1.94 (–3.94, 0.07) –1.23 (–2.86, 0.39) 47 –3.16 (–9.63, 3.32) 74 –4.10 (–8.69, 0.48) 224 –1.87 (–4.84, 1.09)
QQ (at risk) 179 –1.74 (–4.22, 0.75) –1.93 (–4.10, 0.24) –1.13 (–3.27, 1.02) 9 –11.85 (–25.51, 1.80) 115 1.15 (–2.53, 4.84) 102 –3.19 (–6.70, 0.33)
p-Interaction 0.23 0.01 0.62 0.04 0.08 0.71
∑DAP = ∑DEP + ∑DMP.
aModels were adjusted for maternal race/ethnicity, maternal education, age at delivery and marital status, smoking, alcohol or drug use during pregnancy, child sex, quartile of Home
environment score, breastfeeding at least 3 months after birth, and birth before 2001, and include metabolite × genotype interaction terms. Tests for interaction were calculated using F-tests with 2 degrees of freedom. bModels were adjusted for maternal education, age at delivery and marital status, smoking, alcohol or drug use during pregnancy, child sex,
as the same DAP biomarker concentration from the Mount Sinai or Columbia studies, which captured residential use of chlorpy-rifos and diazinon during permissible periods, as well as dietary exposures. Although some parent compounds are used in both settings, others are not. It is, for example, plausible that the strong negative association observed between the dimethylphosphate metabolites and the MDI in the CHAMACOS popu-lation is attributable partly to local use of oxydemeton-methyl, a highly toxic OP solely used in agriculture. Unfortunately, our pooled data do not permit definitive identifi-cation of the parent compound mix to which a subject was exposed, and it is likely that the parent compound exposure composition is more similar across subjects within a given cohort than across cohorts.
Another important consideration is the relative contributions of parent compound exposures versus preformed DAP exposures. Direct exposure to parent OP pesticide compounds results in metabolism and the production of metabolites along with the biologically active oxon-form. However hydrolysis or photolysis of parent compounds present in food and the environment also generates preformed DAPs that are not toxic when consumed, and that are mostly excreted unchanged in urine (Chen L et al. 2012; Zhang et al. 2008). Thus, measurements of DAPs in urine may overestimate exposure to parent pesticide compounds.
Exposure to OP pesticides through the diet (Lu et al. 2005) may result in a higher fraction of preformed DAP exposure relative to parent compound exposure compared with exposure through direct OP pesticide applica-tions (residentially or occupationally) or drift from nearby applications or para-occupational take-home exposures (Deziel et al. 2015; Quirós-Alcalá et al. 2012).
It is likely that the CHAMACOS popu-lation, located in an agricultural region with heavy continuing OP pesticide use, received a more substantial fraction of parent compound exposure relative to the Mount Sinai, Columbia, or HOME populations. Furthermore, the HOME population, which was enrolled after the U.S. EPA moved to restrict residential uses of OPs, likely expe-rienced higher dietary versus environmental exposures compared with the two New York City cohorts, which both spanned periods of indoor use of chlorpyrifos and diazinon for cockroaches. These circumstances likely resulted in the HOME study population having the highest fraction of preformed DAP exposures out of their total DAP exposure, and therefore those with higher urinary DAP biomarkers may have eaten higher quality diets that are high in fruits and vegetables. These differences in source, route, and
period may partly account for the significant center-driven heterogeneity that we identi-fied in our analysis (p = 0.09), although there is a lack of empirical evidence to fully describe any differences in exposure source and intensity the participants in these cohorts experienced. Indeed, the pattern of associa-tions across the centers appears to accurately reflect our a priori expectations of the magni-tude of parent compound exposures these subjects were likely to have experienced. The CHAMACOS association was the strongest (β = –4.17; 95% CI: –7.00, –1.33), followed by very similar estimates between the Mount Sinai (β = –1.14; 95% CI: –3.12, 0.84) and Columbia populations (β = –0.79; 95% CI: –4.17, 2.59), with a positive association in the Cincinnati HOME study (β = 0.97; 95% CI: –1.82, 3.76). The CHAMACOS population, an agricultural population where 44% of the study subjects reported personally working in agriculture during pregnancy and 84% lived with farmworkers, is likely to have experi-enced the highest parent compound exposure burden. Mount Sinai and Columbia also were enrolled before the U.S. EPA action to limit residential exposures, so exposure to parent compounds was likely to have been similar between the two cohorts, although less than in the agriculturally exposed CHAMACOS cohort. And the HOME study, because of the geographic and sociodemographic groups enrolled and the time period of enrollment, was likely to have been exposed primarily through the diet, with the least direct parent compound exposure (Yolton et al. 2013). Therefore, although the same method of exposure assessment was employed in all four studies, the meaning of the biomarkers may differ across studies, so pooling may obscure, at least in part, important differences in associations across studies.
Additionally, DAP biomarkers of OP exposure have been shown to exhibit low reproducibility over the course of pregnancy in a subset of the Generation R study, a population-based cohort from the Netherlands, in which a major determinant of exposure level was found to be fruit intake (Spaan et al. 2015). Two of the cohorts included in this pooled analysis collected two urine samples during pregnancy (CHAMACOS and the HOME study), and the creatinine-corrected average of these two specimens was used, and two cohorts only collected urine samples in the third trimester. Classifying exposure based on the mean value in two samples (vs. one sample) is likely to reduce exposure misclassification due to high within-subject variability, but might obscure associations if effects are specific to a particular time window of exposure.
Other limitations of pooled analyses should be taken into consideration when weighing these results. Both confounder
adjustment and an examination of hetero-geneity in any OP associations by suscep-tibility factors were limited to covariates and characteristics that were shared by all centers. This may have resulted in differences between previously reported center-specific associations, undetected but important effect heterogeneity, or the possibility of residual confounding by factors, such as poverty, prenatal smoking, primary language used in the home, parity, and other factors, that could not be accounted for due to non-overlapping covariate distributions. Including such covariates into multivariable adjusted pooled models when the expected sample size for a given cohort is zero in that exposure-covariate strata violates our assumption of positivity (Cole and Hernán 2008)—that at every level of the confounders there are both exposed and unexposed participants. For example, additionally adjusting for race/ ethnicity in a center-adjusted pooled model required that we assume that the effect of race is the same across each of the sites, an assumption that we could not explore for centers that lacked participants in one or more race/ethnicity group. Moreover, this assumption seemed tenuous given our knowl-edge of the differences in the CHAMACOS exposure source profile compared with all other cohorts. The analogous assumption is perhaps easier to accept for other covariates such as prenatal smoking or multiparity. We were able to assess differences only in our cohort-specific associations (with limited covariate adjustment that was consistent across all studies) from previously published estimates for the CHAMACOS (Eskenazi et al. 2007) and the Mount Sinai studies (Engel et al. 2011). For the CHAMACOS study, our current beta estimate for DAP metabolites and the MDI was slightly elevated relative to the prior paper, and there were essentially no differences for the other metabolites, or for any metabolite and the PDI. There were more differences in magni-tude evident when comparing the Mount Sinai beta estimates, the current analysis yielding somewhat attenuated associations. Additionally, although pooling these cohorts affords us more power to investigate gene– environment interactions, our power was still limited, particularly when stratified by race/ ethnicity, to estimate stable associations in the rare genotype categories.
RefeRences
Barr DB, Allen R, Olsson AO, Bravo R, Caltabiano LM, Montesano A, et al. 2005. Concentrations of selec-tive metabolites of organophosphorus pesticides in the United States population. Environ Res 99(3):314–326.
Barr DB, Wong LY, Bravo R, Weerasekera G, Odetokun M, Restrepo P, et al. 2011. Urinary concentrations of dialkylphosphate metabolites of organophosphorus pesticides: National Health and Nutrition Examination Survey 1999–2004. Int J Environ Res Public Health 8(8):3063–3098. Bayley N. 1993. Bayley Scales of Infant Development.
2nd ed. San Antonio, TX:Harcourt Brace & Company. Berkowitz GS, Obel J, Deych E, Lapinski R, Godbold J,
Liu Z, et al. 2003. Exposure to indoor pesticides during pregnancy in a multiethnic, urban cohort. Environ Health Perspect 111:79–84, doi:10.1289/ ehp.5619.
Berkowitz GS, Wetmur JG, Birman-Deych E, Obel J, Lapinski RH, Godbold JH, et al. 2004. In utero pesti-cide exposure, maternal paraoxonase activity, and head circumference. Environ Health Perspect 112:388–391, doi:10.1289/ehp.6414.
Bravo R, Caltabiano LM, Weerasekera G, Whitehead RD, Fernandez C, Needham LL, et al. 2004. Measurement of dialkyl phosphate metabolites of organophos-phorus pesticides in human urine using lyophili-zation with gas chromatography-tandem mass spectrometry and isotope dilution quantification. J Expo Anal Environ Epidemiol 14(3):249–259. Caldwell BM, Bradley RH. 1984. Administration
Manual: Home Observation For Measurement of the Environment. Revised ed. Little Rock, AR:University of Arkansas at Little Rock.
Chen A, Yolton K, Rauch SA, Webster GM, Hornung R, Sjödin A, et al. 2014. Prenatal polybrominated diphenyl ether exposures and neurodevelopment in U.S. children through 5 years of age: the HOME Study. Environ Health Perspect 122:856–862, doi:10.1289/ehp.1307562.
Chen J, Chan W, Wallenstein S, Berkowitz G, Wetmur JG. 2005. Haplotype-phenotype rela-tionships of paraoxonase-1. Cancer Epidemiol Biomarkers Prev 14(3):731–734.
Chen J, Kumar M, Chan W, Berkowitz G, WetmurJG. 2003. Increased influence of genetic variation on PON1 activity in neonates. Environ Health Perspect 111:1403–1409, doi:10.1289/ehp.6105. Chen L, Zhao T, Pan C, Ross JH, Krieger RI. 2012.
Preformed biomarkers including dialkylphos-phates (DAPs) in produce may confound biomoni-toring in pesticide exposure and risk assessment. J Agric Food Chem 60(36):9342–9351.
Cole SR, Hernán MA. 2008. Constructing inverse prob-ability weights for marginal structural models. Am J Epidemiol 168(6):656–664.
Costa LG, Richter RJ, Li WF, Cole T, Guizzetti M, Furlong CE. 2003. Paraoxonase (PON 1) as a biomarker of susceptibility for organophosphate toxicity. Biomarkers 8(1):1–12.
Curl CL, Fenske RA, Kissel JC, Shirai JH, Moate TF, Griffith W, et al. 2002. Evaluation of take-home organophosphorus pesticide exposure among agricultural workers and their children. Environ Health Perspect 110:A787–A792.
Desquilbet L, Mariotti F. 2010. Dose-response analyses
using restricted cubic spline functions in public health research. Stat Med 29(9):1037–1057. Deziel NC, Friesen MC, Hoppin JA, Hines CJ,
Thomas K, Freeman LE. 2015. A review of nonoc-cupational pathways for pesticide exposure in women living in agricultural areas. Environ Health Perspect 123:515–524, doi:10.1289/ehp.1408273. Engel SM, Berkowitz GS, Barr DB, Teitelbaum SL,
Siskind J, Meisel SJ, et al. 2007. Prenatal organophosphate metabolite and organochlo-rine levels and performance on the Brazelton Neonatal Behavioral Assessment Scale in a multiethnic pregnancy cohort. Am J Epidemiol 165(12):1397–1404.
Engel SM, Wetmur J, Chen J, Zhu C, Barr DB, Canfield RL, et al. 2011. Prenatal exposure to organophosphates, paraoxonase 1, and cogni-tive development in childhood. Environ Health Perspect 119:1182–1188, doi:10.1289/ehp.1003183. Eskenazi B, Harley K, Bradman A, Weltzien E,
Jewell NP, Barr DB, et al. 2004. Association of
in utero organophosphate pesticide exposure
and fetal growth and length of gestation in an agricultural population. Environ Health Perspect 112:1116–1124, doi:10.1289/ehp.6789.
Eskenazi B, Marks AR, Bradman A, Harley K, Barr DB, Johnson C, et al. 2007. Organophosphate pesti-cide exposure and neurodevelopment in young Mexican-American children. Environ Health Perspect 115:792–798, doi:10.1289/ehp.9828. Fukuto TR. 1990. Mechanism of action of
organo-phosphorus and carbamate insecticides. Environ Health Perspect 87:245–254.
Grube A, Donaldson D, Kiely T, Wu L. 2011. Pesticides Industry Sales and Usage: 2006 and 2007 Market Estimates. EPA 733-R-11-001. Washington, DC:U.S. Environmental Protection Agency.
Holland N, Furlong C, Bastaki M, Richter R, Bradman A, Huen K, et al. 2006. Paraoxonase polymorphisms, haplotypes, and enzyme activity in Latino mothers and newborns. Environ Health Perspect 114:985–991, doi:10.1289/ehp.8540.
Icenogle LM, Christopher NC, Blackwelder WP, Caldwell DP, Qiao D, Seidler FJ, et al. 2004. Behavioral alterations in adolescent and adult rats caused by a brief subtoxic exposure to chlor-pyrifos during neurulation. Neurotoxicol Teratol 26(1):95–101.
Levin ED, Addy N, Baruah A, Elias A, Christopher NC, Seidler FJ, et al. 2002. Prenatal chlorpyrifos exposure in rats causes persistent behavioral alterations. Neurotoxicol Teratol 24(6):733–741. Lu C, Bravo R, Caltabiano LM, Irish RM,
Weerasekera G, Barr DB. 2005. The presence of dialkylphosphates in fresh fruit juices: implica-tion for organophosphorus pesticide exposure and risk assessments. J Toxicol Environ Health A 68(3):209–227.
Martin JA, Hamilton BE, Osterman MJK, Curtin SC, Mathews TJ. 2015. Births: Final Data for 2013. Natl Vital Stat Rep 64(1):1–65.
Q u i r ó s - A l c a l á L , B r a d m a n A , S m i t h K , Weerasekera G, Odetokun M, Barr DB, et al. 2012. Organophosphorous pesticide breakdown products in house dust and children’s urine. J Expo Sci Environ Epidemiol 22(6):559–568. Rauch SA, Braun JM, Barr DB, Calafat AM, Khoury J,
Montesano AM, et al. 2012. Associations of
prenatal exposure to organophosphate pesti-cide metabolites with gestational age and birth weight. Environ Health Perspect 120:1055–1060, doi:10.1289/ehp.1104615.
Rauh VA, Garfinkel R, Perera FP, Andrews HF, Hoepner L, Barr DB, et al. 2006. Impact of prenatal chlorpyrifos exposure on neurodevelopment in the first 3 years of life among inner-city children. Pediatrics 118(6):e1845–e1859.
Ray DE, Richards PG. 2001. The potential for toxic effects of chronic, low-dose exposure to organo-phosphates. Toxicol Lett 120(1–3):343–351. Ricceri L, Markina N, Valanzano A, Fortuna S,
Cometa MF, Meneguz A, et al. 2003. Develop-mental exposure to chlorpyrifos alters reactivity to environmental and social cues in adolescent mice. Toxicol Appl Pharmacol 191(3):189–201.
Spaan S, Pronk A, Koch HM, Jusko TA, Jaddoe VW, Shaw PA, et al. 2015. Reliability of concentra-tions of organophosphate pesticide metabolites in serial urine specimens from pregnancy in the Generation R Study. J Expo Sci Environ Epidemiol 25(3):286–294.
Timofeeva OA, Roegge CS, Seidler FJ, Slotkin TA, Levin ED. 2008. Persistent cognitive alterations in rats after early postnatal exposure to low doses of the organophosphate pesticide, diazinon. Neurotoxicol Teratol 30(1):38–45.
U.S. EPA (U.S. Environmental Protection Agency). 2000. Chlorpyrifos. Revised Risk Assessment and Agreement with Registrants. Washington, DC:U.S. EPA, Office of Pesticide Programs.
U.S. EPA. 2001. Diazinon Revised Risk Assessment and Agreement with Registrants. Washington DC:U.S. EPA, Office of Pesticide Programs.
Vatanparast J, Naseh M, Baniasadi M, Haghdoost-Yazdi H. 2013. Developmental exposure to chlor-pyrifos and diazinon differentially affect passive avoidance performance and nitric oxide synthase-containing neurons in the basolateral complex of the amygdala. Brain Res 1494:17–27.
Westreich D, Cole SR. 2010. Invited commentary: posi-tivity in practice. Am J Epidemiol 171(6):674–677. Wetmur JG, Kumar M, Zhang L, Palomeque C,
Wallenstein S, Chen J. 2005. Molecular haplo-typing by linking emulsion PCR: analysis of para-oxonase 1 haplotypes and phenotypes. Nucleic Acids Res 33(8):2615–2619.
Whyatt RM, Camann D, Perera FP, Rauh VA, Tang D, Kinney PL, et al. 2005. Biomarkers in assessing residential insecticide exposures during preg-nancy and effects on fetal growth. Toxicol Appl Pharmacol 206(2):246–254.
Whyatt RM, Rauh V, Barr DB, Camann DE, Andrews HF, Garfinkel R, et al. 2004. Prenatal insecticide exposures and birth weight and length among an urban minority cohort. Environ Health Perspect 112:1125–1132, doi:10.1289/ehp.6641.
Yolton K, Xu Y, Sucharew H, Succop P, Altaye M, Popelar A, et al. 2013. Impact of low-level gesta-tional exposure to organophosphate pesticides on neurobehavior in early infancy: a prospective study. Environ Health 12(1):79, doi:10.1186/1476-069X-12-79. Zhang X, Driver JH, Li Y, Ross JH, Krieger RI. 2008.