Scientific workflows for bibliometrics
Arzu Tugce Guler1•Cathelijn J. F. Waaijer2•
Magnus Palmblad1
Received: 27 June 2015 / Published online: 15 February 2016
ÓThe Author(s) 2016. This article is published with open access at Springerlink.com
Abstract Scientific workflows organize the assembly of specialized software into an overall data flow and are particularly well suited for multi-step analyses using different types of software tools. They are also favorable in terms of reusability, as previously designed workflows could be made publicly available through the myExperiment com-munity and then used in other workflows. We here illustrate how scientific workflows and the Taverna workbench in particular can be used in bibliometrics. We discuss the specific capabilities of Taverna that makes this software a powerful tool in this field, such as automated data import via Web services, data extraction from XML by XPaths, and statistical analysis and visualization with R. The support of the latter is particularly rele-vant, as it allows integration of a number of recently developed R packages specifically for bibliometrics. Examples are used to illustrate the possibilities of Taverna in the fields of bibliometrics and scientometrics.
Keywords BibliometricsScientific workflowsTavernaRXMLMass spectrometryMedicinal chemistry
& Magnus Palmblad [email protected]
Arzu Tugce Guler [email protected]
Cathelijn J. F. Waaijer [email protected]
1
Center for Proteomics and Metabolomics, Leiden University Medical Center, Leiden, The Netherlands
2
Faculty of Social and Behavioural Sciences, Centre for Science and Technology Studies, Leiden University, Leiden, The Netherlands
Introduction
Information processing permeates the scientific enterprise, generating and organizing knowledge about nature and the universe. In the modern era, computational technology enables us to automate data handling, reducing the need for human labor in information processing. Often information is processed in several discrete steps, each building on previous ones and utilizing different tools. Manual orchestration is then frequently required to connect the processing steps and enable a continuous data flow. An alternative solution would be to define interfaces for the transition between processing layers. However, these interfaces then need to be designed specifically for each pair of steps, depending on the software tools they use, which compromises reusability. Whether the data flow is auto-mated or manually done by the researcher, the latter still has to deal with many detailed, low-level aspects of the execution process (Gil2009).
Scientific workflow managers connect processing units through data, control connec-tions and simplify the assembly of specialized software tools into an overall data flow. They smoothly render stepwise analysis protocols in a computational environment designed for the purpose. Moreover, the implemented protocols are reusable. Existing workflows can be shared and used by other workflows, or they can be modified to solve different problems. Several general purpose scientific workflow managers are freely available, and a few more optimized for specific scientific fields (De Bruin et al.2012). Most of these managers provide visualization tools and have a graphical user interface, e.g. KNIME (Berthold et al.2008), Galaxy (Goecks et al.2010) and Taverna (Oinn et al.2004). Not surprisingly, scientific workflows are now becoming increasingly popular in data intensive fields such as astronomy and biology.
In this paper, which builds on a recent ISSI conference paper (Guler et al. 2015), we describe the use of scientific workflows in bibliometrics using the Taverna Workbench. Taverna Workbench is an open source scientific workflow manager, created by the myGrid project (Stevens et al.2003), and is now being used in different fields of science. Taverna provides integration of many types of components such as communication with Web services (WSDL, SOAP etc.), data import and extraction (XPath for XML, spreadsheet import from tabular data), and data processing with Java-like Beanshell scripts or the statistical language R (Wolstencroft et al.2013). Beanshell services allow the user to either program a small utility from scratch and towards a specific goal, or to integrate already existing software into the workflow. The R support is a particularly powerful feature of Taverna. Although R was initially developed as a language for statistical analysis, its widespread use has seen it adopted for many tasks not originally envisioned—a fate not unlike its commercial cousin, MATLAB. One such task is text mining. The R package ‘‘tm’’ (Feinerer et al. 2008) provides basic text mining functionality and is used by a rapidly growing number of higher-level packages, such as ‘‘RTextTools’’ (Jurka et al.
A simple example: comparing two authors
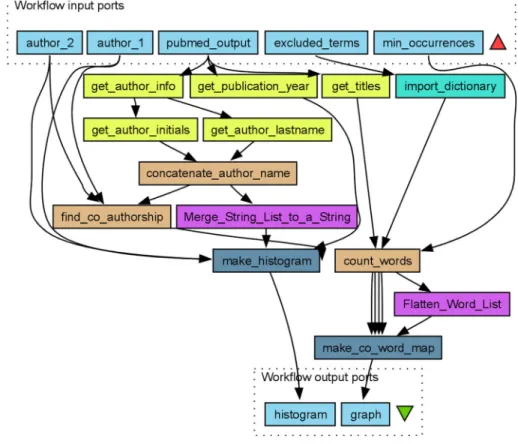
We designed a simple workflow,Compare_two_authors(Fig.1), to generate a histogram for the number of publications over time and a co-word map for the titles of the two authors’ publications. The workflow takes as inputs PubMed results in XML, the names of two authors, a list of excluded words and a minimum number of occurrences.
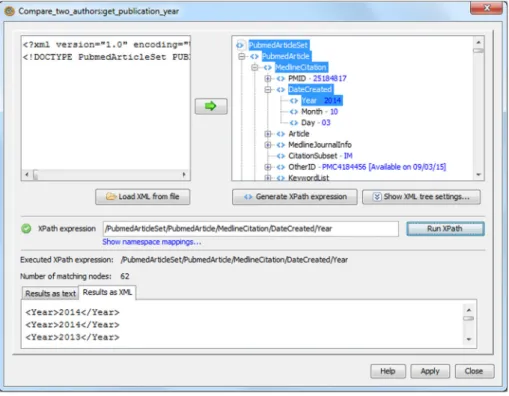
The PubMed results are retrieved in an XML format, and the extraction of publication years, titles and author names are done byXPathservices. XPath is a query language for selecting elements and attributes in an XML document. The XPath service in Taverna eases this process by providing a configuration pane to render an XML file of interest as a tree and automatically generate an XPath expression as the user selects a specific fragment
Fig. 1 A workflowCompare_two_authorsdesigned in Taverna for comparing the scientific output over time and word usages of two researchers (authors). Taverna usescolorto indicate the type of service or tool. Although not performing a particularly sophisticated bibliometric analysis, this workflow demonstrates the use of Beanshells (burly wood brown), local services (heliotrope violet), spreadsheet import (turquoise), XPaths (laser lemon yellow) and Rshells (air force blue). The inputs (sky blue) are some PubMed results in XML, the names of two authors, a dictionary of excluded terms and the minimum number of occurrences. Each execution of the workflow creates two outputs: a histogram of the publications in each year for the two authors and a co-word map comparing their research topics. Common words can be excluded for clarity. The
import_dictionaryspreadsheet import service is used to read a text file with one word per line containing
from the XML (Fig.2). The results of the query can either be passed as text or as XML to other workflow components.
The data extracted by the spreadsheet import and XPath services is fed to a series of Beanshell components that find co-authorships and count co-occurrence of words in the extracted titles. Beanshell is a light-weight scripting language that interprets Java. In our workflow, the Beanshell services do simple operations on strings, such as concatenation of surnames and initials that are extracted separately using XPath ( concatenate_author_-names), matching strings to find co-authorships (find_co_authorship) and counting the number of words occurring in each title authored by one or both authors (count_words). The two authors’ usage of the words, excluding excluded_terms, that appear at least
min_occurrencestimes in total, are then used to draw a co-word map using the ‘‘igraph’’ R package (Csa´rdi and Nepusz2006). Excluded terms may be very common, non-informa-tive words like articles and prepositions that would not carry any meaning in a co-word map. It is generally up to the workflow designer what part of the workflow to code in Java (Beanshell), in R, or in third language called via theToolcommand-line interface. More types are available for data connectors between R components (logical, numeric, integer, string, R-expression, text file and vectors of the first four types) than between Beanshell components, where everything is passed as strings. Therefore, when dealing with purely numerical data, we recommend R over Beanshells within Taverna.
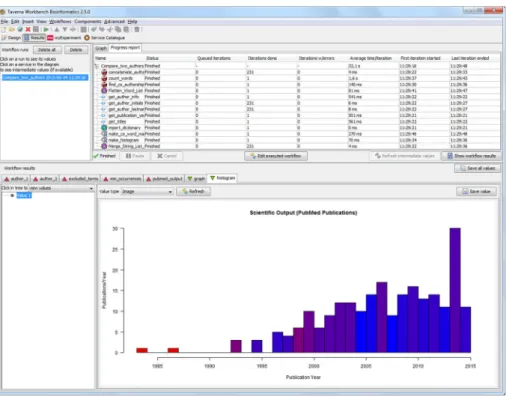
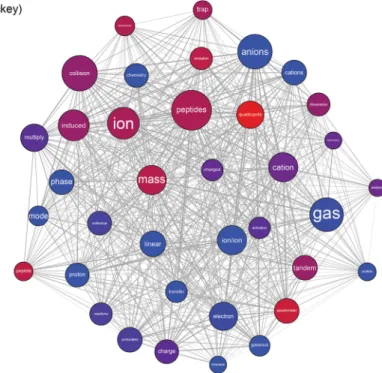
After all the necessary inputs are provided, the workflow is ready to be executed. In the Taverna Workbench Results perspective (Fig.3), each completed process is grayed out to show the progress of the workflow run. The execution times, errors and results are also visible in this perspective. We ran the workflow for two scientists active in our own field of mass spectrometry: Gary L. Glish and Scott A. McLuckey, whom we knew to have worked on similar topics over a long period of time and also co-authored a number of articles. However, the workflow will work on any two authors with publications indexed by PubMed. The co-word map in Fig.4visualizes the co-occurrence of words in titles by the location and thickness of the connecting edge, while the relative frequency of usage by the two authors is indicated by color (here from red to blue). This is an example meant to illustrate the capabilities of scientific workflows, not to show a difficult or even particularly interesting bibliometric analysis, although we were surprised to see how strongly indi-vidual language preferences appear in this maps, even for two researchers who have a long history of collaboration. For example, one researcher (Glish) may have a strong preference to specify that a ‘‘quadrupole ion trap’’ was used in an experiment whereas another (McLuckey) may refer to the same apparatus as simply an ‘‘ion trap’’.
Citation analysis
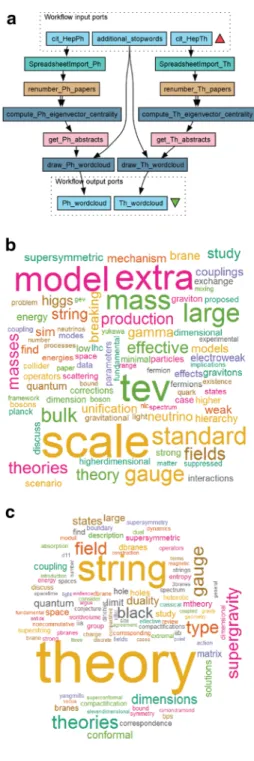
As a second example, we will use a Taverna workflow to analyse citation networks. Citation networks are widely used in bibliometrics to study patterns of who-cites-whom and to study associations between academic groups or areas of research. To simplify the example, we will start from existing networks and compare the citation networks cit-HepPh and cit-HepTh (Leskovec et al.2005), which show the citation relations between all papers published in the e-print archive arXivbetween January 1993 and April 2003 on high-energy physics phenomenology HepPh) and high-energy physics theory (cit-HepTh). Specifically, we compare the eigenvector centrality of the papers in both net-works. The eigenvector centrality is a measure of the importance of a node in the network and depends on the centrality of the nodes it is linked to (Bonacich2007). The workflow (Fig.5a) takes as input the citation graphs as edgelist files, as available from the Stanford Large Network Dataset Collection (https://snap.stanford.edu/data/). SpreadsheetImport services are used to read the edgelist tables, skipping the first four header lines of each. The arXiv paper identifiers are renumbered consecutively, starting from zero, for improved compatibility with igraph. The indispensable components in the workflow are the Rshells compute_eigenvector_centrality, which calculate the eigenvector centrality using the igraph evcent() function. In this instance, directionality is ignored by specifying
‘directed=FALSE’. The output of the Rshells are the original arXiv paper identifiers for the N papers with the highest eigenvector centrality in each network. Beanshell compo-nents are then used to create a query and fetch the abstract page of these papers directly from arXiv using the Taverna Get_Web_Page_from_URL service. Embedded in the
abstract extraction services are also XPath components that extract the abstract texts from the HTML files. The corpora are then passed to a pair of Rshells for drawing wordclouds on common words in these two extreme sets of abstracts using the tm and wordcloud R packages. The output of the workflow shows the word clouds for theN=100 most central papers in the cit-HepPh (Fig.5b) and cit-HepTh (Fig.5c) citation networks. The phe-nomenology word cloud includes physical units, such as TeV, and experimental facilities such as the LHC particle accelerator. The theory word cloud, perhaps unsurprisingly, is dominated by ‘‘string’’, ‘‘theory’’, and the related terms ‘‘M-theory’’, ‘‘supersymmetry’’, ‘‘elevendimensional’’, and so on. Using citation analysis and comparing measures of centrality in two citation networks distills the essential difference between two closely related fields—here two aspects of high-energy physics. Units of measurements have previously been shown to have the weakest co-occurrence coupling with terms such as ‘‘theory’’, ‘‘model’’ and ‘‘simulation’’ in the field of analytical chemistry (Palmblad and Waaijer2015).
Connecting to Web Services and external databases
As shown in the example above, Taverna workbench can automatically analyze or generate networks directly from online data. Taverna can also invoke Web Services Description Language (WSDL) style Web services given the URL of the service’s WSDL document. The WSDL is an XML-based interface description language often used together with a Simple Object Access protocol (SOAP) to access the functions and parameters of a service. Many bibliographic resources are available through Web services, such as Web of Science (WoS) or PubMed Central (PMC). Some services, including the WoS, require authenti-cation. An entire bibliometric study can be contained inside a single Taverna workflow that authenticates the user, if needed, takes the user queries, or questions of the study, generates the Web service requests, executes these, retrieves the data and proceeds with further (local) statistical analysis and visualization.
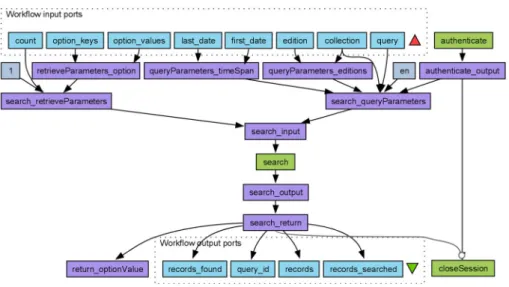
A Taverna workflow that invokes WSDL services from WoS to automatically execute a query may look like in Fig.6. This Taverna workflow takes as input common search parameters and a generic WoS query string, and pass these to the Web service via the WoS WSDL interface. Values that have only one possible value, such as the language (English, ‘‘en’’) are here hard-coded in the workflow asText constants. A workflow that connects to the EBI Europe PubMed Central (PMC) SOAP Web service and maps the author affilia-tions article by article, ordered by publication year, is part of the workflow shown in Fig.7
below. The output of the entire workflow is a world map showing the geographic trends collaborative patterns of an individual researcher (more on this below). The workflow can easily be adapted to show geographic trends in research topics, publications in a particular journal etc. All that needs to be modified are the PMC search query and the XPaths, and this can be done in a few mouse clicks without typing any code.
Geographic analysis of publications
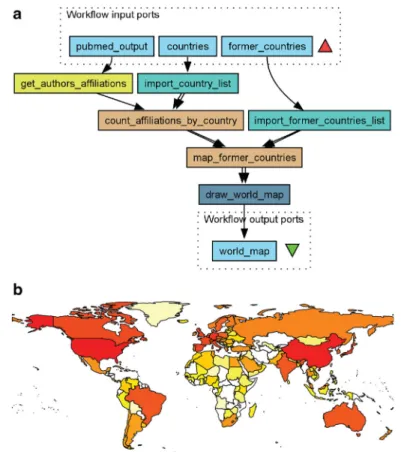
3166-3) to their successor states. This process works relatively well for publications later than ca. 1949, after we provided the workflow with a table linking former countries with their contemporary counterparts. The latter will obviously never be a perfect process, and some arbitrariness is unavoidable. For example, should research output from the former USSR be shared equally (on the map) between all fifteen independent states that emerged after the dissolution of the Soviet Union, or exclusively to the Russian Federation? Should it depend on where the authors were located at the time? Some borders, such as that between the former West and East Germany, have disappeared from the map in rworld-map. However, for visualization of research activity in the past two decades, rworldmap does the job well. rworldmap also allows some control of granularity and what area of the globe to plot. For example, Antarctica and small islands can be omitted without appre-ciable loss of accuracy. There are currently no human inhabitants on the Bikar Atoll in the Pacific, let alone research institutes.
The workflow in Fig.8a takes a PubMed XML, extracts all author affiliations and maps these to present-day countries in ISO 3166-1, tallies the publications and maps the total number per country onto a current map of the world. This workflow is also available on myExperiment (Goble et al. 2010, http://myexperiment.org/workflows/4648.html). The results from running this workflow on the topic defined as all articles matching ‘‘mass spectrometry’’ in their title or abstract published between 2010 and 2015 is shown in Fig.8b. As an alternative to starting from a PubMed XML file, we can connect the output from the PMC Web service as input toCompare_pubmed_results_geographically(Fig.7). This combined workflow is also available on myExperiment. In addition to producing static maps, it is also possible to export a series of author affiliation maps as a movie using the ‘‘animation’’ R package.
Journals covering in the same scientific field may have regional bias, with for example researchers based in the US preferentially publishing in an American journal and European researchers preferring a European journal. To investigate whether there is such a bias in the
field of medicinal chemistry, we looked specifically at theJournal of Medicinal Chemistry
(published by the American Chemical Society) and the European Journal of Medicinal
Chemistry. To this end we assembled the workflow shown in Fig.9a. This workflow
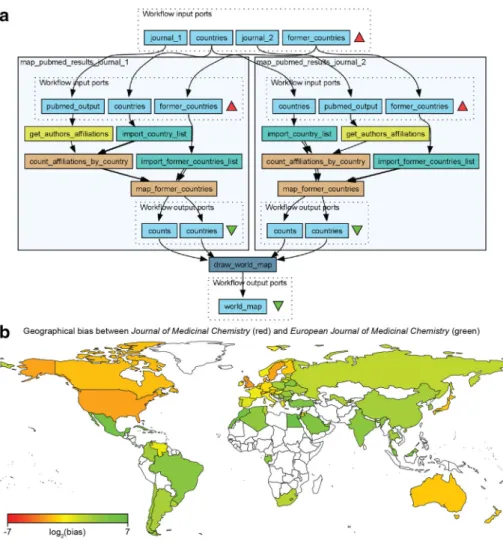
analyzes the geographical bias in author affiliation between any two journals, not just the two investigated here. The output is again a map generated by rworldmap, this time with a color gradient representing the relative number of publications in the two journals for each country (Fig.9b). It is clear from this analysis that authors from many Western European countries have a preference for the American journal. This may have something to do with this journal having a higher journal impact factor (as measured by the Thomson Reuters journal impact factor) and consequently being considered more prestigious in the field. On the other hand, other Western European countries such as France and Italy do not show this preference. This may be explained by the fact that a sizeable share of the editorial board is comprised of researchers working in France or Italy.
Discussion and conclusions
The use of scientific workflows in bibliometrics is still in its infancy. The direct support of R inside Taverna workflows is particularly useful for bibliometrics and scientometrics. A number of R packages for bibliometric analysis have recently been released, ranging from simple data parsers such as the ‘‘bibtex’’ package (Francois2014) for reading BibTeX files to libraries or collections of functions for scientometrics, such as the CITAN package
Fig. 9 a A workflow Compare_two_journals_geographically reusing the embedded map_affiliations workflow matching author affiliations with countries in Fig.6for analyzing geographical bias in two medicinal chemistry journals: the American Chemical Society (ACS)-published Journal of Medicinal
Chemistryand theEuropean Journal of Medicinal Chemistrybetween 2000 and 2015.bThe results of the
(Gagolewski 2011). The latter package contains tools to pre-process data from several sources, including Elsevier’s Scopus, and a range of methods for advanced statistical analysis. The igraph package itself comes with some functions specifically for bibliometric analysis, e.g. ‘‘cocitation’’ and ‘‘bibcoupling’’. Clustering or rearranging the graph spatially so that strongly connected words appear closer together is possible with igraph, but may also be assisted by other packages. We opted for showing a few simple but more or less representative examples here. Much more complex analyses can be designed based on or using the workflows and components here as a starting point. We did not include any advanced text mining functionality for homonym disambiguation or natural language processing. The ‘‘openNLP’’ R package currently in development provides an interface to openNLP (Hornik2014) and may be used to extract noun phrases and refine the analyses. In the examples here, we could show that individual language preferences can dominate when comparing two authors working in the same field. We could also show that the geographical bias between two medicinal chemistry journals, one European and one published by the American Chemical Society, probably has more to do with impact factor and perceived prestige than author location, based on the observation that researchers from the European countries usually ranking high in international research surveys, i.e. Den-mark, the Netherlands, Sweden, Switzerland and the United Kingdom, also have the strongest preference for publishing in the higher-impact factor American journal. To the extent that such rankings are based on impact factors, this is of course in part a circular argument. We also observe that European countries well represented on the editorial board of the European journal, e.g. France and Italy, show no preference for the American journal. This is probably not a coincidence.
Scientific workflow managers are powerful tools for managing bibliometric analyses, allowing complete integration of online databases, Web services, XML parsers, statistical analysis and visualization. Workflow managers such as Taverna eliminate manual steps in analysis pipelines and provide reusability and repeatability of bibliometrics analyses. All workflows for bibliometrics and scientometrics presented here can be found in the myExperiment group for Bibliometrics and Scientometrics (http://myexperiment.org/
groups/1278.html).
Acknowledgments The authors would like to thank Thomson Reuters for granting access to the Web of Science Web services lite and Dr. Yassene Mohammed (LUMC) for technical assistance with Taverna workbench.
Open Access This article is distributed under the terms of the Creative Commons Attribution 4.0 Inter-national License (http://creativecommons.org/licenses/by/4.0/), which permits unrestricted use, distribution, and reproduction in any medium, provided you give appropriate credit to the original author(s) and the source, provide a link to the Creative Commons license, and indicate if changes were made.
References
Berthold, M. R., Cebron, N., Dill, F., Gabriel, T. R., Ko¨tter, T., Meinl, T. et al. (2008). KNIME: The Konstanz information miner. In C. Preisach, H. Burkhardt, L. Schmidt-Thieme & R. Decker (Eds.), Data analysis, machine learning and applications: Proceedings of the 31st Annual Conference of the
Gesellschaft fu¨r Klassifikation e.V., Albert-Ludwigs-Universita¨t Freiburg, 7–9 March 2007 (pp.
319–326). Berlin: Springer.
Bonacich, P. (2007). Some unique properties of eigenvector centrality.Social Networks, 29(4), 555–564. Csa´rdi, G., & Nepusz, T. (2006). The igraph software package for complex network research.InterJournal
De Bruin, J. S., Deelder, A. M., & Palmblad, M. (2012). Scientific workflow management in proteomics.
Molecular and Cellular Proteomics. doi:10.1074/mcp.M111.010595.
Feinerer, I., Hornik, K., & Meyer, D. (2008). Text mining infrastructure in R.Journal of Statistical
Soft-ware, 25(5), 1–54.
Fellows, I. (2013). wordcloud: Word Clouds. R package version 2.4. Retrieved from, http://CRAN.R-project.org/package=wordcloud.
Francois, R. (2014). bibtex: bibtex parser. R package version 0.4.0. Retrieved from.http://CRAN.R-project. org/package=bibtex.
Gagolewski, M. (2011). Bibliometric impact assessment with R and the CITAN package. Journal of
Informetrics, 5(4), 678–692.
Gil, Y. (2009). From data to knowledge to discoveries: Artificial intelligence and scientific workflows.
Scientific Programming, 17, 231–246.
Goble, C. A., Bhagat, J., Aleksejevs, S., Cruickshank, D., Michaelides, D., Newman, D., et al. (2010). myExperiment: A repository and social network for the sharing of bioinformatics workflows.Nucleic
Acids Research, 38, 677–682.
Goecks, J., Nekrutenko, A., & Taylor, J. (2010). Galaxy: A comprehensive approach for supporting accessible, reproducible, and transparent computational research in the life sciences.Genome Biology, 11, R86.
Gru¨n, B., & Hornik, K. (2011). topicmodels: An R package for fitting topic models.Journal of Statistical
Software, 40, 1–30.
Guler, A. T., Waaijer, C. J. F., & Palmblad, M. (2015). Scientific workflows for bibliometrics. In A. A. Salah, Y. Tonta, A. A. Akdag Salah, C. Sugimoto, & U. Al (Eds.),Proceedings of ISSI 2015 Istanbul: 15th International Society of Scientometrics and Informetrics Conference, Istanbul, Turkey,
June 29–July 3, 2015(pp. 1029–1034). Bogazic¸i University Printhouse.
Hornik, K. (2014). openNLP: Apache OpenNLP Tools Interface. R package version 0.2-3. Retrieved from,
http://CRAN.R-project.org/package=openNLP.
Jurka, T. P., Collingwood, L., Boydstun, A. E., Grossman, E., & van Atteveldt, W. (2014). RTextTools: Automatic text classification via supervised learning. R package version 1.4.2. Retrieved from,http:// CRAN.R-project.org/package=RTextTools.
Leskovec, J., Kleinberg, J., & Faloutsos, C. (2005). Graphs over time: Densification laws, shrinking diameters and possible explanations. In ACM SIGKDD International Conference on Knowledge
Discovery and Data Mining (KDD), August 21–24, 2005, Chicago, Illinois, USA.
Oinn, T., Addis, M., Ferris, J., Marvin, D., Senger, M., Greenwood, M., et al. (2004). Taverna: A tool for the composition and enactment of bioinformatics workflows.Bioinformatics, 20(17), 3045–3054. Palmblad, M., & Waaijer, C. J. F. (2015). Bibliometric mapping: Eight decades of analytical chemistry, with
special focus on the use of mass spectrometry.Analytical Chemistry, 87(9), 4588–4596. South, A. (2011). rworldmap: A new R package for mapping global data.The R Journal, 3(1), 35–43. Stevens, R. D., Robinson, A. J., & Goble, C. A. (2003). myGrid: Personalised bioinformatics on the
information grid.Bioinformatics, 19(Suppl. 1), i302–i304.