TEETH DEHYDRATION/ REHYDRATION AND THE EFFECT OF TIME ON TOOTH SHADE SELECTION
Sama A. Suliman
A thesis submitted to the Faculty of The University of North Carolina at Chapel Hill in partial fulfillment of the requirements for the degree of Master of Science in the Department of Restorative Sciences of the School of Dentistry at the Division of Operative Dentistry and
Biomaterials
Chapel Hill 2019
Approved by:
Alex Delgado
Taiseer Sulaiman
Vilhelm Olafsson
Terence E. Donovan
ABSTRACT
Sama A. Suliman: Teeth Dehydration/Rehydration and the effect of time on tooth shade selection
(Under the direction of Harald H. Heymann)
Objective: The purpose of this clinical study is to estimate the time required for teeth to
dehydrate and rehydrate and its relation to the accuracy of tooth shade selection.
Materials and Methods: Thirty-two participants were recruited, and color measurements
were conducted using a spectrophotometer placed with a custom jig. Measurements were made at
baseline, and then after isolation using a lip retractor at 1, 2, 3, 5, 7, 10 and 15 minute intervals to
determine tooth dehydration time. After mouth rinsing for 5 minutes measurements were again
made at the same interval time to determine tooth rehydration time. The values obtained were used
to calculate CIEDE2000 values for color change between the baseline recordings and all intervals.
The data were compared to the 50:50% perceptibility and acceptability thresholds and analyzed
for the color change over time using ANOVA and Tukey test was used for multiple comparisons.
Result: There was a perceivable change in tooth color within the first minute of tooth
dehydration (P>0.0001). After the first minute, 87% of the teeth were beyond the ∆E00
perceptibility threshold (0.8), and 72% of the teeth were beyond the ∆E00 acceptability threshold
(1.8). After 15 minutes of rehydration, 90% of the teeth were beyond the perceptibility threshold,
and 65% were beyond the acceptability threshold. The original shade was not restored for the
tested teeth even after 15 minutes of rehydration time. Conclusions: Shade selection procedures
should be carried out within the first minute and before the teeth are exposed to dehydration by
“In the name of God, the Most Gracious, the Most Merciful”
To my parents, the reason why I am who I am
ACKNOWLEDGEMENTS
I thank GOD for blessing me with health, knowledge, determination and support of the
people around me to accomplish my goals.
I would like to express my profound gratitude to my mentor and supervisor Dr. Harald H.
Heymann, and my thesis committee members, Drs. Ryan Cook, Terry Donovan, Vilhelm Olafsson,
Alex Delgado, and Taiseer Sulaiman. Your guidance and help throughout this project has been
invaluable.
I would also like to thank Mr. Brandon Rogers, Dr. Tarek Alsahafi, and Ms. Safa Aldali
for all of the help and support they genuinely offered in the laboratory. Without their help this
project would have been impossible. Dr. Ceib Phillips and Dr. William Johnston deserve
exceptional gratitude for their extensive help with the statistical analysis of my data.
I thank all the faculty and staff of the Division of Operative Dentistry, It has been an honor
and a privilege to be part of the UNC Operative Dentistry Family. Special thanks to Mrs. Shannon
Tate, Mrs. Melissa Bennett, Mrs. Barbara Walton, Mrs. Kimberly Stoen and Mr. Jose Negron for
all your devotion and commitment. I would like to thank all of my co-residents in the Graduate
Operative Program for making this an awesome journey in bitter and sweet. Drs. Eduard Epure,
Mohammad Atieh, Carolina Nguyen Ngoc, Leslie Trippe, Elizabeth Griffis, Savita Gupta, Bassam
Alrawi, Gustavo Mahn, Art Valeri, Zaid Badr, Karina Irusa, Islam Abd Raheem and Basheer
Alsayed. You have given me wonderful memories, thank you all!
endless support, love, care, prayers and sacrifice. I would not be who I am without you two, the
greatest parents of all time. Special thanks to my brother, co-resident, and best friend Dr. Awab.
Awab I love you more than anything, and I can’t imagine doing master without you. I thank my
brother Drs. Taiseer and Aous for being always there and setting such a wonderful example of how
successful people are. I am blessed and thankful to have such wonderful three brothers, you guys
are everything in my life. Special thanks to my sister in law Israa Mohamed for her support, love,
TABLE OF CONTENTS
LIST OF TABLES ... ix
LIST OF FIGURES ... .….x
LIST OF ABREVIATIONS AND SYMBOLS ... xi
CHATER 1: REVIEW OF THE LITERATURE ... 1
1. Introduction ... 1
2. Literature review ... 3
2.1. History of the Color in Dentistry ... 3
2.2. Tooth Dehdration/ Rehdration Process ... 12
REFERENCES ... 16
CHAPTER 2: MANUSCRIPT ... 19
1. Introduction ... 19
2. Materials And Methods ... 22
2.1. Participant Selection: ... 22
2.2.Instrument Used: ... 23
2.3. Jig Preparation: ... 23
2.4. Color Measurments: ... 24
3. Results ... 26
4. Discussion ... 30
LIST OF TABLES
Table 2.1: Mean and Standard deviation of ∆E of dehydration...26
LIST OF FIGURES
Figure 1.1: Munsell Color System………..……….….….…..3
Figure 1.2: The Vita Easyshade Spectrophotometer………..….………..….…..9
Figure 2.1: The Vita Easyshade Spectrophotometer………..………….…….….…….…23
Figure 2.2: Custom Made Jig with Puncher………...24
Figure 2.3: Custom Made Jig with Spectrophotometer..……...24
Figure 2.4: Positioning a Custom Made Jig with an Access Opening in the Middle Third of the Tested Tooth that allowed Color Measurements with the Vita Easyshade...25
Figure 2.5: Changes in the (∆E) of Dehydration and Rehydration….………... 27
Figure 2.6: Mean Changes in L. ………... 28
Figure 2.7: Mean changes in C...…... 28
Figure 2.8: Mean Changes in H………..….…. 29
Figure 2.9: Percentage of Participants with Perceivable Color Changes during Dehydration and Rehydration..………. ………...…… 29
LIST OF ABREVIATIONS AND SYMBOLS
∆E Color differences
°C Degree of celsius
°K Kelvin
a* Red-green chromaticity
ANOVA Analysis of variance
b* Yellow-blue chromaticity
C* Chroma
CI Confidence interval
CIE Commission International de l’Eclairage
CIELAB Color system
CRI Color rendering index
H* Hue
IRB Institutional Review Boards
L* Lightness
LED Light-emitting diode
ml Millimeter
RI Refractive Index
S.D. Standard deviation
TG Toothguide 3D-Master
CHAPTER 1: REVIEW OF THE LITERATURE 1. Introduction
Tooth shade matching has proven to be a challenging task for the dental profession. The
problem of color in dentistry was addressed a long time ago by Clark and he stated that “we as
dentists are not educationally equipped to approach a color problem”.
Despite numerous advances in shade matching techniques in recent decades, based on current
prospective and retrospective clinical studies, 50% of cemented ceramic crowns exhibit incorrect
color matches.
Shade matching is a complex process where color determination, color communication and
color reproduction all have to be successfully carried out. While all of these steps are equally
important, chances of an esthetically pleasing color match become slim if the first step, color
determination, is improperly performed. Tooth color can be determined by either a visual method
or an instrumental method. The visual method is the most common and popular method used for
the shade determination in the clinical practice, and is accomplished by matching the shade guide
tabs to the natural tooth. Instrumental methods, use devices such as spectrophotometers,
colorimeters and digital imaging to assess shade matching.
When color is measured, Delta E (∆E) is usually identified. Delta E is the color difference,
or the distance separating two points of color in the CIELAB system. When the color difference
between two compared objects can be seen by 50% of the observers, it is a 50:50% perceptibility
threshold. Similarly, a 50:50% acceptability threshold has been defined when a color difference is
concluded that the CIELAB 50:50% perceptibility threshold was observed when ∆E= 0.8, whereas
the 50:50% acceptability threshold was ∆E= 1.8, under simulated clinical settings.
Color determination is an interplay where color perception and matching abilities need to
meet under optimal conditions. Color perception occurs when light from a particular source is
reflected by the object observed to the viewer. Hence, color perception is influenced by a triad of
events which are: the light source, the optical properties of the object observed, the color matching
ability of the observer, and the hydration state of the tooth itself.
Tooth dehydration makes teeth appear whiter due to increasing enamel opacity. The
inter-prismatic spaces become filled with air instead of water so light can no longer be conducted from
crystal to crystal. Loss of translucency due to dehydration, therefore, causes more reflection, which
masks the underlying color of dentin, making the tooth appear lighter. Most of the dental
procedures that are used in dental practice result in some dehydration of teeth. It is advised that
shade selection of teeth involving restorative procedures be done at the beginning of the
appointment, but little objective research exists to document this phenomenon in the dental
literature. Thus, little is known in the literature about the dehydration/rehydration processes of the
teeth and their relationship to the accuracy of the shade selection procedure. Therefore, the aim of
this study was to estimate the time required for the teeth to dehydrate/ rehydrate and effect that
2. Literature review
2.1. History of the Color in Dentistry
Tooth shade matching has proven to be a challenging task for the dental profession, and
patients’ expectations for esthetic restorations are justifiably high. Therefore accurate shade
assessment is vital to generating consistently successful results. Despite numerous advances in
shade matching techniques, prospective and retrospective clinical studies have documented high
incidences of color incorrect matching with esthetic restorations.1-5
Color was presented in 1611 as a three dimensional entity by Sigfried Forsius.1, 7
Since that time, there have been numerous systems invented and used to explain this tridimensional
property. One of the color systems used worldwide with simplicity and flexibility is the Munsell
Color Order System, which is the system of choice for color matching in dentistry. Clark6 in 1931,
was the first one that addressed the problem of color matching between natural teeth and
restoration materials and was the first attempt to organize dental colors based on Munsell color
systems (Figure 1.1).
The Munsell color system can be likened to a sphere or to a cylinder. 8, 9 In the cylinder,
there are three dimensions of the color (Hue, Chroma, and Value). The dimension of Hue is the
first dimension, the easiest to understand. In Munsell’s words10, “it is that quality by which we
distinguish one color family from another, as red from yellow, green from blue or purple.” The
Hue is represented by the ten colors arranged around the central axis. Chroma, “is the departure of
a color sensation from that of white or gray; the intensity or saturation of a distinctive Hue; color
intensity.” Chroma describes the intensity of Hue in a color. In this diagram, Chroma is related to
the spokes of the wheels; the colors are purest at the periphery and become progressively grayer
as they approach the central achromatic Value axis. 10
Value is that quality by which we distinguish a light color from a dark color. This
characteristic is related to the achromatic (colorless) polar axis going through the Munsell color
element. The nine Value levels are represented by the nine wheels in this system.10
Additionally, the Commission International de l’Eclairage (CIE, 1931) published the
standards for color matching, but the absence of valid scientific evidence for color measurement
did not allow significant improvements. In 1978 the CIE developed a new system three
dimensional color system called CIE L*a*b* color space. The three coordinates that determine
color in this nearly uniform space are the L* value (y-axis), which represents lightness, the a*
value, which represents red-green chromaticity and the b* value which represents yellow-blue
chromaticity.13This system is the basis for transforming spectral energy data into meaningful color
data, and calculate the difference between two colors using a formula that generates one number
as a value for color differences which is called Delta E (∆E) value.10
Delta E (∆E) is the color difference, or the distance separating two points of color in the CIELAB
As noted earlier, when the color difference between two compared objects can be seen by
50% of the observers, it is a 50:50% perceptibility threshold. Similarly, a 50:50% acceptability
threshold has been defined when a color difference is considered acceptable by 50% of the
observers. A prospective multicenter study by Paravina et al, concluded that the CIELAB 50:50%
perceptibility threshold was ∆Eab=1.2, whereas the 50:50% acceptability threshold was ∆Eab=2.7,
under simulated clinical settings.12
Shade matching is a complex process where color determination, color communication and
color reproduction all must be successfully carried out. As noted earlier, color determination in
dentistry can be performed by two methods, either using a visual method or an instrumental
method. The visual method is the most frequently used in dental practice by comparing a tooth’s
color to that of a shade guide. The first systematic shade guide was created by Clark based on
visual assessment of human teeth, recorded in Munsell Hue, Value and Chroma, and it consisted
of 60 ceramic tabs.13 Over the years, many shade assessment products appeared on the market.
However, the shade matching guide that became very popular was the Vitapan Classical, (VC,
Vita Zahnfabrik, Bad Sakingen, Germnay) introduced in the mid-1950s.
The Vitapan classical shade guide consists of 16 tabs arranged into four groups based on Hue and
within the groups according to increasing Chroma (also known as A, B, C, D arrangement).
However there the history of complaints, primarily related to color range, distribution and
user-friendliness has been significant.
Another shade guide that was developed is the Ivoclar- Vivadent Chromascop. The
chromascop is arranged into five groups of four tabs based on hue (1= white, 2= light yellow, 3=
dark yellow, 4= grey, 5= brown) and then further intragroup selections are made according to
digit numbering system. Hence, the tabs marked with group number (100 to 500), the lower the
number, the less chromatic and lighter the tab in the respective group.
In late 1990s, there was a breakthrough in dental shade guides when the Toothguide
3D-Master (TG, Vita Zahnfabrik, Bad Sa¨ckingen, Germany) was introduced. As compared to the
Vitapan classical version, it was found that the Toothguide matches natural teeth better, includes
wider color range and has more uniform color distribution.14
This Product has improved the conventional shade matching by removing some of the
subjectivity from shade tab based color determination. This system used six different levels of
Values to create six groups of tabs, from 0 (the lightest) to 5 (the darkest). There are 3 Chroma
levels, from 1 (the least chromatic) to 3 (the most chromatic) in each group (except in group 1 that
has two chroma levels). Intermediate chroma levels (1.5 and 2.5) in groups 2, 3 and 4 are associated
with hue variations – L (less red) and R (more red). In spite of these advantages, some dental
professionals have difficulty in understanding the shade matching method and implementation of
the Value chroma- hue concept. In addition, some users find a shade guide with 29 tabs is
confusing.
A newer version of Toothguide, called the Linearguide 3D Master is a modification of the
previous Toothguide. Linearguide contains exactly the same shade tabs, but shade matching is
simplified and reduced to two steps. First, value selection (A dark-gray holder), containing only 6
middle tabs (0M2 to 5M2) is used. The small number of tabs with large color differences and the
linear tab arrangement simplify group selection. Second, Chroma and Hue selection occur. A final
selection based on Chroma and hue is made from the initial value group selected. Values from
(0-5) in close approximation to each other and all on the same plane, allowing for quick and accurate
Chroma. This guide was found to generate more accurate shade matching results and is superior
in a subjective evaluation compared to the Toothguide.14
There are a lot of interfaces which limit the use of shade guide systems and diminish the
ability of a dentist to provide predictable color matching. Some of these limitations include the
facts that, (1) shade guides are not constructed to exactly match natural teeth; (2) shade guides do
not match other shade guides; (3) and there is inadequate control of the different batches of shade
guides even from the same manufacturer.15
In order to minimize the high incidence of color mismatch when using a visual method, new
instrumental methods for color determination were developed. There have been many electronic
instruments available for shade determination using such technologies as: colorimetry,
spectrophotometry and spectroradiometry.16
Colorimeters are relatively simple and low cost instruments. They measure the intensity of red,
green, and blue light reflected from the object/tooth by using a filter. This technology is sometimes
referred to as tristimulus value assessment. Colorimeters are not registering spectral reflectance,
and can be less accurate than spectrophotometers. Moreover, aging of the filters used in
colorimeters additionally can adversely affect accuracy.17
The spectrophotometer is a more complex instrument, and is the most accurate, useful and
flexible instrument for color matching in dentistry. It measures and records the amount of visible
radiant energy reflected or transmitted by an object/tooth one wavelength at a time for each Value,
Chroma, and Hue, generating considerable amounts of data. The data obtained from
spectrophotometers must be manipulated and translated into a form useful for dental
The spectroradiometer is also used as an alternative color measuring instrument. The
spectroradiometer was used not only for measuring the color of teeth, but also was used to
determine the color of the shade guide tabs, and the translucency of various ceramics. It measures
the spectral energy of a source. Spectrophotometer and spectroradiometer are reliable, and accurate
instruments used for color matching. There is similarity between spectrophotometer and
spectroradiometer measurements. A comparative study of spectrophotometer and
spectroradiometer measurements in terms of translucency parameter of different restorative
materials showed similar results which are highly correlated.19,20
In spite of the first spectrophotometers being accurate, they were very complex
instruments, bulkier, difficult to use and expensive. Recent advances in these electronic devices
have resulted in cordless, small, portable, cost efficient, battery operated, contact-type
spectrophotometers that provide enough shade information to help aid in the color analysis
process.
The Vita Easyshade (Vita Zahnfabrik, Bad Sa¨ckingen, Germany) is one of the latest
spectrophotometers available for clinical use that provides enough shade information to help aid
in the color determination. It consists of two different sets of LEDs lights that measures the amount
and spectral composition of light reflected from the tooth. The Vita Easyshade is the most accurate,
fast and reliable device for shade determination of natural teeth and ceramic restorations. The
results are highly correlated with standard shade systems VITA classical A1-D4, VITA
Figure 1.2: The Vita Easyshade Spectrophotometer.
Different measurement modes are possible with Vita Easyshade device: tooth single mode,
tooth area mode (cervical, middle and incisal shades), restoration color verification (includes
Lightness, Chroma and Hue comparisons) and shade tab mode (practice/training mode). It
quantifies color by using the CIE L*a*b* system, and provides the difference in color Delta E
(∆E).
Color determination is an interplay where color perception and matching abilities need to
meet the optimal esthetic results. Color perception occurs when light from a particular source is
reflected by the object observed to the viewer. As light enters the eye it stimulates the neural
sensors in the eye’s retina to send a signal that is interpreted in the visual cortex of the brain. The
types of materials responding differently to the light. Transparent materials allow for the passage
of light with little change. Translucent materials scatter, transmit and absorb light. Opaque
materials reflect and absorb; however, they do not transmit light.
Natural teeth exhibit several characteristics besides color. The quality of translucency
exists, which can be defined as the gradient between transparent and opaque, surface texture, and
surface gloss.22 The translucent nature of tooth structure makes the color matching procedure
more complex when compared to an opaque object. With less light returning to the eye. These
characteristics of tooth structure affect the degree of light diffusion when striking a particular
object. Hence, the accuracy of color perception depends on a triad of events: the light source, the
optical properties of the object observed, and the color matching ability of the observer himself.1
There are additional factors including the surrounding colors, the angle of observation, light and
dark adaptation, and the size of the field of view, etc. However the most crucial factors are the
light source, surface, and individual observer which are closely interrelated. A change of any one
of them can result in a change in the perceived color. The light source is the most influential factor
for shade selection.
The ideal light source is natural light, occurring around mid-day, for accurate color comparison,
according to the recommendations of the Commission International de l’Eclairage (CIE, 1971).23If
the light source changes, then the light reflected from an object changes too. The Phenomenon of
two objects appearing to match in color under one light condition but showing apparent differences
under another light condition is called metamerism. Metamerism occurs frequently in dental
practice, resulting to difficulty in shade matching. To minimize this metamerism phenomenon is
by achieving the same spectral reflectance curves for two objects to be matched that will be always
conditions has led to the use of artificial lighting for color matching. A light source that is similar
to standard daylight is ideal for shade matching due to the fact that the daylight have the basic
qualities which are favorable for color development. These qualities are full color content,
adequate intensity, and compatibility with human’s eye. The light source quality is commonly
described by color temperature, and Color rendering index (CRI) in which are all measured to
reproduce the standard daylight.
Color temperature is defined as mean wavelength of the ambient light. The ideal color
temperature for color rendering is 5,500 K. Color Rendering Index (CRI) is the measure of the
completeness of the light spectrum and it refers to how a specific light source makes the color of
an object in the environment appear to a person and also how the subtle variations in its shades
and hues are replicated. The CRI of a light source is expressed as a number on a scale ranging
from 0 to 100. The higher this number, the better is the ability of the lighting source to render the
color details of an object accurately, and the eye ideally perceives color as it should be seen. Hence,
the light source should be spectrally balanced in the visible range (370-780 nm), have a color
rendering index of ˃90, so that the light source itself does not become a limiting factor.23
Among optical properties of the object itself, there are multiple inherent optical properties
of an object that interact with light and effect the perception of color. When light strikes
object/tooth, four phenomena associated with the interactions of the tooth with the light flux can
be described:25
1) Specular transmission of the light through the tooth.
2) Specular reflection at the surface.
3) Diffuse light reflection at the surface.
The translucency is the amount of incident light transmitted and scattered. Scattering makes the
object opaque and is dependent on the size, shape, number of the scattering centers and refractive
index.21 The color matching ability of the observer himself is subjective and influenced by external
light conditions, experience, age, and fatigue of the human eye and physiological variables such
as color blindness which all lead to inconsistencies in color matching ability.18
2.2. Tooth Dehydration / Rehydration Process
One of the most important aspect that affect the color measurement in dentistry is tooth
hydration. Unfortunately, a paucity of studies exists in the literature related to this subject.
Moisture content in intact extracted teeth was first examined by Burnett and Zenewitz (1958).26
They measured the changes in the moisture content of teeth. They found a 9.3 ±0.37 percent of
maximum moisture content of the teeth. Teeth were examined in a vacuum at 1000C with a
constant weight for 24 hours. Rehydration was not completely observed even when placing the
teeth in a moists environment at 370C, because some moisture had been irreversibly lost during
dehydration.
In 1980, a study conducted by Sorensen and Bonstein to measure the changes in hydration
state on tooth color by using spectrophotometery by calculating ΔE for color change. In this study,
they used 30 extracted lower molars and they immersed them in water at 370C for four days. Later,
they dehydrated the teeth at room temperature for 12 hours and rehydrated them for 48 hours. They
measured every tooth at baseline, after 15 minutes, 30 minutes, 1 hour, and 12 hours for
dehydration, and for rehydration they used the same intervals except that the last measurement was
after 48 hours. The authors concluded that the L*, a*, and b* values increased during dehydration,
and teeth became darker.27 Hence, tooth dehydration makes teeth appear lighter due to increasing
enamel opacity. The inter-prism spaces become filled with air instead of water so light can no
longer be transmitted from crystal to crystal.24
As a consequence of tooth dehydration, translucency of dental enamel will be decreased
according to study was done by Brodbelt et al. (1981), in which they examined the translucency
of dental enamel by measuring hydration of the teeth with total transmittance of wavelength of the
visible spectrum. In this study, the authors examined the wet and dehydrated enamel disks that
collected from labial surfaces of extracted human maxillary central incisors by using a
spectrophotometer for total transmission and color measurements. For dehydrated enamel, the
authors used an air stream for a ten-second exposure to simulate clinical conditions. They repeated
the procedure three times every 15 minutes and rehydrated the specimens for 48 hours in distilled
water. Measurements with a spectrophotometer were performed and they found that the
translucency of enamel was influenced by dehydration in (reduction in translucency) and
translucency was restored with rehydration.28 As a result of the replacement of the water around
the enamel prisms by air, the light will be scattered, due to function of the difference in refractive
indices of the two components.
The refractive index (RI) of dental enamel is approximately 1.7. Since the refractive index
of refraction of water is 1.33 and that of air is 1.00, a larger difference and greater scattering of
light are produced at an enamel-air interface. For that reason, dehydrated enamel has a lower
translucency.29
Furthermore, Russell et al. (2000)30 conducted an in vivo study to determine the changes in color
measurements of naturel teeth after dehydration and the time taken for tooth color to return to
and b* (chromaticity), as well as h* which is the hue angle and C*(Chroma). Fourteen subjects
were divided into two groups of seven students. For the first group was, rubber dam was used for
15 minutes of teeth isolation and removed it and took three readings in total with an interval of 10
minutes. For the second group they dehydrated the teeth with polyvinylsiloxane impression for six
minutes and three readings were taken as well. Color measurements were performed in both groups
by a spectrophotometer with using a jig for positioning consistency of the measurement on a
maxillary central incisor. The authors concluded that there were statistically significant changes in
measurements of delta E and in L*, a* and b* values. The largest changes noted in lightness values
and with only relatively small changes noted in a* and b* for both rubber dam and impressions
material group. Hence, teeth became brighter and less saturated after rubber dam application. The
baseline values were regained after 30 min.30
In a more recent study, Burki et al. (2012)31 investigated any change in tooth color resulting
from dehydration and noted the time required for any change to return to baseline. The authors
examined 20 subjects. For each subject a left or right maxillary central incisor was used with a
positioning jig. The VITA Easyshade spectrophotometer was used for color measurement of the
tested teeth. They collected a baseline spectrophotometric measurement, then the tested tooth was
isolated with rubber dam and allowed to dehydrate. Spectrophotometric measurements of the test
tooth during dehydration were obtained at 10 min intervals for 30 min. Then rubber dam was
removed and subjects were instructed to drink a glass of water. Additional spectrophotometric
measurements of the tested tooth were obtained at the same intervals for 30 min during rehydration.
The authors stated that there were statistically significant changes in the shades of the teeth during
dehydration. In which they found the test teeth became significantly lighter after just 10 min of
rehydration, unlike what was found in previous mention study done by Russel et al.30 In this study,
the baseline values were regained after 30 min of rehydration.
There are different factors that producing dehydration and rehydration of the teeth. For
example: rubber dam, Optragates (which are a latex free lip and check retractor with elasticity and
flexibility make it comfortable to wear and help the patient to keep their mouth open), or other
isolation methods, like taking impression for dental procedures. Nowadays most of the clinicians
are not using rubber dam since it is time consuming for rubber dam application, and in a typical
clinical scenario, shade determination for ceramic restorations is usually not performed with a
rubber dam in place. Retraction methods are more commonly used which provide relative levels
of isolation by relieving the tooth of contact with wet soft tissues while still keeping the tooth
within the confines of the oral cavity. For that reason, in this study the Optragate was used for
isolation, which is very easy to use and fast application. Color determination therefore has to be
carried out in controlled circumstances before the tooth dehydrates if a successful match is to be
obtained.
In summary, Shade selection for direct and indirect restorations has always been a
challenge for esthetic dentistry, especially with increasing patients’ expectations. The success of
the restorative treatment of esthetic teeth depends on the dentist’s ability, skills, and on
understanding the factors that play a role on shade selection procedure. One of the crucial factor
that influence shade selection is dehydration/ rehydration process of the teeth. Little is known in
the literature about the effect of the dehydration/rehydration process on the shade determination
REFFERENCES
1. Sproull RC. Color matching in dentistry. III. Color control. J Prosthet Dent., 1974;31(2):146-54.
2. Clark EB. An Analysis of Tooth Color, J Am Dent Assoc., 1931;18:2093–2103.
3. Milleding P, Haag P, Neroth B, Renz I. Two years of clinical experience with Procera titanium crowns. Int J Prosthodont., 1998;11(3):224-32.
4. Bergman B, Nilson H, Andersson M. A longitudinal clinical study of Procera ceramic-veneered titanium copings. Int J Prosthodont., 1999;12(2):135-9.
5. Sjogren G, Lantto R, Tillberg A. Clinical evaluation of all-ceramic crowns (Dicor) in general practice. J Prosthet Dent., 1999;81(3):277-84.
6. Haselton DR, Diaz-Arnold AM, Hillis SL. Clinical assessment of high-strength all-ceramic crowns. J Prosthet Dent., 2000;83(4):396-401.
7. Feller RL, and Stenius AS. On the Color Space of Sigfrid Forsius, 1611, Color Eng. 1970; 8:48-51.
8. Judd DB, Wyszecki G. Color in Business, Science and Industry. 2nd ed. New York
(NY): John Wiley & Sons; 1963.
9. Nickerson D. Color Measurement and its application to the grading of agriculture. USDepartment of Agriculture Misc. Publication No. 58; 1946.
10. Munsell AH. A Color Notation. 11th ed. Baltimore (MD): Munsell Color Company Inc; 1961.
11. Rossing T, Chiaverina CJ. Light science: physics and the visual arts. 1st ed. New York (NY): Springer Science & Business Media; 1999.
12. Paravina RD, Ghinea R, Herrera LJ, et al. Color difference thresholds in dentistry. J Esthet Rest Dent., 2015;27(Suppl 1):S1-S9.
13. Clark EB. The Clark tooth color system: parts I and II. Dental Magazine and Oral Topics 1933;50:139–52.
15. Preston JD. Current status of shade selection and color matching. Quintess Inter., 1985;16:47–58.
16. Hunter RS. The measurment of appearance. 2nd ed. New York (NY): John Wiley
& Sons; 1987.
17. Kim-Pusateri S, Brewer J, Davis EL, Wee AG. Reliability and accuracy of four
dental shade-matching devices. J Prosthet Dent., 2009;101:93–9.
18. Paul SJ, Peter A, Rodoni L, Pietrobon N. Conventional visual vs
spectrophotometric shade taking for porcelain-fused-to-metal crowns: a clinical comparison. Inter J Perio Rest Dent., 2004;24:222–31.
19. Paravina RD, Powers JM. Esthetic color training in dentistry. 1st ed. St. Louis (MO): Elsevier Mosby: 2004.
20. Lim HN, Yu B, Lee YK. Spectroradiometric and spectrophotometric translucency
of ceramic materials. J Prosthet Dent., 2010;104:239-46.
21. Brewer JD, Wee A, Seghi R. Advances in color matching. Dent Clin North Am.,
2004;48:341-58.
22. Preston JD. Perspectives in dental ceramics. Proceedings of the 4th International Symposium on Ceramics. 1st ed. Chicago (IL): Quintessence; 1988.
23. Preston JD, Bergen SF. Color science and dental art: 1st ed. St. Louis (MO): CV Mosby; 1980.
24. Fondriest J. Shade matching in restorative dentistry: the science and strategies. Inter J Perio Rest Dent., 2003;23:467–79.
25. Jahangiri L, Reinhardt SB, Mehra RV, Matheson PB. Relationship between tooth
shade value and skin color: an observational study. J Prosthet Dent., 2002;87:149-152.
26. Burnett GW, Zenewitz JA. Studies of the composition of teeth: VIII. The composition of human teeth. J Dent Res., 1958;37:590-600.
27. Sorensen B, Bonstein T. The Effect of Hydration State on Tooth Color:
Spectrophotometeric Evaluation. University of Manitoba, Winnipeg, Canada 1980.
28. Brodbelt RH, O'Brien WJ, Fan PL, et al. Translucency of human dental enamel. J
29. Houwink B. The Index of Refraction of Dental Enamel Apatite. Br Dent J 1974;137:472-475.
30. Russell M, Gulfraz M, Moss B. In vivo measurement of colour changes in natural
teeth. J Oral Rehabil., 2000;27:786–92.
CHAPTER 2: MANUSCRIPT 1. Introduction
Shade selection for direct and indirect restorations has always been a challenging
component of esthetic dentistry for clinicians.1 Clark in 1931, was the first to address the problem
of color in dentistry, and he stated that “we as dentists are not educationally equipped to approach
a color problem”.2 This statement applies to this day, despite numerous advances in shade matching
techniques in recent decades. Based on current prospective and retrospective clinical studies, 50%
of cemented ceramic crowns exhibits incorrect color matches.3-6
When color is measured, and color differences are identified, the CIELAB system is frequently
used, which is based on the 1976 Commision Internationale de l´Eclairage (CIE) L*a*b* color
space. The three coordinates that determine color in this nearly uniform space are the L* value
(y-axis), which represents lightness, the a* value, which represents red-green chromaticity and the b*
value which represents yellow-blue chromaticity. This system is the basis for transforming spectral
energy data into meaningful color data.6,7 Recently, CIE published a new CIEDE2000 formula
model which is extended to the CIE 1976 (L*a*b*) color-difference model with corrections for
variation in color-difference perception dependent on Lightness, Chroma, Hue and Chroma-Hue
interaction. Additionally, the CIE investigated the non-uniformity of the CIELAB space and
developed this empirical correction to improve agreement between perceived visual color
difference and numerical color difference.8
In the CIELAB system, Delta E (∆Eab) is the color difference, or the distance separating two points
CIEDE2000 system, Delta E (∆E00) is the total color-difference between two color samples with
Lightness, Chroma and Hue differences. It is determined by the following equation8:
∆𝐸## = ∆𝐿&
𝑘(𝑆(
*
+ ∆𝐶& 𝑘-𝑆
-*
+ ∆𝐻&
𝑘/𝑆/
*
+ 𝑅1 ∆𝐶&
𝑘2𝑆2
∆𝐻&
𝑘/𝑆/
When the color difference between two compared objects can be seen by 50% of the observers, it
is a 50:50% perceptibility threshold. Similarly, a 50:50% acceptability threshold has been defined
when a color difference is considered acceptable by 50% of the observers. A prospective
multicenter study by Paravina et al10 concluded that the CIELAB 50:50% perceptibility threshold
was ∆Eab=1.2, whereas the 50:50% acceptability threshold was ∆Eab=2,7. The corresponding
CIEDE2000 (ΔE00) values were 0.8 and 1.8, respectively, for under simulated clinical settings.
Color determination is an interplay where color perception and matching abilities need to
meet in the best of conditions. Color perception occurs when light from a particular source is
reflected by the object and observed by the viewer. Hence, color perception is influenced by a triad
of events: the light source, the optical properties of the object observed and the color matching
ability of the observer himself.1 The light source should be spectrally balanced in the visible range
(370-780 nm), have a color temperature of approximately 5500°K and a color rendering index of
˃90, so that the light source itself does not become a limiting factor.11 Among optical properties
of the object itself, translucency and light scattering impact color perception. The translucency is
the amount of incident light transmitted and scattered. Scattering makes the object opaque and is
dependent on the size, shape, number of the scattering centers and refractive index.11 The color
matching ability of the operator is influenced by viewing conditions, color fatigue of the eye, age,
Tooth dehydration makes teeth appear whiter due to increasing enamel opacity. The
inter-prism spaces become filled with air instead of water so light can no longer scatter from crystal to
crystal. Loss of translucency due to dehydration therefore causes more reflection which masks the
underlying color of dentin, making the tooth appear lighter.6,11
Color determination therefore must be carried out in controlled circumstances before the
tooth dehydrates, if a successful match is to be obtained. Few clinical studies have examined how
rapidly teeth dehydrate to a perceivable color difference. Russel et al12 made measurements with
a reflectance spectrophotometer on a single central incisor before and after 15 minutes of rubber
dam isolation.13 The purpose of their study was to determine the changes in the ∆E after 15 minutes
of rubber dam application and the time for tooth color to return to original values. Burki et al13
also conducted an in vivo study, to assess the effects of dehydration on tooth color. They isolated
a central incisor with a rubber dam. They made measurements with a spectrophotometer before,
and 10, 20 and 30 minutes after application. The levels of ∆E obtained after relatively short
intervals of rubber dam isolation are well above the acceptability thresholds for shade incorrect
match determined by Paravina et al10 (∆E = 2.7). Further studies are warranted to examine how
fast perceptibility and acceptability thresholds of shade mismatch are reached.
In a typical clinical scenario, shade determination for ceramic restorations is usually not
performed with a rubber dam in place. Retraction methods are commonly used which provide
relative levels of isolation by relieving the tooth of contact with wet soft tissues while keeping the
tooth within the confines of the oral cavity. However, for direct restorations, isolation is critical
and a rubber dam is often used. Regardless of the means of isolation, the degree of dehydration
that occurs and how rapidly its manifest is of great importance with regards to the timing of shade
The purpose of the present study was to estimate the time required for teeth to dehydrate
to perceivable and acceptable thresholds of color change using methods of relative isolation, and
to determine the time required for the color change to return to normal level after isolation removal.
The null hypothesis is that there is no perceivable difference between tooth shade before and after
dehydration, and the time required to rehydrate the tooth is not proportional to the tooth’s original
shade.
2.Materials and Methods
2.1. Participant Selection:
Thirty-two participants were recruited for this clinical study that was conducted under
approval of the Institutional Review Board (IRB) of the University of North Carolina at Chapel
Hill (16-1620). These Participants were selected among students and staff members at the
University of North Carolina at Chapel Hill based on the following criteria:
Inclusion criteria:
- Adult participants 18 – 45 years of age.
- Participants have no adverse medical condition and are not on any medication.
Unstimulated salivary flow was measured volumetrically to ensure that it is within normal
limits (0.3-0.4 ml / minute).
- The tooth to be observed (central incisor) should be a sound natural tooth with no
restorations, recent bleaching or severe discolorations, with a healthy periodontal
condition.
Exclusion criteria:
- Presence of a restoration.
- Presence of an orthodontic fixed appliance including the central incisors.
2.2. Instrument Used:
The VITA Easyshade spectrophotometer (Bad Säckingen, Germany) was used in this
clinical study for color measurements. (Figure 1.2)
Figure 2.1: The Vita Easyshade Spectrophotometer.
2.3. Jig Preparation:
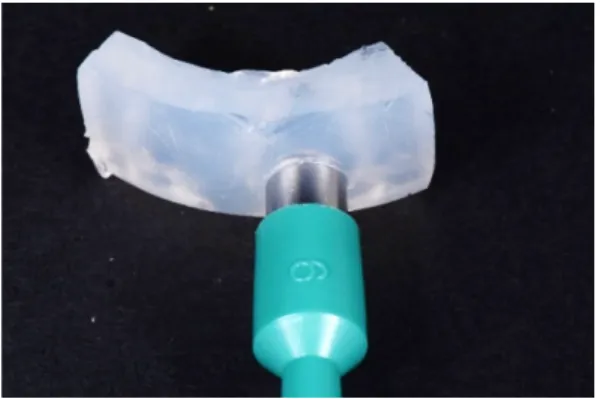
A custom-made jig was made for the central incisor of each participant from a clear silicone
impression material (Affinity Crystal Clear, Clinician’s Choice, CT, USA) to ensure consistency
in the positioning of the spectrophotometer. The clear jig allowed visualization of the entire facial
surface, with an access opening of 6 mm diameter, made by a disposable tissue punches, located
Figure 2.2: Custom Made Jig with Puncher.
Figure 2.3: Custom Made Jig with Spectrophotometer.
2.4. Color Measurements:
All participants were seated and reclined to a 45˚ position to the floor, to eliminate any
shadowing effects from the nose/lips. Color measurements were conducted under controlled light
settings (color temperature 5500°K and a Color Rendering Index (CRI) of 95) with neutral color
surroundings. Lips were retracted by using an Optragate (Ivoclar Vivadent Inc., NY, USA).
Optragate placement was done in 15 seconds, otherwise it was repeated allowing the patient to
close, to ensure no pre-testing dehydration. The custom-made jig was seated in place, and
measurements were made using the calibrated VITA Easyshade spectrophotometer determining
L*, C*, H* values in accordance with the Commission Internationale de l'eclairage (CIEDE2000)
Figure 2.4: Positioning a Custom Made Jig with an Access Opening in the Middle Third of the
Tested Tooth that Allowed Color Measurements with the Vita Easyshade.
All participants wore a nose clip during measurements to ensure that the same mode of
breathing was used (mouth vs. nose breathing), ensuring the same air flow in all study subjects.
Dehydration time color measurements were performed according to the following time intervals:
0 (baseline), 2, 3, 5,7,10 and15 minutes.
For rehydration time determination, the Optragate isolation device was removed from the
mouth, and a full mouth rinse with water was done. Then participants were asked to close their
mouth for 5 minutes. Color measurements to determine the extent of tooth rehydration were
performed according to the same intervals that are mentioned in the dehydration phase of the study.
The L, C and H values obtained were used to calculate CIEDE2000 color differences
(ΔE00) between baseline and the other intervals for dehydration and rehydration. These values were
compared to the perceptibility and acceptability thresholds as determined by Paravina et al10 to
evaluate the time at which the clinicians have to determine a shade under relative levels of isolation
before dehydration causes perceptible levels of color change which might adversely affect the
2.5. Data Management and Statistical Analysis
The data were analyzed for color differences (ΔE00) over time using an analysis of variance
(ANOVA). Post-ANOVA contrasts were made between baseline and each time intervals (baseline
and, 1, 2, 3, 5, 7, 10, 15 minutes) by using Tukey test with P values adjusted for multiple
comparisons (p < 0.0001). Percentage changes between baseline and each time interval were
assessed for color differences by using Clopper-Pearson (Exact) test with a 95% confidence
interval. Additionally, this test was used to assess the proportion of the population that exceeded
the ΔE00 perceptibility threshold of 0.8 or acceptability threshold of 1.8 at each time interval of
dehydration and rehydration.
3. Results
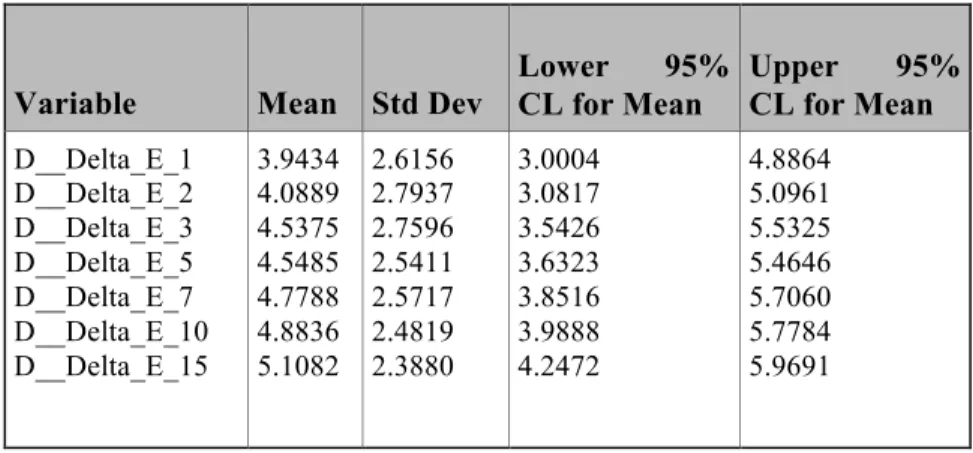
The values for the mean, standard deviation, and 95% confidence interval of the color
differences, expressed by ΔE00 at baseline, 1, 2, 3, 5, 7, 10, and 15 minutes time intervals of
dehydration and rehydration can be seen in Table 1.2, Table 2.2 and Figure 2.5.
Table 2.1: Mean and Standard deviation of ∆E of dehydration.
Variable Mean Std Dev
Lower 95% CL for Mean
Upper 95% CL for Mean
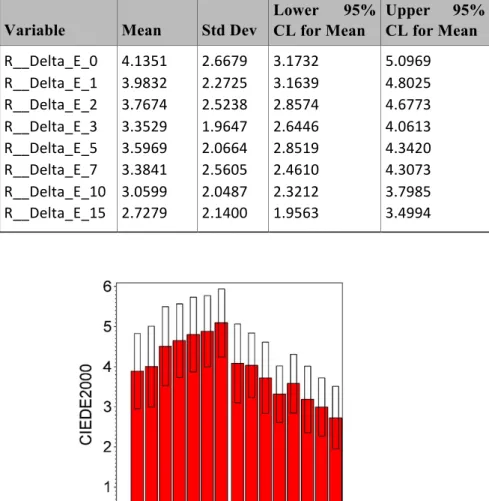
Table 2.2: Mean and Standard deviation of ∆E of rehydration.
Figure 2.5: Changes in the (∆E) of Dehydration and Rehydration.
Analysis of variance (ANOVA) indicated that there was statistically significant change in
color over time in the mean ∆E00 for both dehydration and rehydration procedure (P < 0.0001). As
time increases, the mean ∆E00 increases as well within the dehydration procedure. The values were
compared to the 50:50% perceptibility and acceptability thresholds at ∆E00 of 0.8 and 1.8
respectively.10 Within the first minute there was a statistically significant change in ∆E00 and
beyond the acceptability threshold.
Variable Mean Std Dev
Lower 95% CL for Mean
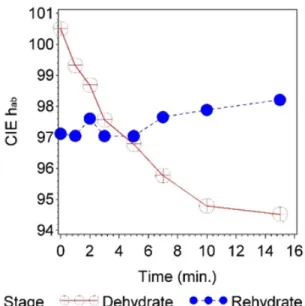
Average change in L, C and H values are displayed in figures 2.6-2.8. Mean L value
showed a significant spike within the first minute of dehydration, while it returned to its original
value after 15 minutes of rehydration. Mean C value remained increasing until 15 minutes of
dehydration, and didn’t returned to its original value after 15 minutes rehydration. The mean H
value remained decreasing until 15 minutes of dehydration, and also didn’t retuned to its original
value after 15 minutes of rehydration. Therefore, continued increase in ∆E to 15 minutes is not
only attributed to the change in L values, but also due to the changes in C and H values.
Figure 2.8: Mean Changes in H.
Clopper-Pearson (Exact) test with 95% confidence interval was used to assess the
proportion of the population that exceeded the ∆E00 perceptibility threshold of 0.8 or the ∆E00
acceptability threshold of 1.8 at each time interval of dehydration and rehydration. 87% of teeth
were beyond the ∆E00 perceptibility threshold (0.8) within the first minute of dehydration. While
90% of teeth were beyond the perceptibility threshold after 15 minutes of rehydration as shown in
(Figure 2.9).
Figure 2.9: Percentage of Participants with Perceivable Color Changes during Dehydration and
Furthermore, 72% of the participants were beyond the acceptability threshold (1.8) with
the first minute of dehydration. While 65% of the participants were beyond the acceptability
threshold after 15 minutes of rehydration. Therefore, most of the teeth didn’t returned to its original
baseline shade values after 15 minutes of rehydration as shown in (Figure 2.10).
Figure 2.10: Percentage of Participants with Acceptable Color changes during Dehydration and
Rehydration.
4. Discussion:
The present study revealed statistically significant and visually perceptible differences in
tooth color measurements after dehydration and rehydration within the defined time intervals,
rejecting the null hypothesis.
∆E00 values were calculated to assess the changes in tooth color by using a hand-held
spectrophotometer (VITA Easyshade). ∆E00 values were compared to Paravina et al10study of 50:
50% ∆E00 perceptibly (0.8) and acceptability (1.8) thresholds. Within the first minute of
dehydration there was a significant change in the ∆E00 (3.9) beyond the perceptibility threshold
to increase constantly through the time intervals until 15 minutes (∆E00 = 5.1). Thereafter,
participants were asked to rinse with water and close for 5 minutes to allow for teeth to rehydrate.
∆E00 measurements were calculated at the defined intervals. Tooth color did not return to its’
original value after 15 minutes of rehydration, ∆E00 constantly decreasing from 4.1 to 2.7, with
65% of the participants beyond the acceptability threshold. Furthermore, the L (Lightness)
returned to its original value after rehydration, while the C (Chroma) retained a higher value and
a lower H (Hue) value after rehydration. Therefore, tooth color determination should be carried
out prior to the start of any treatment, before the tooth dehydrates, for a successful color match to
be achieved. When teeth dehydrate, and based on the results of this study, it would be clinically
challenging to match the tooth’s color within the allocated chair time due to the time it will require
for the tooth to rehydrate and return to its original shade.
To understand the change in tooth color due to dehydration, the tooth’s enamel and dentin
have a defined refractive index (RI) when light passes through the tooth structure. Refractive index
is the change in the light’s direction when the transmitting medium changes. The RI of air is 1.00
and that of water is 1.33.14 When light passes through enamel (RI = 1.63) and then through dentin
(RI = 1.54) the light refracts in a certain direction.15 When the tooth is moist, the inter-prism space
is filled with saliva, and light will refract in a defined path. When the tooth dehydrates, the
inter-prism space will be replaced with air, and the light will refract differently due to the difference in
RI. The increased light refraction reduces the tooth’s translucency and increases its luminosity,
giving the tooth a whiter appearance. When the tooth is rehydrated, it may require a longer period
of time, more than 15 minutes, for the saliva to refill the inter-prism spaces and restoring the
Isolation is considered one of the pillars to the success of most restorative procedures. As
the use of rubber dam is essential towards this success, it is unfortunately becoming an uncommon
practice. Other methods of isolation have been introduced and offer relative isolation. The rationale
for using the Optragate isolation device in the present study instead of the rubber dam, for
documenting the dehydration process, is due to that rubber dam application can be time consuming
and would have precluded timely measurements of the tooth dehydration process. According to a
previous study, rubber dam application took an average time between 3–5 minutes.16
Consequently, the color measurement process will be adversely affected. In this study, a single
operator (SS) was trained on the Optragate application in a timely manner (less than 30 seconds)
to ensure consistency of the results.
In the literature, little is known about how long it takes for teeth to dehydrate/rehydrate and
the effect time has on the shade selection process. A few clinical studies were found that measured
the change in color with dehydration/rehydration effects on these changes. Russel et al 12,
conducted an in vivo study to determine the changes in color measurements of naturel teeth in 7
subjects before and after isolation by using rubber dam for 15 minutes, also estimating the time
taken for the tooth color to return to its original color. Color measurements were made by using a
spectrophotometer with no mentioning of using a positioning jig. The authors used the CIELab
system to evaluate L* (Lightness), a* (red – green) and b* (blue – yellow), as well as h (which is
the hue angle) and C (Chroma). The authors concluded that teeth become brighter and less
saturated after 15 minutes of rubber dam application, and in agreement with the present study.
They also found that baseline values of the tooth’s color were regained after 30 minutes of
rehydration. Whereas the baseline values were not regained after 15 minutes of rehydration in the
In a more recent study conducted by Burki et al13,color change due to dehydration was
investigated in 20 subjects. For each subject a left or right maxillary central incisor was used with
a positioning jig made for placement of the VITA Easyshade spectrophotometer. Baseline
measurements were collected followed by rubber dam isolation. Measurements were obtained at
10-minute intervals for 30 minutes. The rubber dam was removed and subjects were instructed to
drink a glass of water followed by additional color measurements for rehydration with same time
intervals. They concluded significant changes in the color of teeth after 10 minutes of dehydration.
Additionally, the tooth’s original color had not returned to baseline color within 30 minutes of
rehydration, contrasting Russel et al12’s finding and in agreement with the findings of the present
study.
Deficiencies of the previously mentioned studies include long time intervals. Ten-minute
intervals were used without the ability to specify exactly color change in a timely manner.
Moreover, small sample sizes were used which may have significant effects on the outcome. A
larger sample size, with greater diversity of age and gender, could reveal a more complete picture
regarding the dehydration/rehydration patterns. Senior patients may have reduced salivary flow,
enhancing the dehydration effects on color and time, also requiring longer time for the tooth to
rehydrate and returning to its original color. Rubber dam isolation was used in both studies for the
dehydration process. As specified earlier, the time required for rubber dam placement may
adversely affect the results.
Ideally, longer time intervals for the rehydration color measurements would precisely predict when
tooth rehydration would occur. This information is important for the clinician when missing the
initial shade selection opportunity and would be suggested for further research. Another potential
was fabricated ensuring repeatability when measurements are collected. In addition, the mean of
three measurements per interval was calculated ensuring reliability.
Within the limitations of this clinical study, the following conclusions may be made:
• Tooth dehydration within the first minute will lead to perceivable changes in the tooth’s
color, impacting the shade selection process.
• Teeth rehydration require more than 15 minutes to return to their original shade.
REFFERENCES
1. Sproull RC. Color matching in dentistry. III. Color control. J Prosthet Dent., 1974;31:146-54.
2. Clark EB. An Analysis of Tooth Color, J Am Dent Assoc., 1931;18:2093–2103.
3. Milleding P, Haag P, Neroth B, Renz I. Two years of clinical experience with Procera titanium crowns. Int J Prosthodont., 1998;11:224-32.
4. Bergman B, Nilson H, Andersson M. A longitudinal clinical study of Procera ceramic-veneered titanium copings. Int J Prosthodont., 1999;12:135-9.
5. Sjogren G, Lantto R, Tillberg A. Clinical evaluation of all-ceramic crowns (Dicor) in general practice. J Prosthet Dent., 1999;81:277-84.
6. Haselton DR, Diaz-Arnold AM, Hillis SL. Clinical assessment of high-strength all-ceramic crowns. J Prosthet Dent., 2000;83:396-401.
7. Feller RL, and Stenius AS. On the Color Space of Sigfrid Forsius, 1611, Color Eng. 1970; 8:48-51.
8. Sharma G, Wu W, Dalal EN. The CIEDE2000 color-difference formula:
Implementation notes, supplementary test data, and mathematical observations. Col Res Appl., 2004;30:21-30.
9. Judd DB, Wyszecki G. Color in Business, Science and Industry. 2nd ed. New York
(NY): John Wiley & Sons; 1963.
10. Paravina RD, Ghinea R, Herrera LJ, et al. Color difference thresholds in dentistry. J Esthet Rest Dent., 2015;27(Suppl 1):S1-S9.
11. Munsell AH. A Color Notation. 11th ed. Baltimore (MD): Munsell Color Company Inc; 1961.
12. Russell M, Gulfraz M, Moss B. In vivo measurement of colour changes in natural
teeth. J Oral Rehabil., 2000;27:786–92.
13. Burki Z, Watkins S, Wilson R, Fenlon M. A randomised controlled trial to investigate the effects of dehydration on tooth colour. J Dent., 2013;41:250-7.
14. Edlén B. The refractive index of air. Metrologia, 1966; 2:71-80.