Developing the ‘Understanding Library Impacts’ protocol: a method for detecting and communicating academic library impact on student learning
Derek Alan Rodriguez
A dissertation submitted to the faculty of the University of North Carolina at Chapel Hill in partial fulfillment of the requirements for the degree of
Doctor of Philosophy in the School of Information and Library Science
Chapel Hill 2012
ii ©2012
iii Abstract
DEREK ALAN RODRIGUEZ: Developing the ‘Understanding Library Impacts’ protocol: a method for detecting and communicating academic library impact on student learning
(Under the direction of Dr. Helen R. Tibbo)
The Understanding Library Impacts (ULI) protocol is a suite of instruments designed to demonstrate connections between undergraduate student use of the academic library and faculty-defined
expectations for student learning. The ULI protocol features a Critical Incident Technique (CIT) survey for exploring student use of the library during ‘high-impact’ academic experiences such as capstone courses. A ‘Learning Activities Crosswalk’ links student use of the library to faculty-defined, discipline-specific and general education expectations for student learning. This methodological study was designed to evaluate the protocol with a population of undergraduate students enrolled in upper-level and capstone courses in the discipline of history at six colleges and universities.
The protocol focuses on students’ use of traditional and electronic information resources, library services, and library facilities during learning activities associated with ‘high-impact’ experiences in the academic major. Learning activities are stages in ‘high-impact’ coursework during which students develop and demonstrate desired learning outcomes. The Learning Activities Crosswalk creates credible connections between information use behaviors during these learning activities and faculty-defined expectations for student learning.
A web-based survey using the Critical Incident Technique gathers quantitative and qualitative data about students’ information uses when completing ‘high-impact’ coursework. Created and refined in two interview-based pilot studies, respondents identify the information resources, services, and facilities used when completing coursework and the learning activities each use supported. Partially-open questions identify the factors of library use that were helpful or problematic to students during their coursework. Open-ended questions gather qualitative data and user stories that reinforce other findings.
Undergraduates enrolled in history courses at the six study sites reported 127 critical incidents. Responses from the survey and results from the Learning Activities Crosswalk were entered into a database for analysis and presentation to study sites. Statistical and qualitative techniques were used to assess the validity and reliability of findings.
v Acknowledgements
This dissertation could not have been completed without the support, encouragement, and cooperation of many contributors. I would like to express my appreciation to those who have helped me during this process.
I wish to thank members of my dissertation committee: Helen Tibbo, Barbara Moran, Barbara Wildemuth, David Dill, and Jeff Pomerantz. Over several years they provided the right amount of support and encouragement to keep me going, yet challenged me in countless ways that improved this dissertation. I want to thank Helen Tibbo, my advisor and chair of the committee, for her initial encouragement to try my hand at qualitative research and for her patient advice through the years. Barbara Wildemuth deserves special thanks for her methodological guidance and her exceptionally close reading of my work. I especially appreciate the advice of David Dill to ensure the ULI
framework and its results are compatible with broader frameworks in higher education, increasing the value of ULI results in the eyes of external stakeholders. I also want to acknowledge the
contributions and support of Paul Solomon for his encouragement to pursue qualitative research as a means for answering the difficult ‘how’ and ‘why’ questions in Library and Information Science. And I would like to thank Gary Marchionini for his encouragement and for sharing with me the insight that pursuing a doctoral degree is an opportunity to focus on problem solving, writ large.
I also want to recognize the encouragement, friendship, and research assistance of several colleagues in the PhD program at SILS. Leo Cao, Alex Chassanoff, Laura Christopherson, Kaitlin Costello, Ericka Patillo, Alex Poole, Sarah Ramdeen, Terrell Russell, Laura Sheble, Amy Vanscoy, and Holly White all contributed through assistance with qualitative analysis and reading drafts of my work. I also want to thank Geneva Holliday and the staff of the UNC Chapel Hill Libraries’
vi
and Kathy Wisser deserve special thanks for their friendship and support when it seemed I would never finish.
This particular project would not have been possible without the support of professional colleagues who welcomed me into their organizations to conduct research. I want to thank Amy Dykeman, Chuck Hamaker, Kate Hickey, Teresa LePors, Lisa Norberg, Leland Park, and the numerous anonymous faculty members and librarians at all eight study sites. The project would not have happened at all without their assistance and their enthusiasm for the Understanding Library Impacts project.
vii Table of Contents
LIST OF TABLES ... xiv
LIST OF FIGURES ... xix
1 Introduction ... 1
1.1 Research problem ... 1
1.2 The ‘Understanding Library Impacts’ protocol ... 3
1.2.1 A conceptual framework ... 3
1.2.2 Instruments ... 6
1.3 Purpose and delimitations ... 7
1.4 Design and research questions... 7
1.5 Significance of the current study ... 9
2 Literature Review ... 2
2.1 Evidence of student learning in college ... 2
2.1.1 Stakeholder demands for evidence of value for money... 2
2.1.2 Defining accountability ... 13
2.1.3 Assessing gains in broad abilities and skills ... 14
2.1.4 Surveys of student experience ... 20
2.1.5 Discipline specific knowledge and abilities ... 27
2.1.6 Summary ... 32
viii
2.2.1 Models and theories of college impact ... 34
2.2.2 Astin’s Input-Environment-Output (I-E-O) model ... 35
2.2.3 Student-oriented research traditions: Effort, Involvement, and Engagement ... 37
2.2.4 The College Environment ... 41
2.2.5 Summary ... 48
2.3 Library vitality and invisibility ... 49
2.3.1 The hybrid library: the case of the scholarly journal ... 49
2.3.2 Undergraduate resource preferences in the internet age ... 51
2.3.3 Trends in the use of print and electronic books ... 56
2.3.4 Use of in-person services ... 58
2.3.5 Who is going to the library? ... 60
2.3.6 Faculty perspectives of the library ... 66
2.3.7 Academic leaders’ perceptions of the library ... 71
2.3.8 Summary ... 74
2.4 Toward an operational definition of library impact ... 75
2.4.1 Definitions ... 76
2.4.2 Types of measures and the linear model of library impact ... 77
2.4.3 Toward user-oriented assessment in academic libraries ... 80
2.4.4 Candidate outcomes associated with academic library use ... 85
2.4.5 Summary ... 95
ix
2.5.1 The user-centered paradigm ... 96
2.5.2 Value-in-use ... 97
2.5.3 Context ... 100
2.5.4 Person-in-context models ... 101
2.5.5 Sense-making: a method for information behavior research ... 103
2.5.6 Holistic approaches to understanding information seeking ... 107
2.5.7 Social construction of information in context ... 112
2.5.8 Bounding the information seeking process, when ‘enough is enough!’ ... 116
2.5.9 Summary ... 121
3 Theoretical and methodological perspectives for the current study ... 123
3.1 Bounding definitions for the current study ... 123
3.2 The Critical Incident Technique (CIT) ... 125
3.2.1 Components of the Critical Incident Technique ... 126
3.2.2 Strengths and weaknesses of the CIT ... 128
3.2.3 Applications of the CIT in LIS research ... 129
3.2.4 A method for the current study ... 131
4 Qualitative pilot studies ... 133
4.1 Pilot study A ... 133
4.1.1 Design ... 133
4.1.2 Analysis ... 135
x
4.1.4 Learning objectives ... 140
4.1.5 Reliability and exhaustiveness checks ... 141
4.1.6 Implications ... 141
4.2 Pilot study B ... 142
4.2.1 Design ... 142
4.2.2 Analysis and results ... 143
4.2.3 Implications ... 150
5 Research design ... 153
5.1 Population and sample ... 153
5.1.1 Phase 1: Spring 2011 study sites ... 153
5.1.2 Phase 2: Fall 2011 study sites ... 154
5.2 The Learning Activities Crosswalk: data collection and analysis ... 155
5.2.1 Learning activities ... 155
5.2.2 Student learning outcomes ... 155
5.2.3 VALUE rubrics ... 156
5.2.4 Tuning outcomes ... 156
5.3 The critical incident survey ... 156
5.3.1 Recruiting and data collection ... 157
5.3.2 Instrumentation ... 157
5.3.3 Data analysis ... 160
xi
5.4 Ethical concerns ... 164
5.5 Project timelines ... 164
6 Results ... 166
6.1 Learning activities crosswalk ... 166
6.1.1 Constructing the learning activities crosswalk ... 166
6.1.2 Testing the crosswalk ... 180
6.2 Critical incident survey ... 188
6.2.1 Setting and population ... 188
6.2.2 Response rates and demographics of respondents ... 189
6.2.3 Scales ... 193
6.2.4 Library use ... 196
6.2.5 ‘Most important’ library uses ... 207
6.2.6 Mapping use to expectations for learning... 214
6.2.7 Factors of use associated with ‘most important’ uses ... 250
6.2.8 Open ended questions ... 270
7 Statistical analysis ... 297
7.1 Use and non-use of the library... 297
7.1.1 Dependent variables ... 298
7.1.2 Independent variables ... 299
7.1.3 Statistical associations with use and non-use of the library ... 301
xii
7.2 Statistical associations with affect ... 310
7.2.1 Anxiety and confidence ... 311
7.2.2 Discussion ... 318
8 Discussion and conclusion ... 320
8.1 Research questions ... 320
8.1.1 Research question #1 ... 320
8.1.2 Research question #2 ... 325
8.1.3 Research question #3 ... 328
8.1.4 Research question #4 ... 330
8.1.5 Research question #5 ... 340
8.1.6 Research question #6 ... 342
8.1.7 Research question #7 ... 342
8.1.8 Research question #8 ... 344
8.2 Limitations and methodological considerations ... 345
8.2.1 Limitations ... 345
8.2.2 Methodological considerations ... 348
8.3 Implications ... 349
8.3.1 Implications for library and information science research ... 349
8.3.2 Implications for practice ... 350
8.4 Future work ... 353
xiii
Appendix B: Tuning outcomes for History ... 356
Appendix C. CSEQ Library Experiences Scale ... 360
Appendix D: The Revised Taxonomy of Learning Objectives ... 361
Appendix E: The student interview script from Pilot Study B ... 363
Appendix F: Elements of the VALUE rubrics ... 364
Appendix G: The Understanding Library Impacts critical incident survey ... 366
Appendix H: Factors of use ... 381
Appendix I: Factor participation rates by theme and type ... 383
xiv
LIST OF TABLES
Table 2.1 Essential Learning Outcomes identified by the AAC&U LEAP Project ... 15
Table 2.2 AAC&U VALUE rubrics ... 19
Table 2.3 Benchmarks of Effective Educational Practice ... 22
Table 2.4 QFEHEA performance expectations at each degree cycle ... 30
Table 2.5 Subject-specific learning expectations for second cycle graduates ... 31
Table 2.6 Learning outcome expectations for first-cycle graduates in History ... 31
Table 2.7 Astin's 2 x 2 Taxonomy of College Outcomes ... 37
Table 2.8 Chickering and Gamson’s Best practices in undergraduate education ... 39
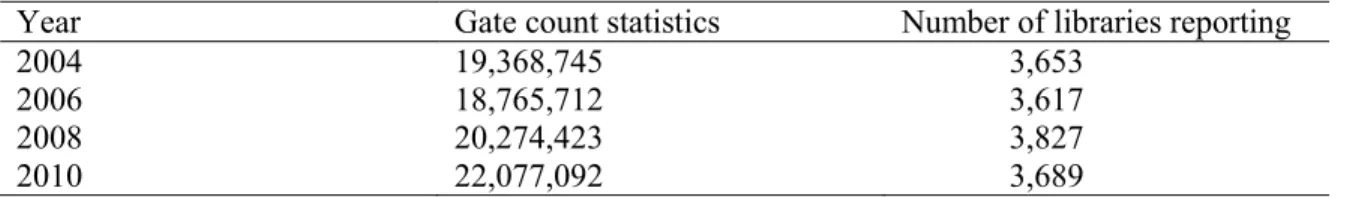
Table 2.9 Gate counts in a typical week at U.S. academic libraries 2004 - 2010 ... 60
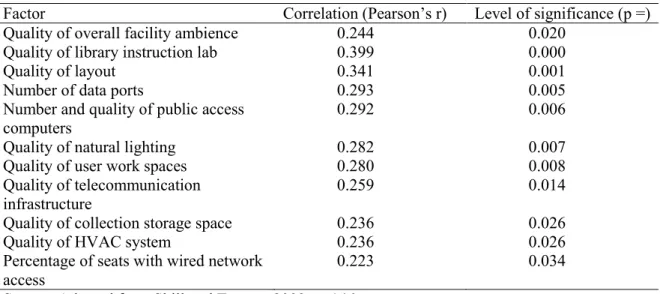
Table 2.10 Factors correlated with increased library use following renovation projects ... 64
Table 2.11 Use oriented measures of academic library measures ... 81
Table 2.12 Kuhlthau's Model of the Information Search Process (ISP) ... 111
Table 4.1 Faculty and student perceptions of learning goals, pilot A ... 141
Table 4.2 Categories of resources, services, space, and facilities use, pilot A ... 142
Table 4.3 Factors of use that contributed or hindered students in their work, pilot A ... 142
Table 4.4 Learning outcomes classified using the Revised Taxonomy, pilot B ... 143
Table 4.5 Library use when completing History assignments, pilot B ... 146
Table 4.6 Faculty and student observations regarding academic activities, pilot B ... 150
Table 4.7 Mapping faculty and student perceptions of learning goals, pilot B ... 150
Table 4.8 Saracevic and Kantor’s Derived Taxonomy of library value ... 152
Table 5.1 Sites participating in phase 2 ... 154
Table 5.2 Questions probing respondents’ affective state ... 158
Table 5.3 Phase 1 timeline ... 165
xv
Table 6.1 ‘Common set’ of student learning outcomes (SLOs) derived for phase 1 ... 168
Table 6.2 Learning activities used in phase 1 ... 169
Table 6.3 Activity codes to mapped to SLOs in the common set, phase 1 ... 170
Table 6.4 Crosswalking learning outcomes to VALUE rubric elements, phase 1 ... 171
Table 6.5 Mapping student learning outcomes to Tuning outcomes in phase 1... 173
Table 6.6 Inter-coder agreement for crosswalk mappings, phase 1 ... 175
Table 6.7 First round learning activities modifications ... 175
Table 6.8 First round SLO modifications ... 176
Table 6.9 Learning activities mapped to SLOS, as modified following phase 1 ... 178
Table 6.10 SLOS mapped to learning outcomes frameworks, as modified in phase 1 ... 179
Table 6.11 Deliverables expected of phase 2 courses ... 182
Table 6.12 Comparing phase 1 SLOS to expectations in phase 2 syllabi ... 183
Table 6.13 Comparing SLOS to program level frameworks and published sources ... 185
Table 6.14 Comparing phase 1 SLOS to expectations in capstone rubrics ... 186
Table 6.15 Phase 1: Demographic characteristics of respondents ... 189
Table 6.16 Phase 2: Demographic characteristics of respondents ... 190
Table 6.17 Comparing the sample with Common Data Set statistics ... 191
Table 6.18 Student reports of course deliverables by site and type of course ... 191
Table 6.19 Descriptive statistics for Deep Learning Scale scores ... 193
Table 6.20 CSEQ Scale Scores ... 194
Table 6.21 Nontraditional student status, Sites C through F ... 195
Table 6.22 Employment characteristics of respondents ... 196
Table 6.23 Proportion of respondents reporting library use during coursework ... 199
Table 6.24 Resource, services, and facilities use by type of course ... 201
Table 6.25 Student submitted use types, after checking ‘other’ ... 202
xvi
Table 6.27 Most important library uses, by site ... 208
Table 6.28 ‘Most important’ library uses, by course type ... 209
Table 6.29 'Most important uses' by site and learning activity ... 212
Table 6.30 Expectations for student learning during the activity ‘getting oriented’ ... 215
Table 6.31 Most important resources, services, and facilities while 'getting oriented' ... 217
Table 6.32 Expectations for student learning while ‘choosing a topic’ ... 219
Table 6.33 Most important library uses while 'choosing a topic' ... 221
Table 6.34 Expectations for student learning when ‘developing a thesis statement’ ... 222
Table 6.35 Most important library uses while 'developing a thesis' ... 225
Table 6.36 Expectations for student learning when ‘gathering evidence’ ... 227
Table 6.37 Most important library uses while 'gathering evidence' ... 231
Table 6.38 Expectations for student learning when ‘finding sources’ ... 233
Table 6.39 ‘Most important’ library uses while 'finding sources' ... 235
Table 6.40 Expectations for student learning while ‘creating a bibliography’ ... 236
Table 6.41 ‘Most important’ library uses when 'creating a bibliography' ... 238
Table 6.42 Expectations for student learning when ‘writing’ ... 240
Table 6.43 Most important library uses while 'writing' ... 243
Table 6.44 ‘Most important‘ library uses while 'preparing for an oral presentation' ... 246
Table 6.45 Helps and problems reported by respondents ... 251
Table 6.46 Themes expressed by respondents by site ... 253
Table 6.47 Participation rates for factors of use, by theme, sites A, B, and C ... 253
Table 6.48 Participation rates for factors of use, by theme, sites D, E, and F ... 254
Table 6.49 Participation rate for factors of use, by type of course and all respondents ... 254
Table 6.50 Saturation table for Site A, 'help' factors, by theme ... 255
Table 6.51 Proportion of responses required to reach theme saturation... 256
xvii
Table 6.53 Factors associated with theme 'Access to information' ... 257
Table 6.54 Most prevalent 'Access to information' factors for electronic resources ... 259
Table 6.55 Factors associated with theme 'Access to tools' ... 260
Table 6.56 Factors associated with the theme ‘Affect of Staff’ ... 261
Table 6.57 Factors associated with the theme ‘Anxiety’... 263
Table 6.58 Factors associated with the theme ‘Availability of space’ ... 263
Table 6.59 Factors associated with the theme 'Convenience' ... 265
Table 6.60 Factors associated with the theme 'Ease of use' ... 266
Table 6.61 Factors associated with the theme 'Help finding information'... 268
Table 6.62 Number of reports of 'no' problems with ‘most important’ uses ... 269
Table 6.63 Participation rates for open-ended questions ... 271
Table 6.64 Challenges participation rates by site ... 277
Table 6.65 Frequency with which task codes were assigned to challenges ... 278
Table 6.66 Frequency with which codes were assigned as sources of challenges ... 281
Table 6.67 Proportion of respondents reporting challenges related to library uses ... 283
Table 6.68 Codes used to categorize challenges by method of resolution ... 284
Table 6.69 Respondents who identified learning activities during challenges ... 286
Table 6.70 Task type codes assigned to challenges by activity, sites A and B ... 287
Table 6.71 Task type codes assigned to challenges by activity, sites C, D, E, and F ... 287
Table 6.72 Participation rates for top ranked and alternate uses questions ... 292
Table 6.73 Top-ranked resources, services, and facility/equipment ... 293
Table 6.74 Alternate activities, by type ... 294
Table 7.1 Descriptive statistics for number of claimed uses, by type and phase ... 298
Table 7.2 Ranges and quartiles for the inperson_user variable, by site ... 302
Table 7.3 Descriptive statistics for nonuser_total by site ... 303
xviii
Table 7.5 Ranges and quartiles for inperson_user by DEEP_BIN ... 306
Table 7.6 Ranges and quartiles for top_total by CSEQ_BIN ... 307
Table 7.7 Ranges and quartiles for nonuser_total by CSEQ_BIN ... 307
Table 7.8 Descriptive statistics for inperson_user by t-topuser ... 308
Table 7.9 Descriptive statistics for inperson_user by s-topuser ... 308
Table 7.10 Descriptive statistics for inperson_user by nonuser_total ... 308
Table 7.11 Questions probing respondents' affective state ... 310
Table 7.12 Descriptive statistics for preAnxiety by nonuser_total ... 311
Table 7.13 Descriptive statistics for preAnxiety by inperson_user ... 312
Table 7.14 Descriptive statistics for totalAnxiety by Site ... 312
Table 7.15 Descriptive statistics for preConfidence by Site ... 314
Table 7.16 Descriptive statistics for preConfidence by nontraditional scale scores ... 314
Table 7.17 Descriptive statistics for diffConfidence by Site ... 316
Table 7.18 Descriptive statistics for diffConfidence by inperson_user ... 317
Table 8.1 Participation rates for factors of use by theme ... 329
Table 8.2 Learning activities for History majors ... 331
Table 8.3 Respondents reporting 'most important' uses by learning activity, sites A & B .... 333
Table 8.4 Respondents reporting 'most important' uses by learning activity, sites C - F ... 333
Table 8.5 Student F-05's ‘most important’ library uses and challenge by learning activity . 338 Table 8.6 Student C-12's ‘most important’ library uses and challenge by learning activity . 339 Table 8.7 Percentage of U.S. college students with access to senior experiences, 2005 ... 345
xix
LIST OF FIGURES
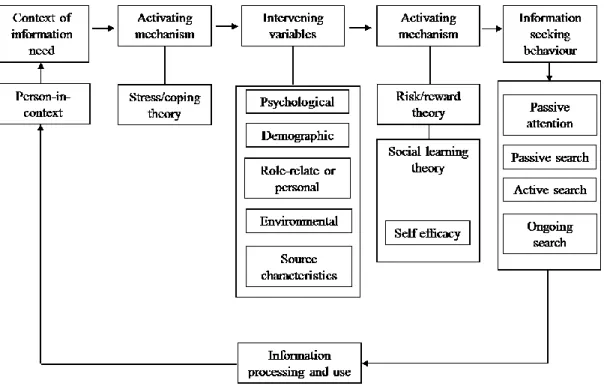
Figure 1.1 The Understanding Library Impacts Framework……….5
Figure 2.1 Astin's I-E-O model of college impact ... 35
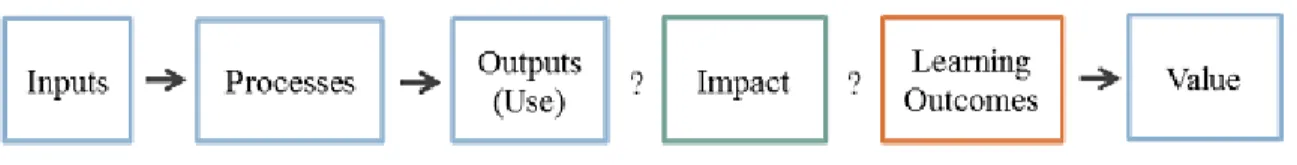
Figure 2.2 General linear model of academic library impact ... 80
Figure 2.3 Wilson's 1996 Information Behaviour Model ... 102
Figure 2.4 Dervin’s Sense-Making Triangle ... 104
Figure 6.1 Library uses by type ... 197
Figure 6.2 Proportion of respondents reporting types of use, by site and type of course ... 198
Figure 6.3 'Top 20' most commonly used resources, services, and facilities ... 199
Figure 6.4 ‘Most important’ uses by learning activity ... 211
Figure 6.5 ‘Most important’ uses by type and learning activity ... 213
Figure 6.6 ‘Most important’ uses while 'getting oriented,' by site ... 215
Figure 6.7 ‘Most important’ uses while 'getting oriented' by type of course ... 216
Figure 6.8 'Most important' uses while 'choosing a topic' by site ... 219
Figure 6.9 'Most important' uses while 'choosing a topic' by type of course... 220
Figure 6.10 ‘Most important’ uses while 'developing a thesis’ by site ... 223
Figure 6.11 ‘Most important’ uses while 'developing a thesis’ by type of course ... 224
Figure 6.12 ‘Most important’ uses while ‘gathering evidence’ by site ... 228
Figure 6.13 ‘Most important’ uses while 'gathering evidence’ by type of course ... 229
Figure 6.14 ‘Most important’ uses while 'Finding secondary resources' by site ... 234
Figure 6.15 ‘Most important’ uses while 'Finding secondary resources' by type of course .. 234
Figure 6.16 ‘Most important’ uses while 'Creating a bibliography' by site ... 237
Figure 6.17 ‘Most important’ uses while 'Creating a bibliography’ by type of course ... 238
Figure 6.18 ‘Most important’ uses while 'Writing' by site ... 241
xx
Figure 6.20 ‘Most important’ uses while 'preparing a presentation' by site ... 245
Figure 6.21 ‘Most important’ uses while 'preparing a presentation' by type of course ... 246
Figure 6.22 Participation rates in factors of use by theme ... 252
Figure 6.23 Challenges by type of task and learning activity ... 288
Figure 6.24 Challenges by source and learning activity ... 289
Figure 6.25 How students overcame challenges ... 291
Figure 6.26 Top ranked uses by type... 292
Figure 7.1 In-person user scores by site ... 302
Figure 7.2 Distribution of preConfidence by site ... 313
Figure 7.3 Distribution of preConfidence by inperson_user ... 315
Figure 7.4 Distribution of diffConfidence by site ... 316
Figure 7.5 Distribution of diffConfidence by inperson_user ... 317
Figure 7.6 Distribution of diffConfidence by sConsultation………..318
Figure 7.7 Distribution of diffConfidence by usedReference...……….318
Figure 8.1 'Most important’ uses by type and learning activity ... 326
Figure 8.2 Learning activities and the Understanding Library Impacts framework ... 331
Figure 8.3 Learning activities during which challenges were encountered by type of task .. 334
1. Introduction
1.1 Research problem
The United States’ system of higher education has long been the envy of the world. Higher education institutions, including community colleges, four-year public institutions, private liberal arts colleges, and research universities, have the freedom to define unique missions and goals to support a range of educational experiences for students of varied backgrounds and interests and to meet a wide array of societal goals (Pascarella & Terenzini, 2005, p. 585). However, in recent years, concerns have been raised about access, affordability, and the quality of the outcomes of higher education (e.g. Kutner, et al. 2006; U.S. Department of Education, 2006a).
Higher education’s many stakeholders, including federal and state government, business interests, public interest organizations, and the consumers of higher education, students and their parents, want evidence that colleges and universities are delivering anticipated outcomes. While retention and graduation rates are important measures, evidence of student learning in college is the gold-standard in higher education accountability. The U.S. Department of Education’s Commission on the Future of Higher Education, otherwise known as the Spellings Commission, made forceful demands in its 2006 report, A Test of Leadership (U.S. Department of Education, 2006a). The commission called higher education institutions to measure and release “the results of student learning assessments, including value-added measurements that indicate how students’ skills have improved over time” (p. 24). Higher education has responded with new mechanisms for reporting the costs and outcomes of college such as the Voluntary System of Accountability (VSA, 2011) and the University and College Accountability Network (U-CAN, 2011).
2
Fortunately several organizations have devised ‘learning outcomes frameworks’ intended to support assessing and communicating student competencies within and across institutions. The Association of American Colleges and Universities, for instance, developed a set of Essential Learning Outcomes (AAC&U, 2007) expected of all undergraduate students. The AAC&U has also developed a set of meta-rubrics in the VALUE project (Valid Assessment of Learning in Undergraduate Education) to guide local assessment efforts of these outcomes (AAC&U, 2010). The Lumina Foundation has funded multiple ‘Tuning’ projects to define common expectations for student learning in specific disciplines such as history, chemistry, and education (e.g. Lumina, 2009; ICHE, 2009; TuningUSA, 2009; Brookins, 2012; Midwest Higher Education Commission, 2012). Tuning projects are led by faculty and are intended to create “a shared understanding among higher education’s stakeholders” (Lumina, 2009) of the competencies graduates should demonstrate at the conclusion of associate, bachelor’s, and master’s degrees. Another Lumina project resulted in the creation of the Degree Qualifications Profile, a framework for
communicating expectations for student competencies in broad abilities and skills at the associate, bachelor’s, and master’s degree levels (Lumina, 2011a).
Today’s undergraduate student has numerous information sources to choose from in his or her quest to accomplish academic and life tasks. Library collections and services, assigned readings, and the open web, are all valid sources. Friends and family are within reach of a text or instant message, while faculty members are an email away. However, his or her college or university has invested in the campus library for the purpose of providing traditional (print) and electronic information resources, services, and facilities to support his or her information needs. The institution and its stakeholders expect a return on investment through evidence that student use of the library has contributed to the intended outcomes of college. The Library and
3
2006; Oakleaf, 2010; Koltay & Li, 2010). This ‘academic library impact tools gap’ needs to be closed.
1.2 The ‘Understanding Library Impacts’ protocol
1.2.1 A conceptual framework
The Understanding Library Impacts (ULI) protocol is designed to fill the ‘academic library impact tools gap.’ A central challenge for assessment of any kind is selecting appropriate units of observation. The Understanding Library Impacts protocol focuses on the work tasks associated with ‘high-impact’ experiences within an undergraduate major. Students engaged in high-impact practices like writing-intensive coursework, capstone projects, and independent research projects work hard, interact with faculty and classmates in meaningful ways, and report higher learning gains than peers (Kuh, 2008). These are times when students are developing and demonstrating the competencies and abilities expected of college graduates, faculty expectations are at their highest, and student effort should be at its peak.
The decision to focus on work tasks associated with coursework in the academic major is derived from lessons from two research traditions: the literature of college impact and the
4
can influence levels of effort and engagement and integration with the academic and social life of the college (Weidman, 1989; Tinto, 1973). Furthermore, students’ choice of academic major influences the type of academic work they complete, how they are taught, the behaviors for which they are rewarded, and ultimately what and how much they learn (e.g. Pascarella and Terenzini, 2005; Chatman, 2007). Academic library impact assessment tools must take into consideration methodological lessons from this literature. These points are elaborated on in sections 2.1, 2.2, and 3.1.
The literature of information needs, seeking, and use strongly suggests that an
5
characteristics of anxiety and confidence can influence information seeking behaviors as well. This literature supports the creation of assessment tools which focus on work tasks carried out in the ‘real world’ instead of focusing on isolated information uses. The need to capture affective influences on information behaviors requires open-ended instruments which allow the voice of the user to emerge. I review this literature in section 2.5 and draw methodological conclusions in section 3.1.
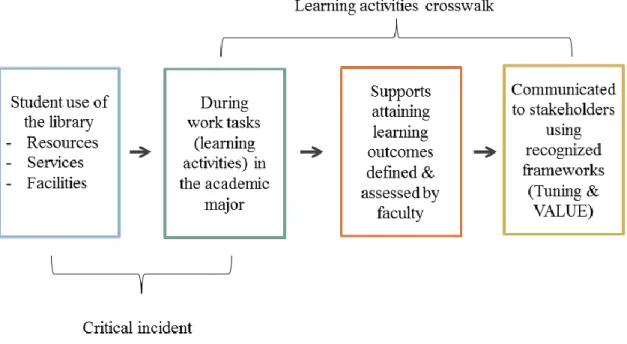
The conceptual framework for the ULI protocol (Figure 1.1) is based on the assertion that undergraduate students make purposeful use of library and information resources, services, and facilities during high-impact academic activities such as upper-level and capstone courses within the academic major. During this coursework, students strive to achieve learning objectives defined and assessed by teaching faculty and valued by institutional and external stakeholders. Finally, library impact on student learning can be communicated through general education and discipline-specific ‘learning outcomes frameworks’ like the Tuning outcomes and the VALUE rubrics.
6 1.2.2 Instruments
Two instruments support this framework: a learning activities crosswalk and a critical incident survey. Instrument design is guided by a definition of library impact provided by Caroline Wavell, Graeme Baxter, Ian Johnson, and Dorothy Williams:
“the overall effect of outcomes and conditioning factors resulting in a change in state, attitude or behaviour of an individual or group after engagement with the output and is expressed as ‘Did it make a difference?’” (2002, p. 7, emphasis in the original). The library impact challenge, therefore, has two parts. First, assessment tools should generate credible connections between student use of the library’s resources, services, and facilities and institutional goals for undergraduate student outcomes. Second, assessment tools should identify the conditioning factors of library use which help or hinder student achievement. It is not enough to generate correlations between library use and student learning; Library managers must understand why students choose to use or choose not to use the library, how this use supports their academic performance, and where students have problems. Managers need answers to these ‘how’ and ‘why’ questions to support improvement processes and resource allocation. The ‘Learning Activities Crosswalk’ and the critical incident survey help address these challenges.
The ‘Learning Activities Crosswalk’ connects student use of the library to faculty-defined expectations for student learning within the academic major. The protocol as evaluated in this study also demonstrates connections between library use and frameworks for broad abilities expected of undergraduates as expressed in four VALUE rubrics (AAC&U, 2010) and discipline-specific learning outcomes for graduates in History as defined in ‘Tuning’ projects conducted in Utah (TuningUSA, 2009) and Indiana (ICHE, 2010). The design for the crosswalk is discussed in chapter 5.
self-7
reported data as participants are asked to think back to a memorable time when they were engaged in the activity in question. Questions and probes identify factors which influenced task success or failure. Analysis of reports from multiple participants yields a general understanding of the factors which influence success and the obstacles which impede it. The CIT is discussed in detail in section 3.2 and the CIT instrument used in this study is reviewed in chapters 4 and 5 and reproduced in Appendix G.
1.3 Purpose and delimitations
The purpose of this methodological study is to evaluate the ULI framework and the ULI instruments in the context of undergraduate education in the discipline of history. The
instruments were designed to investigate library impact on student learning outcomes
expectations associated with upper-level and capstone undergraduate coursework in history. The framework is intended to be transferable to other disciplines, but the instruments would need to be altered accordingly. For instance, the protocol could be used to assess library impact on student learning in the domain of psychology, but the instruments would need to be tuned to match the learning outcomes expectations appropriate to that discipline. Further, the instruments would need to be adjusted to account for the deliverables and learning activities associated with psychology coursework, as well as the types of information services used during those activities. The findings of the current study are compatible with several models of information seeking behavior and consistent with findings from other studies of undergraduate students’ information use. Therefore, these findings may be transferable, but it is not my intent to suggest these findings are generalizable beyond the study population.
1.4 Design and research questions
8
2011; and four study sites participated in phase 2 during the summer and fall of 2011. A
‘Learning Activities Crosswalk’ for the discipline of history was constructed in phase 1 and tested in phase 2. Undergraduate students from all six sites completed the ULI survey, providing 127 critical incidents for analysis. Results from studies conducted during spring 2011 and fall 2011 are reported in chapters 6 and 7. This study was preceded by two interview-based studies conducted in 2005 and 2006 (Rodriguez, 2006, 2007). Summaries from the interview-based studies can be found in chapter 4.
The ULI framework is based on the assertion that undergraduate students’ information behaviors are influenced by the norms of the academic discipline associated with a student’s choice of academic major. Therefore, assessing the impact of library and information use on undergraduate student learning must take into consideration the nature and complexity of work tasks associated with the discipline and the pedagogical emphases reinforced by teaching faculty. Yet these influences are also expected to be mediated by the availability of needed resources, students’ awareness of those resources, student effort, and students’ personal characteristics. The first three research questions are intended to test these assumptions and investigate the value of the protocol for understanding the information behaviors of undergraduates enrolled in upper-level and capstone courses in history. Findings are compared with results from other studies of undergraduates’ information behaviors to assess theoretical agreement of the results and affirm the choice of the academic work task in the major as the unit of analysis. Questions four through eight were used to evaluate the instruments themselves and improve their value to libraries.
Research question #1: What library resources, services, facilities, and equipment (hereafter types of library use) do students in this study use to complete their projects? Research question #2: Does the choice of library use type vary by academic product (e.g.
9
Research question #3: What aspects of library use are found to help or hinder student efforts to achieve learning objectives associated with their academic work?
Research question #4: A premise of the ULI framework is that focusing on library use during high-impact coursework in the academic major will be an effective approach for demonstrating library impact on student learning. Does the ‘Learning Activities Crosswalk’ provide support for this assertion?
Research question #5: Are the CIT survey content categories and item response categories representative of respondents’ experiences using library related resources, services, and facilities in the course of their academic work?
Research question #6: Do open-ended questions in the CIT survey gather information about library impact that complement and augment data gathered in other parts of the instrument?
Research question #7: Do students’ reports of their behaviors regarding academic challenge and effort expended in learning activities as measured using external scales of student effort correlate with responses in other parts of the survey? If not, can retaining these external scales in future projects be justified?
Research question # 8: Do students recall incidents from one semester or one year ago as clearly as they recall recent incidents?
1.5 Significance of the current study
The Understanding Library Impacts protocol makes a unique contribution to
10
gathered in ULI studies can inform other measures, reveal new themes, and elicit rich user stories of library impact to support library advocacy efforts. The use of externally valid scales of student effort and links to the VALUE rubrics and Tuning framework for student learning outcomes increase the credibility of ULI results in the wider higher education community. The ULI protocol features a flexible design that may be adaptable for use in multiple disciplines (e.g. social sciences, natural sciences, humanities) and in a variety of post-secondary settings.
The protocol contributes to the user-oriented information needs, seeking, and use (INSU) literature as well. The ULI protocol features an original design grounded in theories and methods from the literatures of college impact and INSU. The protocol uses the Critical Incident
2. Literature Review
2.1 Evidence of student learning in college
2.1.1 Stakeholder demands for evidence of value for money
The benefits of a college degree to individuals and to society have long gone unquestioned. In 1999, the average annual earnings of U.S. workers with an undergraduate college degree were projected to be 1.8 times the earnings of an individual with a high school education. Over their lifetimes college graduates were projected to earn $2.1 million, compared with $1.2 million for high school graduates (Day & Newburger, 2002). Numerous societal benefits are also attributed to college attendance including increased tendencies toward civic activities like voting and community service (Pascarella & Terenzini, 2005). Likewise, college graduates enjoy a better quality of life as measured by indicators such as longevity and health, dedication to child development activities, short and long-term financial investments, and proportion of income spent on enriching activities like reading and cultural affairs. Furthermore, college attendance has intergenerational benefits as the children of college graduates demonstrate higher gains themselves in high school and college in knowledge acquisition and academic performance than do children of non-college graduates. Children of college graduates are five times more likely to earn a bachelor’s degree than first generation college students (Pascarella & Terenzini, 2005, p. 586-591).
Yet, as the second decade of the 21st century begins, three concerns have emerged among stakeholders in U.S. higher education: levels of participation in higher education, college
12
have completed at least an Associates’ degrees. As of 2011, 41% of young adults (25-34) in the United States had completed at least an associate degree, but this is only good enough to place the U.S. twelfth among OECD nations (OECD, 2011). And the Lumina Foundation projects that the U.S. will face a shortage of 23 million college graduates in the year 2025(Lumina, 2011b). The financial burden of attending college remains high as the costs of college continue to outpace median family income and standard cost of living indices. From 2000 to 2009, published tuition and fees at public 4-year colleges and universities increased at an annual average of 4.9% according to the College Board (College Board, 2009) outstripping 2.8% annual average
increases in the Consumer Price Index over the same periods (U.S. Department of Labor, 2009). The outcomes of higher education are increasingly called into question. Nationally only 59% of college students complete their 4 year degree within six years and there are significant discrepancies in completion rates between states and among minorities (Measuring Up, 2008 p. 7). There is also cause for concern regarding the competencies of college graduates. The National Assessment of Adult Literacy found forty three percent of the 19,000 adults surveyed performed at basic and below basic levels of prose literacy (Kutner, et al., 2006). Most troubling perhaps is that 45% of adults performing at these levels were college graduates. The National Survey of America’s College Students (NSACS) assessed literacy levels of over 1,800 students nearing the completion of their 2 and 4 year degrees in 2003 (American Institutes for Research, 2006) and found on average 20% of these students scored in the basic or below basic levels of quantitative literacy and fewer than 50% were proficient in the document literacies (p.19).
13
Conference Board study, Jill Casner-Lotto and Mary Wright Brenner (2006) surveyed 423 management and human resources professionals in American corporations to study employer perceptions of workforce readiness. While perceptions of preparedness for 4-year graduates exceeded that of the other groups, 27.8% of respondents reported 4-year graduates were deficient in written communications and leadership skills (p. 41). In this context stakeholders and
customers of higher education are demanding accountability from colleges and universities in the form of evidence of student learning.
2.1.2 Defining accountability
Peter Ewell, Vice President at the National Center for Higher Education Management Systems (NCHEMS), defines accountability in higher education as
“[t]he constellation of mechanisms that colleges and universities employ to demonstrate to their external publics that they are responsible stewards of the resources invested in them, that they are soundly managed, and that they produce the kinds of results that they are expected to produce” (Ewell, 2005, p. 104).
Ewell’s definition implies that institutions will be well-run, will deliver expected results, and will exhibit transparency in communicating with their stakeholders regarding this performance. Kevin Carey (2007) states that it is not enough to gather information regarding institutional
effectiveness but “real accountability systems push institutions to act on that information in a manner that is designed to change what they do in order to make them more successful than they would otherwise be” (p. 24). Carey’s definition implies that tools for accountability should communicate evidence students are learning in college and generate results which can be used to improve student performance.
14 2.1.3 Assessing gains in broad abilities and skills
Broad abilities are those skills and abilities that college graduates in all disciplines are expected to master. The Association of American Colleges and Universities (AAC&U) began work in 2005 on the program entitled Liberal Education and America’s Promise (LEAP): Excellence for Everyone as a Nation Goes to College. Introduced in a report from the National Leadership Council (NLC) (AAC&U, 2007), the project’s goals are to define essential learning outcomes needed by 21st century college graduates, create valid methods for measuring the degree to which students achieve those outcomes, and develop methods for communicating that achievement to stakeholders. The essential learning outcomes are liberal education outcomes that are applicable in all professions, transcend disciplines, and are essential for achievement in the workforce (Table 2.1). The authors note that employers do not want narrowly trained staff, but graduates “who are broadly prepared and who also possess the analytical and practical skills that are essential both for innovation and for organizational effectiveness (p. 16).” In the view of the NLC, these outcomes can only be achieved by focusing undergraduate learning on integrative learning that addresses the essential learning outcomes throughout the curriculum and in all disciplines.
15
Most early efforts at standardized assessment in U.S. higher education assessed students’ mastery of declarative knowledge (Shavelson, 2007). The Graduate Record Exam General Aptitude Test launched by ETS in 1949 was the first instrument designed to assess students’ verbal and reasoning skills (Shavelson, 2007). Richard Shavelson reports that ETS experimented in the 1960s and 1970s with constructed response methods to assess “communication skills, analytic thinking, synthesizing ability, and social/cultural awareness” (p. 10). For a time, the ACT’s College Outcomes Measures Project (COMP) also experimented with open-ended assessments of performance such as real-world content and multiple choice, short answer, and essay questions to assess three process skills “communicating, solving problems, and clarifying values” (p. 11).
Table 1.1 Essential Learning Outcomes identified by the AAC&U LEAP Project Knowledge of Human Cultures and the Physical and Natural World
Acquired through study in the sciences and mathematics, social sciences, humanities, histories, languages, and the arts
Intellectual and Practical Skills, including Inquiry and analysis
Critical and creative thinking Written and oral communication Quantitative literacy
Information literacy
Teamwork and problem solving Personal and Social Responsibility, including
Civic knowledge and engagement—local and global Intercultural knowledge and competence
Ethical reasoning and action Foundations and skills for lifelong learning
Integrative and Applied Learning, including
Synthesis and advanced accomplishment across general and specialized studies Source: Adapted from American Association of Colleges and Universities, 2007.
2.1.3.1 The Voluntary System of Accountability
16
agree to use standard assessments and produce a publicly available College Portrait which provides data in three areas: 1) consumer information, 2) student perceptions of the college experience, and 3) student learning outcomes (NASULGC, 2010; Miller, 2008). Value-added models of assessing gain in cognitive abilities due to attending college are central to the VSA. Value-added models assert that students enter college with a varying degree of talents and abilities as evidenced by pre-college scores on standardized tests like the SAT and the ACT, differences that must be controlled when computing gains in learning. A common statistical method of controlling for these differences is regression of post-college test scores with pre-college test scores which “removes the relationship between pre-test and test from the post-test score” (Pike 2006a, p.5). The remaining variance is attributed to institutional effectiveness. Institutions using the VSA to report learning gains in this manner are expected to first predict expected scores on one of the three valid instruments based on students’ pre-college scores on the SAT or ACT. Actual scores on the chosen assessment can be compared with expected scores to compute gain or loss during college. Institutions are expected to report student learning outcome performance in one of five categories: Well Above Expected, Above Expected, At Expected, Below Expected, and Well Below Expected (National Association of State Universities and Land-Grant Colleges, 2010).
The Collegiate Learning Assessment (CLA), developed by the Council for Aid to
17
“Only through extensive engagement, practice, and feedback within a particular subject area does learned knowledge become sufficiently decontextualized to enable it to transfer to the realm of enhanced reasoning, problem-solving, and decision-making skills
exercised in broader or multiple domains.” (2003, p. 13).
As currently configured, the CLA features a set of performance tasks. Derived from real-world scenarios, performance tasks provide test-takers with a problem and a set of documents, some relevant to solving the problem and some not. Students use the documents to recommend a solution to the problem and write a memorandum explaining the solution (Shavelson, 2007, p. 31). The CLA is administered to a sample of students at the end of their freshman year and again at the end of their senior year. Shavelson argues that the CLA offers several advantages over other assessments. The CLA includes open-ended tasks based on real world problems to assess critical thinking, reasoning, and written communication skills expected of graduates in any academic major. Just as computer technology made large scale multiple-choice tests feasible through automated scoring in the 1940s, internet delivery and natural language processing
software simplifies CLA administration and scoring. The use of sampling reduces the test burden on individual students, yet still allows comparing student results by institution and academic program. Scores can also be compared to other measures such as SAT or ACT scores to assess gain during college (Shavelson, 2007, p. 32).
18
Residual scores reflect the deviation of the actual scores from the scores predicted by the model. These scores represent the “portion of the post-test score that is not predicted by the model” (p. 79) – in other words, student gains beyond what was predicted by their freshman score. Pike reported that only 17% of the variance in the scores could be attributed to true differences between the groups (p.79).
The CLA uses cross-sectional sampling to recruit students to take the exam. Unlike a longitudinal design, different sets of students take the CLA freshman year and senior year. Victor Borden and John Young (2008) question the validity of drawing conclusions from cross-sectional samples considering the rates of attrition seen in U.S. institutions of higher education. Borden and Young suggest that students who persist through senior year will be more highly motivated and identify more with the institution than those who drop out. That is, the cohorts are no longer comparable raising doubts about conclusions that increases in scores can be attributed solely to “the impact of instruction” (Borden and Young, 28). Non-selective institutions will also be at a disadvantage. The student bodies at non-selective institutions present a wider range of
preparedness and higher levels of attrition than found at selective institutions, resulting in greater heterogeneity between freshman and senior samples (Garcia, 2007) and making comparisons between institutions of these types meaningless.
2.1.3.2 Authentic Assessment: The AAC&U VALUE Rubrics
The AAC&U VALUE project (Valid Assessment of Learning in Undergraduate
19
The AAC&U devised the VALUE (Valid Assessment of Learning in Undergraduate Education) rubrics for assessing student e-portfolios or other academic work in each of the fifteen LEAP essential learning outcomes (Association of American Colleges and Universities, 2010). Faculty and curriculum specialists participated in workshops and other venues to create the fifteen rubrics (see Table 2.2) which identify abilities associated with each outcome and defines benchmark, milestone, and capstone performance expectations. For instance, the problem solving rubric defines six progressively complex tasks (defining the problem, identifying strategies, proposing solutions, evaluating potential solutions, implement solution, and evaluate outcome) and performance expectations from benchmark through capstone levels. The rubrics are
intended to be localized for use at various campuses and by different disciplines for formative and summative purposes. Demonstrating accountability with the rubrics might be performed by first assessing a sample of student work and communicating performance as percentages. For instance, an institution could report that 90% of graduating seniors met capstone criteria in critical and creative thinking (Rhodes, 2008). While the funding for the VALUE project was depleted by 2010, the AAC&U continues to promote the essential learning outcomes and the VALUE rubrics in several of its projects. Ashley Finley (2012) reported early findings from reliability testing of the critical thinking VALUE rubric in February, 2012. Forty faculty
members convened to assess student work using the rubric and their scores were compared. The multi-rater kappa statistic for ‘perfect’ agreement was .29 and kappa for approximate agreement was .52. Finley recognized further work was needed, but the AAC&U reported encouragement by these findings.
Table 2.2 AAC&U VALUE rubrics
Civic engagement Inquiry and analysis Problem Solving Creative thinking Integrative thinking Quantitative literacy Critical thinking Intercultural knowledge Reading
Ethical reasoning Lifelong Learning Teamwork
20 2.1.4 Surveys of student experience
Surveys of student experience have long been used to support studies of institutional effectiveness and to support planning. Surveys of the college experience have also been used as tools of accountability.
2.1.4.1 College Student Experiences Questionnaire (CSEQ)
C. Robert Pace developed the College Student Experiences Questionnaire (CSEQ) as a means of measuring the quantity and quality of effort that students expended in their college coursework (Pace, 1984a, 1984b; Trustees of the University of Indiana Bloomington, 2012a, 1998). Fourteen categories of items make up the CSEQ, covering student use of facilities such as the library, classroom, gymnasiums, student union, and labs as well as their participation in activities such as interacting with faculty, writing, and extracurricular activities. Students answer questions in each category, indicating how frequently they participate in each activity using a 4 point scale: never, occasionally, often, and very often. The effort required to complete activities increases with each question answered in each category. For instance, the first question in the Computer and Information Technology section of the survey asks how frequently the student ‘used a computer or word processor to prepare a paper reports or papers.’ The last question in this section ostensibly requires more effort: ‘developing a web page or presentation.’ The survey also includes questions regarding student perceptions of the degree to which the college
environment emphasized student development in a variety of characteristics, perceptions of students’ relationships with peers, staff, and faculty at their institution, and demographic data. The survey closes with an estimate of gains on important cognitive, social, and personal measures during college (Pace, 1990, p. 9 – 19). Subject to extensive pretesting and validation, the CSEQ has been in continuous use since 1979.
21
diversity among institutions within each type. Further, the instrument revealed that students who exert more effort to produce high quality work and are more involved in the life of the university report higher gains than their peers (Pace, 1990, p.115 – 133). These findings have generated a deep interest in identifying effective practices of education that support student engagement. Since its creation, numerous studies have been conducted using CSEQ data on the topics of the college environment, the impact of student involvement on learning, impact of work and off-campus housing on levels of engagement and perceived gains, and on the experiences of certain classes of students such as first-generation students and athletes, and the experiences of students at specific types of institutions, such as liberal arts colleges (Trustees of the University of Indiana Bloomington, 2012a).
2.1.4.2 National Survey of Student Engagement
The National Survey of Student Engagement (NSSE) was the product of a Pew
Charitable Trusts funded initiative to improve undergraduate education in the 1990s. The Trusts commissioned the National Center for Higher Education Management Systems (NHCMS) to design and validate the instrument. Launched in 2000, the NSSE is a survey instrument delivered to first and fourth-year students to explore student college experiences and perceptions. The instrument (National Survey of Student Engagement, 2012) underwent extensive testing with focus groups and cognitive interviews to refine the survey questions (Kuh, 2003; Ouimet et al., 2004) and several rounds of pilot tests at 72 institutions.
NCHMS drew upon the latest research in higher education quality and only included items on the survey if “there was a clear empirical case in the literature on college student
22
experiences with “active and collaborative learning” activities such as group projects. Students also respond to questions about activities associated with “student-faculty” interaction including in-class and out-of-class contact with professors. Engagement in “enriching activities” including internships, community service, capstone and writing-intensive coursework, and study abroad is addressed in other questions. First-year students are asked whether they have done or plan to participate in these activities. Comments are elicited on how supportive the student found the campus environment including the perceived availability of academic support services and the degree to which the student took advantage of them. Finally, students are asked to estimate the degree to which their gains in knowledge, skills, and personal growth can be attributed to their college experience and to comment on their overall satisfaction with the institution. The conceptual grounding for the survey’s design is credited for lending the survey legitimacy in the higher education accountability community (Kuh, 2003).
The NSSE is administered on an annual basis. Over 600 institutions participated in 2010 and a cumulative 2.3 million student responses have been received since 2000. The results are reported nationally by Indiana University (e.g. National Survey of Student Engagement, 2010c). Individual institutions receive peer-comparison reports and a dataset of results for the institution for further analysis.
Table 2.3 Benchmarks of Effective Educational Practice
Level of Academic Challenge Measures time spent in an average week on various activities such as writing papers, reading, and preparing for class and perceptions of the emphasis placed on higher order learning activities
Active and Collaborative Learning
23 Continued
Student-Faculty Interaction Measures the degree to which students interact with faculty including discussion of grades or
performance, discussing issues outside of class, participating in research projects with faculty, and discussing career plans with faculty
Supportive Campus Environment Measures the degree to which the campus environment helps students cope with academic, personal, and social challenges and the quality of relationships with members of the campus community.
Enriching Educational Experiences
Measures the degree to which students participate in complementary activities outside the classroom that reinforce the curriculum including talking with students of different backgrounds and participation in supplementary activities such as community service, internships, study abroad, independent studies, and culminating senior experiences.
Adapted from National Survey of Student Engagement, 2010a 2.1.4.3 The Deep Learning Scale
NSSE data have been used to identify high performing institutions for follow up study. A project called Documenting Effective Educational Practices (DEEP) involved a two-year study of twenty institutions with higher than expected graduation rates and higher than predicted results on the NSSE (Kuh, et al., 2005). The DEEP researchers sought to identify best practices at these outperforming institutions and to determine if those practices can be replicated at other
24
learning and a philosophy of improvement and change that is embedded in the campus culture (Kuh, et al. 2005).
Thomas F. Nelson Laird, Rick Shoup, and George Kuh (2006) identified 12 questions from the College Report which make up the Deep Learning Scale (Appendix A). Deep learning behaviors are those in which students possess a “personal commitment to focus on the substance and meaning of material (p. 4)” as contrasted with surface learning in which the student’s goal is to get by with rote learning and memorization for the purposes of avoiding failure. Nelson Laird, Shoup, and Kuh (2006) ran exploratory and confirmatory factor analyses of responses to a battery of questions from the 2004 and 2005 NSSE survey regarding three deep learning behaviors: higher order learning, integrative learning, and reflective learning. Their factor analysis found 3 item groupings that explained 60% of the variance in the model. They also found a high level of correlation among the factors, suggesting a second order factor was in play. They termed this underlying factor the “Deep learning scale” (p. 13-14). These results were also found in a confirmatory study using results of the 2004 administration of NSSE. Another study conducted by the same team found that students who reported participating in deep learning approaches were more likely to report gains in college (Nelson Laird, et al. 2008).
Gary Pike (2006b) proposed the use of NSSE scalelets, or “clusters of highly related survey questions representing the experiences of a group of students” (p. 178). Using 50
questions, Pike defined 12 scalelets focusing on aspects of the college experience such as ‘course challenge,’ ‘writing’, and ‘support for success’ and found each scalelet produced reliable
25 2.1.4.4 NSSE as an instrument of accountability
While the NSSE seems well-suited for supporting internal improvements within an institution, it has emerged as a tool for communicating accountability as well. This should not be a surprise since the project was launched in part as a response to the prevalence of reputation-based rankings publications such as those published by the U.S. News and World Report. NSSE results are also expressly prepared for release to the public since its inception through the annual report and by individual campuses and states. The explicit use of NSSE results as a tool of accountability is not without its controversy.
Concerns about the sensitivity of NSSE for detecting differences between institutions are among the most common criticisms. NSSE itself reports that comparing institutions based on levels of engagement is deceiving since in 2008 “for almost all of the benchmarks, less than 10% of the total variation in effective educational practices is attributable to institution” (National Survey of Student Engagement, 2008, p. 7) and that readers of the NSSE reports should look within institutions for variation by discipline, student characteristics, or enrollment type to support internal improvements (Kuh, 2007).
Other critics focus on the fact that gains estimates are self-reported, not measured objectively. Several reports suggest that the responses on the benchmark questions correlated with self-reported gains (e.g. Nelson Laird, et al. 2008), but connecting engagement results to objective measures of learning are a separate challenge indeed. As Ernest Pascarella, Tricia Seifert, and Charles Blaich (2009), point out, students are differentially “receptive to the effects of postsecondary education” (p. 8). Relying on self-reports about student gains in the absence of controls for pre-college measures for this predisposition challenges the internal validity of the instrument. Using data gathered during the Wabash National Study, 2006-2009 (Wabash National Study, 2009a, 2009b), Pascarella, Seifert, and Blaich investigated this issue in a
26
objective assessments to establish baseline measures of cognitive and personal development and completed a survey of demographic characteristics and precollege traits and experiences. In the spring of 2007, the same students completed the NSSE College Student Report and repeated the objective assessments. They found statistically significant, but modest evidence that the NSSE benchmarks and Deep Learning Scale were valid predictors of gains in “effective reasoning and problem solving, well-being, inclination to inquire and lifelong learning, intercultural
effectiveness, leadership, moral character, and integration of learning” (p. 30-31). Specifically they found that student responses to questions regarding teaching quality and interactions with faculty, academic challenge, diversity experiences, and the Deep Learning Scale were valid but modest predictors of first year gains.
A study conducted at Georgia Tech University using NSSE results from 2005 (Gordon, J., Ludlum, J., Hoey, J.J., 2008) explored the convergent validity of the NSSE benchmark scales with less than impressive results. The authors define convergent validity as “the degree to which an instrument and the interpretations based on that data agree with other sources of information (p. 21).” None of the Benchmarks was able to explain more than 1% of the variance in freshman to sophomore year retention and contributions to GPA, job attainment, and plans for further education were minimal (p.26). Pike’s scalelets were also tested and found to be modestly better at predicting outcomes but explained less than 2% of GPA and .5% of the variance in retention (p. 31-32). Finally, they regressed each of the 41 NSSE items individually and found that only 15 were significant predictors of the outcomes of interest in the 2005 data. However, the models failed to predict outcomes when used with NSSE data gathered at Georgia Tech in 2003.
27
A study by Robert Carini, George Kuh, and Stephen Klein (2004) used critical thinking and performance tests developed by the RAND Corporation, GRE essay prompts, and college reported GPA measures, each standardized to an SAT-scale to assess the relationship between levels of engagement and student performance. They controlled for pre-college SAT scores, which explained between .48 and .55 of the variance in the RAND and GRE scores. Small but statistically significant impacts on RAND scores were observed between level of academic challenge, supportive campus environment, reading and writing, and institutional emphases on good educational practices (partial correlations from .09 to .11). Level of academic challenge and reading and writing were correlated with higher GRE scores (p. 11-12). They also found low-ability students with pre-college SAT scores below 1030 demonstrated higher gains attributable to levels of engagement than high-ability students (p.16). When comparing institutions, they found high-performing institutions were better able to convert engagement into improved
performance. However levels of engagement only accounted for a small proportion of the overall gains.
2.1.5 Discipline specific knowledge and abilities
28 2.1.5.1 About History
The discipline of history is broadly defined as the study of the past (Gonzales & Wagenaar, 2005, p. 98) and is a popular major for undergraduates in Europe and the United States. As Michael J. Galgano writes, history entails the “systematic reconstruction of human actions and events, ordered chronologically or topically and firmly rooted in the evidence” (2007). The study of history is not about reporting the past as a series of events but involves examining and interpreting evidence to explain both how and why certain events transpired (Katz and Grossman, 2008).
Historians derive much of their evidence from primary sources and documents produced by actors in the historical events and time periods under study. Stanley Katz and James
Grossman note that students are taught the methods of history so as to gain “the capacity to sift through masses of information and determine what matters, and a capacity for closely reading various texts” (Katz and Grossman, 2008 p. 2). In recent years, internet technologies and mass digitization has ‘democratized’ access to primary sources for historians and students alike
(Galgano, 2007). Historians also use artifacts, oral histories, recordings, and images as sources of evidence.