ANTIMICROBIAL STEWARDSHIP PROGRAMS: IMPLICATIONS FOR RESISTANCE RATES & QUALITY OF CARE IN HOSPITALS
Alessandra Bassalobre Garcia Reeves
A dissertation submitted to the faculty at the University of North Carolina at Chapel Hill in partial fulfillment of the requirements for the degree of Doctor of Philosophy in the Department of Health Policy and Management in the Gillings School of Global Public Health.
Chapel Hill 2019
© 2019
iii ABSTRACT
Alessandra Bassalobre Garcia Reeves: Antimicrobial Stewardship Programs: Implications for Resistance Rates & Quality of Care in Hospitals
(Under the direction Morris Weinberger)
Each year, two million Americans acquire serious infections caused by bacteria that are resistant to antibiotics resulting in significant morbidity, mortality, health care utilization and costs. Despite the recent passage of an antimicrobial stewardship programs (ASP) mandate in California and the Centers for Disease Control and Prevention (CDC) guidelines for a minimum standard ASP in hospitals, literature on the impact of ASPs on antimicrobial resistance (AMR) rates in hospitals is sparse.
The long-term goal of this study is to provide reliable evidence to influence policies and practices to reduce AMR and improve quality and clinical outcomes in hospitals. The overall objective of this study was to investigate the impact of ASP adoption, including the effect of a mandate in California and compliance with the CDC’s 7 core elements on methicillin-resistant Staphylococcus aureus (MRSA) and Clostridioides difficile (C. diff) in acute care hospitals. Then, we investigated their impact on selected quality and clinical outcomes.
In paper 1, we estimated the impact of passing an ASP mandate in California on hospital on MRSA and C. diff rates using 2013-2017 hospital-level data and a difference-in-difference with hospital fixed effects (FE) design. We found that, compared to hospitals in other states, California hospitals had significant (p<0.05) increases of 23%, 30%, and 20% in their MRSA SIR in 2015, 2016 and 2017, respectively. We also observed a 20% (p<0.001) decrease in their C. diff SIR in 2017.
Paper 2 examined the effect of statewide adoption of the CDC’s ASP 7 core
between 2014 and 2016 increased in all states. A one percentage point increase in ASP compliance was associated with a 0.3% decrease (p<0.01) in C. diff infections in 2016 relative to 2014. We did not find an effect on MRSA infections.
In paper 3, we measured the association between rates of MRSA/C. diff and quality and clinical outcomes in US acute care hospitals using 2013-2017 hospital-level data and a hospital FE model. We found no association of MRSA or C. diff with 30-day readmissions, length of stay, 30-day mortality and intensive care unit days.
In summary, this study examined the various effects of an ASP state mandate and adoption of the CDC’s 7 core elements, as well as the relationship between AMR and quality and clinical outcomes in hospitals. Our findings help fill important knowledge gaps and can assist policymakers and healthcare administrators make informed decisions on the
v
My parents taught my brothers and I to work diligently, with excellence, but they never intended to have one of their children live in a different country, even to pursue a prestigious
degree. I know it was not easy.
ACKNOWLEDGEMENTS
I would like to extend my sincere and heartfelt gratitude to everyone who helped me in the endeavor of completing this research work:
My dissertation committee, for giving me excellent advice and guiding me through the development of this research.
My advisor, Morris Weinberger, for his constant support and for believing in me since the first day I arrived the United States. I am fortunate to have a true mentor.
My classmates from the PhD 2015 Cohort, for their friendship, support and brilliance throughout these four years.
Bristol-Myers Squibb for the pre-doctoral fellowship, and Shawn Li for the support and opportunities to improve the skills I learned during my doctoral program.
My husband, Jackson. His unyielding love, support and encouragement have enriched my soul and inspired me to work hard until the end. He has made me coffee every morning and margaritas every Friday since the first week of our marriage.
My parents, brothers, Brazilian family and friends, for proving the importance of having a solid and safe harbor to come back to when sailing into distant waters.
vii
TABLE OF CONTENTS
LIST OF TABLES ... x
LIST OF FIGURES ... xi
LIST OF ABBREVIATIONS ... xii
CHAPTER 1. INTRODUCTION ... 1
Background ... 1
Specific Aims ... 2
Significance ... 3
Innovation ... 4
CHAPTER 2. OVERALL METHODS ... 6
Conceptual Framework ... 6
Approach ... 6
Sample ... 10
Ethical Procedures ... 11
Figures & Tables ... 12
CHAPTER 3. IMPACT OF CALIFORNIA’S MANDATE FOR ANTIMICROBIAL STEWARDSHIP PROGRAMS ON RATES OF METHICILLIN-RESISTANT STAPHYLOCOCCUS AUREUS AND CLOSTRIDIOIDES DIFFICILE IN ACUTE CARE HOSPITALS ... 16
Overview ... 16
Introduction ... 17
Methods ... 19
Data sources ... 19
Subjects ... 20
Measures ... 20
Analysis ... 21
Discussion ... 23
C. diff SIR decreased after the mandate ... 23
MRSA SIR increased after the mandate ... 23
MRSA and C. diff SIR increased in 2015 ... 24
Other ASP initiatives ... 25
Limitations ... 25
Conclusion & Policy Implications ... 26
Figures & Tables ... 28
CHAPTER 4. ASSOCIATION BETWEEN STATEWIDE ADOPTION OF THE CDC’S 7 CORE ELEMENTS OF ANTIMICROBIAL STEWARDSHIP PROGRAMS AND RATES OF METHICILLIN-RESISTANT STAPHYLOCOCCUS AUREUS AND CLOSTRIDIOIDES DIFFICILE IN US STATES ... 32
Overview ... 32
Introduction ... 33
Methods ... 35
Data sources ... 35
Subjects ... 35
Measures ... 36
Analysis ... 37
Results ... 37
Discussion ... 38
ASP associated with decreased C. diff infections ... 39
No effect on MRSA infections ... 40
Limitations ... 40
Conclusion & Policy Implications ... 41
Figures & Tables ... 43
CHAPTER 5. ARE RATES OF METHICILLIN-RESISTANT STAPHYLOCOCCUS AUREUS AND CLOSTRIDIOIDES DIFFICILE ASSOCIATED WITH QUALITY AND CLINICAL OUTCOMES IN US ACUTE CARE HOSPITALS? ... 47
ix
Introduction ... 48
Methods ... 49
Data Sources ... 49
Subjects ... 49
Measures ... 50
Analysis ... 51
Results ... 51
Discussion ... 52
30-day readmissions ... 52
Length of stay ... 53
30-day mortality ... 54
ICU days ... 55
Limitations ... 56
Conclusions & Policy Implications ... 56
Tables ... 58
CHAPTER 6. SUMMARY OF FINDINGS AND POLICY IMPLICATIONS ... 61
Summary of Findings ... 61
Implications for Practice and Policy ... 63
Future Research ... 64
APPENDIX A: CHAPTER 4 SUPPLEMENTAL TABLES ... 66
APPENDIX B: CHAPTER 5 SUPPLEMENTAL TABLES ... 69
LIST OF TABLES
Table 2.1 Data source and variables description for aims 1-3, 2013-2017 ... 14 Table 3.1 Descriptive statistics for MRSAa and C. diffb model by California
versus other states in 2013 ... 30 Table 3.2 Regression-adjusted estimates for the effect of the ASPa mandate
in California on MRSAb and C. diffc SIRsd, 2013-2017 ... 31 Table 4.1 Descriptive statistics for MRSAa and C. diffb models, 2014-2016 ... 44 Table 4.2 Regression-adjusted estimates for the association between
%ASPsa meeting CDC’s 7 core components and MRSAb SIRsc, 2014-2017 ... 45 Table 4.3 Regression-adjusted estimates for the association between
%ASPsa meeting CDC’s 7 core components and C. diffb SIRsc, 2014-2017 ... 46 Table 5.1 Descriptive statistics for models where MRSAa or C. diffb are the
explanatory variable, 2013-2017 ... 58 Table 5.2 Regression-adjusted estimates for the association between MRSAa
SIRb and quality and clinical outcomes in acute care hospitals, 2013-2017 ... 59 Table 5.3 Regression-adjusted estimates for the association between C.diffa
SIRb and quality and clinical outcomes in acute care hospitals, 2013-2017 ... 60 Appendix Table A.1 Descriptive statistics for hospital-level MRSAa and C. diffb
models, 2014-2016 ... 66 Appendix Table A.2 Hospital-level regression-adjusted estimates for the
association between %ASPsa meeting CDC’s 7 core components and MRSAb
SIRsc, 2014-2017 ... 67 Appendix Table A.3 Hospital-level regression-adjusted estimates for the
association between %ASPsa meeting CDC’s 7 core components and C. diffb
SIRsc, 2014-2017 ... 68 Appendix Table B.1 Descriptive statistics for hospitals not included in the
models where MRSAa or C. diffb were the explanatory variable, 2013-2017. ... 69 Appendix Table B.2 Regression-adjusted estimates for the association
between MRSAa SIRb and quality and clinical outcomes after inclusion of
CLABSI and CAUTI variables, 2013-2017 ... 70 Appendix Table B.3 Regression-adjusted estimates for the association
between C.diffa SIRb and quality and clinical outcomes after inclusion of
xi
LIST OF FIGURES
Figure 2.1 Conceptual framework based on Donabedian23 ... 12 Figure 2.2 Inclusion and exclusion criteria for hospitals participating in the
study ... 13 Figure 3.1 SIRa for MRSAb in California versus other states, 2013-2017 ... 28 Figure 3.2 SIRa for C. diffb in California versus other states, 2013-2017 ... 29 Figure 4.1 Increase in Antimicrobial Stewardship Programs (ASP) meeting
LIST OF ABBREVIATIONS AMR antimicrobial resistance
ASPs antimicrobial stewardship programs C.diff Clostridioides difficile
CAUTI catheter-associated urinary tract infections CDC Centers for Disease Control and Prevention CLABSI central line-associated bloodstream infections CMS Centers for Medicare & Medicaid Services DID difference-in-difference
FE fixed effects
HAIs healthcare-associated infections ICU intensive care unit
IRB Institutional Review Board
JC Joint Commission
LoS length of stay
MRSA Staphylococcus aureus
NHSN National Healthcare Safety Network
SB Senate Bill
SD standard deviation
SE standard error
SHEA Society for Healthcare Epidemiology of America SIR standardized infection ratio
SSI select surgical site infections
US United States
VA Veterans Affairs
1
CHAPTER 1. INTRODUCTION Background
Each year, as many as 2 million Americans will acquire serious infections caused by bacteria that are resistant to one or more antibiotics resulting in 23,000 deaths, $20 billion in direct healthcare costs, and $35 billion in overall societal costs1. A major modifiable driver of antimicrobial resistance (AMR) is antibiotic prescribing and utilization practices2: up to 50% of antibiotic prescriptions are neither necessary nor appropriate in outpatient and inpatient settings1,3.
Antimicrobial stewardship programs (ASPs) are universally recognized as essential tools in infection control throughout the healthcare system4. ASPs are associated with shorter hospitalizations and decreased antimicrobial consumption5. Studies on the effectiveness of ASPs are relatively recent and use varied assessment perspectives6,7. However, the impact of ASPs on actual AMR rates in hospitals is uncertain5 or not explored.
Specific Aims
I test my central hypothesis by pursuing the following specific aims:
Aim 1: Estimate the impact of passing an ASP mandate in California on hospital methicillin-resistant Staphylococcus aureus (MRSA) and Clostridium difficile (C. diff) rates. My hypothesis is that after July 2015, MRSA and C. diff rates dropped significantly in
California compared to hospitals in other states. I use 2013-2017 HospitalCompare data and a difference-in-difference with hospital fixed effects (FE) design to estimate the effect of passing this bill.
Aim 2: Examine the association between statewide adoption of the CDC’s 7 Core Elements of ASP and hospital MRSA and C. diff rates. Myhypothesis is that states with a higher percentage of compliance to the CDC’s 7 core elements for ASPs will have
significantly lower MRSA and C. diff rates. States’ percentage of adoption of the 7 core components over time (2014-2016) were retrieved from the CDC’s Patient Safety Atlas dataset. I use 2014-2016 HospitalCompare data and fixed effects (FE) regressions to estimate this association.
Aim 3: Measure the association of MRSA and C. diff rates with quality and clinical outcomes in hospitals nationwide.My hypothesis is that higher rates of MRSA and C. diff in acute care hospitals are related to higher rates of 30-day hospital readmissions, 30-day mortality, longer length of hospital stay and more intensive care unit (ICU) days in US hospitals. To test these hypotheses, I use a hospital FE model and 2013-2017
HospitalCompare data.
3 Significance
ASPs in hospitals shape prescribing practices and are intended to reduce the
emergence of AMR. In hospital settings, ~40% of inpatients will receive antimicrobial agents as part of their treatment8; a large share of those prescriptions is neither necessary nor appropriate1. These sub-optimal practices are, at least in part, responsible for the
emergence of AMR. Strategies to promote careful, discriminatory use of antimicrobial drugs can reduce AMR9. ASPs are universally recognized as essential tools in infection control throughout the healthcare system4. For example, formulary restrictions (or preauthorization), the most common type of ASP, can be especially impactful if enforced5 because they directly address prescribing practices, preventing overuse and misuse of antimicrobials10–12.
The assessment of ASPs is incipient and has not been standardized across studies in different states. Virginia and Kansas, for example, were assessed for their ASPs with different criteria7,13, and a nationwide survey found that only 39% of acute care hospitals implemented CDC’s 7 core elements of ASPs6. California is the only state that currently has an ASP mandate with specific requirements for hospitals. One study investigated how implementation of hospital ASPs changed after the passage of the mandate in California; however, it did not address its impact on hospital resistance rates14.
There is uncertainty around ASPs that are truly effective and the extent to which they affect AMR and quality metrics. A recent meta-analysis found that formulary restriction ASPs are associated with shorter hospitalizations and decreased general and restricted (broad spectrum) antimicrobial consumption and costs. However, results from the included studies were mixed5, which is probably because the type and characteristics of ASPs were not addressed in detail. Whether or not ASPs meet the CDC’s 7 core components were not addressed in those studies.
In summary, this research is significant because:
1) It will shed light on a major, persistent patient safety and healthcare quality
problem within hospitals. Although preventable, AMR remains a prevalent, costly and deadly problem at the intersection of healthcare quality and safety. AMR also threatens global health security because of its potential to spread across patients, hospitals and countries1,21. This research seeks to unpack the effectiveness of an ASP mandate and the 7 core
elements in preventing the emergence of AMR.
2) It addresses important gaps in the literature by providing a picture of how AMR may affect quality and clinical outcomes. A better evidence-based understanding of this relationship is important because it will help healthcare settings improve efficiency of their services and patient outcomes by preventing adverse events and the spread of resistant strain bacteria.
3) Understanding the impact of ASPs on AMR rates may have significant policy implications. The knowledge generated from this study can assist policymakers and healthcare administrators make informed decisions on implementing effective ASPs.
Because most states do not have a mandate for ASPs, findings from this study could provide evidence for a minimum standard ASP to be required by state mandates in the future.
Innovation
5
rates, a small number of newly-developed antimicrobial agents22, and its potential to spread across patients, hospitals and countries21. Most research to date has collected
non-standardized information on ASP6,7,13 and used prescribing practices, rather than AMR rates, as the outcome. One major challenge to previous research is that information on ASPs are not easily found in publicly available datasets.
This study is innovative because it represents a departure from the status quo by shifting focus to the effects of ASP as defined by the CDC on actual rates of AMR. We combined data from different sources to test hypotheses about the relationship between ASP and AMR using MRSA and C. diff infections as models. In our study, we combined state-level rates of compliance with the CDC standard for hospital ASPs with publicly available hospital-level MRSA and C. diff rates. This unique dataset allowed us to examine the association between CDC-standard ASPs and AMR rates. Because there are likely unmeasured hospital characteristics confounding this relationship, we will use a time and hospital fixed effects approach for more consistent estimates.
CHAPTER 2. OVERALL METHODS Conceptual Framework
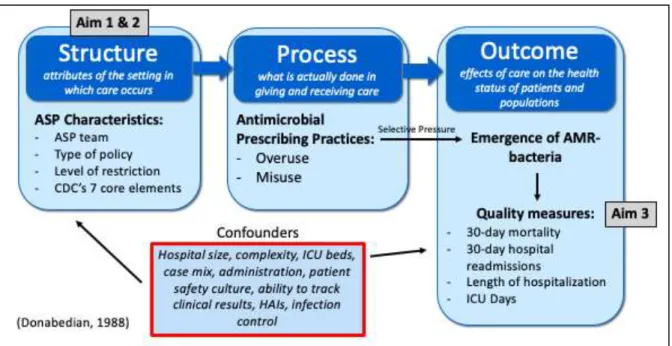
The conceptual model for this study is adapted from Donabedian23, which uses three categories of healthcare quality: structure (physical structure, financing model, equipment and staff), process (interactions and process through which care is delivered to patients) and outcomes (effects on quality metrics and health outcomes of patients)23. The ASP types, teams and characteristics (e.g., whether they meet CDC’s 7 core components of ASP) are structural characteristics of a hospital that have the potential to directly shape antimicrobial prescribing (process) and, in turn, AMR rates through antimicrobial selective pressure (outcomes). AMR rates will affect other quality outcomes as a result (Figure 2.1). The box with confounders lists potential factors that could impact both ASP (main explanatory variable) and AMR rates (main outcome).
Antimicrobial selective pressure is the main driver of AMR. Any bacteria can develop resistance through continuous exposure to routinely used antibiotics. This continuous exposure is what defines selective pressure and causes bacterial genome to rapidly evolve through genomic mutations, resulting in resistant strains24.
Approach
Aim 1: Estimate the impact of passing an ASP mandate in California on hospital MRSA and C. diff rates
Hypothesis: After July 1, 2015 (passage of California SB 1311), MRSA and C. diff rates dropped significantly in California compared to other states. We used a difference-in-difference with hospital FE model to estimate the effect of passing this bill.
Natural experiment: California’s Senate Bill 1311, which was approved on September
7
monitoring and evaluation of the judicious use of antimicrobials; (2) form a physician-lead multidisciplinary antimicrobial stewardship committee; (3) appoint to that committee a
physician or pharmacist who has expertise in antimicrobial stewardship through prior training or participation in continued education programs; and (4) report ASP activities to appropriate hospital committees leading quality improvement activities25. After the passage of the SB 1311, the percentage of hospitals in California which met CDC’s 7 core elements for ASPs26 increased 16.6%: from 59.3% in 2014 to 69.2% in 201514.
Data sources: We used 2013-2017 hospital-level data from the Centers for Medicare & Medicaid Services’ (CMS) HospitalCompare, Provider of Service File and Medicare Cost Reports files. MRSA and C. diff are the only rates that are publicly available. While an ideal outcome measure would be the combined resistance rates of all relevant microorganisms, MRSA and C. diff are still reasonable proxies of resistance in hospitals.
Measures: The operational definition of each variable is presented, including the standardized infection ratio (SIR) for MRSA and C. diff27, are presented in Table 2.1. SIRs account for differences between hospitals (e.g., hospital’s patient case mix, hospital size, medical school affiliation). SIRs are defined as the ratio between number of infections detected by laboratorial tests and the number of infections predicted for a hospital with certain characteristics.
Research design: We used a difference-in-difference with hospital FE design to estimate the effect of the passage of an ASP mandate in California on MRSA and C. diff SIR. Since California was the only state in the US to pass a mandate with specific
requirements, we included all the other states in the comparison group. We used time FE to control for time trends. The estimating equation is illustrated below. We used 2013 as the reference year.
Equation 1: 𝑀𝑅𝑆𝐴/𝐶. 𝑑𝑖𝑓𝑓_𝑆𝐼𝑅ℎ𝑠𝑡= 𝛽0+ 𝛽1 𝐶𝑎𝑙𝑖𝑓𝑜𝑟𝑛𝑖𝑎𝑠+ 𝛽22014 + 𝛽32015 + 𝛽42016 +
𝛽52017 + 𝛽6𝐶𝑎𝑙𝑖𝑓𝑜𝑟𝑛𝑖𝑎𝑠∗ 2014 + 𝛽7𝐶𝑎𝑙𝑖𝑓𝑜𝑟𝑛𝑖𝑎𝑠∗ 2015 + 𝛽8𝐶𝑎𝑙𝑖𝑓𝑜𝑟𝑛𝑖𝑎𝑠∗
Where X represents a vector of time-variant covariates, h is an index for hospital, s is an index for state and t is the time period. Variables are defined in Table 2.1.
Power calculations & sample size: From the few studies in the field, one found an 8 percentage point decrease in the rate of MRSA over the course of 4 years (52% vs 44%) after the implementation of a preauthorization policy19; another study found a 9.9 percentage point decrease in the rate of meropenem-resistant P. aeruginosa during the 6 years (13.7% vs 3.8%) after implementing a computerized preauthorization and a prospective audit policy20. For our power analysis, we used the proportions and effect size from the first case with a 95% significance level and 80% power. Based on these parameters, a sample size of 636 hospitals would be required in each group to detect an 8 percentage point difference. Aim 2: Examine the association between statewide adoption of the CDC’s 7 Core Elements of ASP and MRSA and C. diff rates in US states
Hypothesis: States with a higher percentage of compliance to the CDC’s 7 core
elements for ASPs will have significantly lower MRSA and C. diff rates. We tested this hypothesis by estimating a state and time FE model.
Justification & feasibility: The study of ASPs has not been consistently addressed or emphasized. However, the CDC has recently released guidelines for a minimum standard ASP, which includes 7 core components to support optimal antibiotic use: leadership commitment, accountability, drug expertise, action (implement at least one recommended action), tracking, reporting and education26. Moreover, previous studies have examined the impact of ASPs on antimicrobial usage11,12,15–17 rather than AMR rates. Hospital adoption of ASPs is relevant because of the widespread use of antimicrobial agents in inpatient
services8, which makes them more susceptible to the emergence of resistant strains.
9
data from the Patient Safety Atlas website refers to acute care hospitals nationwide, collected through the CDC’s National Healthcare Safety Network (NHSN).
Measures: The outcomes in this aim are the same as in aim 1. The main explanatory variable is ASP, which is defined as the percentage of hospitals that meet the CDC’s 7 core components for ASPs26 in a given state. Other time-variant control variables are listed in Table 2.1.
Research design: To account for time-invariant unmeasured confounders (Figure 2.1), we used a state and time FE estimation model. Our main regressor was the percentage of hospitals that meet the CDC’s 7 core components for ASP in a given state over time (2014-2016). We estimated the association of this measure with two outcome variables: MRSA and C. diff SIR. We controlled for the time-variant characteristics listed in Table 2.1. We used Hausman tests to confirm model specification.
Equation 2: 𝑀𝑅𝑆𝐴/𝐶. 𝑑𝑖𝑓𝑓_𝑆𝐼𝑅𝑠𝑡= 𝛽0+ 𝛽1 𝑃𝑐𝑡𝐶𝑜𝑚𝑝𝑙𝑖𝑎𝑛𝑐𝑒𝑠𝑡+ 𝛽2 𝑆𝑡𝑎𝑡𝑒𝑠+ 𝛽3 𝑌𝑒𝑎𝑟𝑡+
𝛽4 𝑋𝑠𝑡+ 𝜀𝑠𝑡
Where X represents a vector of time-variant covariates, s is an index for state and t is the time period (variables are defined in Table 2.1).
Aim 3: Measure the association of MRSA and C. diff rates with quality and clinical outcomes in hospitals nationwide
Hypothesis: Higher rates of MRSA and C. diff in acute care hospitals are related to higher rates of 30-day hospital readmissions, 30-day mortality, longer length of stays, and more intensive care unit (ICU) days in US hospitals. We used hospital FE estimation methods to understand this association.
Justification & feasibility: This aim addresses the need to understand the impact of AMR on quality and clinical outcomes which may provide the basis for decisions by health services providers, administrators and policy makers to improve care. These outcomes have been studied separately in various studies5,12,15,16,18–20; however, results were mixed,
AMR rates and the selected outcomes across hospitals nationwide; therefore, results will be generalizable nationally.
Data sources: We used 2013-2017 data from HospitalCompare, Provider of Service and Medicare Cost Reports files. The outcome variables were 30-day readmissions, length of stay, 30-day mortality and ICU days. Key explanatory variables were MRSA and C. diff SIR. Variables are defined in Table 2.1. The sample represents acute care hospitals nationwide which provide health services to Medicare beneficiaries.
Research design: For each outcome, we estimated hospital and time FE models to control for time-invariant hospital characteristics that could confound the relationship between resistant strains and the outcomes of interest. We used clustered standard errors and weighted the regressions by hospital size. We used Hausman tests to confirm model specification.
Equation 3: 𝑄𝑢𝑎𝑙𝑖𝑡𝑦/𝐶𝑙𝑖𝑛𝑖𝑐𝑎𝑙_𝑚𝑒𝑎𝑠𝑢𝑟𝑒𝑠ℎ𝑡= 𝛽0+ 𝛽1 𝑀𝑅𝑆𝐴/𝐶. 𝑑𝑖𝑓𝑓_𝑆𝐼𝑅ℎ𝑡+ 𝛽2 𝐻𝑜𝑠𝑝ℎ+
𝛽3 𝑌𝑒𝑎𝑟𝑡+ 𝛽4 𝑋ℎ𝑡+ 𝜀ℎ𝑡
Where X represents a vector of time-variant covariates, h is an index for hospital and t is the time period.
Power calculations & sample size: One study28 observed an increased hazard of readmission (HR, 1.40; 95% CI, 1.33–1.46) for patients with a positive clinical culture for MRSA, Vancomycin-resistant Enterococcus (VRE) or C. diff. The 30-day readmission rate was 15% for patients with negative assay for those microorganisms and 25% for patients with a positive assay28. Therefore, we will use a 10% effect size, as well as 95% significance level and 80% statistical power for the power analysis. Based on these parameters, we will need at least 540 hospitals in total.
Sample
11
only in some states and most do not have the minimum number of infections required to calculate SIR. We also excluded hospitals outside of the US (Figure 2.2).
Ethical Procedures
Figures & Tables
13
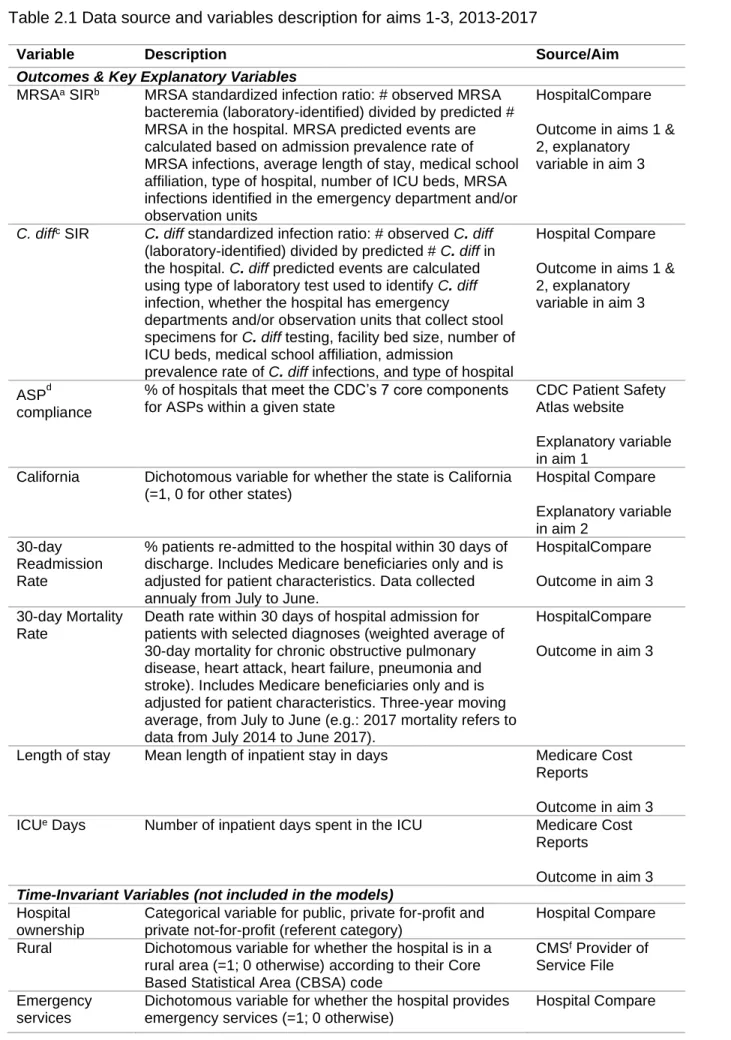
Table 2.1 Data source and variables description for aims 1-3, 2013-2017
Variable Description Source/Aim
Outcomes & Key Explanatory Variables
MRSAa SIRb MRSA standardized infection ratio: # observed MRSA bacteremia (laboratory-identified) divided by predicted # MRSA in the hospital. MRSA predicted events are calculated based on admission prevalence rate of MRSA infections, average length of stay, medical school affiliation, type of hospital, number of ICU beds, MRSA infections identified in the emergency department and/or observation units
HospitalCompare
Outcome in aims 1 & 2, explanatory variable in aim 3
C. diffc SIR C. diff standardized infection ratio: # observed C. diff (laboratory-identified) divided by predicted # C. diff in the hospital. C. diff predicted events are calculated using type of laboratory test used to identify C. diff infection, whether the hospital has emergency
departments and/or observation units that collect stool specimens for C. diff testing, facility bed size, number of ICU beds, medical school affiliation, admission
prevalence rate of C. diff infections, and type of hospital
Hospital Compare
Outcome in aims 1 & 2, explanatory variable in aim 3
ASPd compliance
% of hospitals that meet the CDC’s 7 core components for ASPs within a given state
CDC Patient Safety Atlas website
Explanatory variable in aim 1
California Dichotomous variable for whether the state is California (=1, 0 for other states)
Hospital Compare
Explanatory variable in aim 2
30-day Readmission Rate
% patients re-admitted to the hospital within 30 days of discharge. Includes Medicare beneficiaries only and is adjusted for patient characteristics. Data collected annualy from July to June.
HospitalCompare
Outcome in aim 3
30-day Mortality Rate
Death rate within 30 days of hospital admission for patients with selected diagnoses (weighted average of 30-day mortality for chronic obstructive pulmonary disease, heart attack, heart failure, pneumonia and stroke). Includes Medicare beneficiaries only and is adjusted for patient characteristics. Three-year moving average, from July to June (e.g.: 2017 mortality refers to data from July 2014 to June 2017).
HospitalCompare
Outcome in aim 3
Length of stay Mean length of inpatient stay in days Medicare Cost Reports
Outcome in aim 3 ICUe Days Number of inpatient days spent in the ICU Medicare Cost
Reports
Outcome in aim 3 Time-Invariant Variables (not included in the models)
Hospital ownership
Categorical variable for public, private for-profit and private not-for-profit (referent category)
Hospital Compare
Rural Dichotomous variable for whether the hospital is in a rural area (=1; 0 otherwise) according to their Core Based Statistical Area (CBSA) code
CMSf Provider of Service File
Emergency services
Dichotomous variable for whether the hospital provides emergency services (=1; 0 otherwise)
15
Variable Description Source/Aim
ICU Services Dichotomous variable for whether the hospital provides intensive care services (=1; 0 otherwise)
CMS Provider of Service File Time-Variant Control Variables
Teaching hospital
Dichotomous variable for whether the hospital is affiliated with a medical school (=1; 0 otherwise)
CMSd Provider of Service File
Hospital size Number of beds in the hospital Medicare Cost Reports
Number of changes in ownership
Number of times hospital has undergone a change in ownership. Categorical variable for “No changes” (=1), “One time” (=2), “Two or more” (=3) changes in ownership within a given year
CMS Provider of Service File
% ICU beds % of ICU beds relative to total beds in the hospital Medicare Cost Reports
Quality accreditation
Dichotomous variable for whether the hospital is accredited by a CMS-approved accreditation organization (=1; 0 otherwise). Quality accreditation organizations include The Joint Commission (most of accredited hospitals), American Osteopathic Association Healthcare Facilities Accreditation Program, Det Norske Veritas Germanischer Lloyd, and Center for
Improvement in Healthcare Quality
CMS Provider of Service File
Compliance with CMS
requirements
Dichotomous variable for whether the hospital is in compliance with Medicare Conditions of Participation (CoP) for all services, areas and locations covered by the hospital's provider agreement under its CMS Certification Number (=1; 0 otherwise)
CMS Provider of Service File
Patient Safety Index
Composite measure of rates of pressure ulcer, iatrogenic pneumothorax, in-hospital fall with hip fracture, perioperative hemorrhage or hematoma, postoperative acute kidney injury, postoperative respiratory failure, perioperative pulmonary embolism (PE) or deep vein thrombosis (DVT), postoperative sepsis, postoperative wound dehiscence and unrecognized abdominopelvic accidental
puncture/laceration. Includes Medicare beneficiaries only and is adjusted for patient characteristics. Two-year moving average, from July to June (e.g.: 2017 refers to data from July 2015 to June 2017).
Hospital Compare
Length of stay Mean length of inpatient stay in days Medicare Cost Reports
30-day Readmission Rate
% patients re-admitted to the hospital within 30 days of discharge. Includes Medicare beneficiaries only and is adjusted for patient characteristics. Data collected yearly from July to June.
Hospital Compare
a methicillin-resistant Staphylococcus aureus b Standardized infection ratio
cClostridium difficile
d Antimicrobial stewardship program e Intensive Care Unit
CHAPTER 3. IMPACT OF CALIFORNIA’S MANDATE FOR ANTIMICROBIAL STEWARDSHIP PROGRAMS ON RATES OF METHICILLIN-RESISTANT STAPHYLOCOCCUS AUREUS AND CLOSTRIDIOIDES DIFFICILE IN ACUTE CARE
HOSPITALS Overview
Objective: Estimate the impact of California’s Antimicrobial Stewardship Program (ASP) mandate on methicillin-resistant Staphylococcus aureus (MRSA) and Clostridioides difficile (C. diff) rates in acute care hospitals. Data Sources: 2013-2017 data from the
Centers for Medicare & Medicaid Services’ (CMS) HospitalCompare, Provider of Service File and Medicare Cost Reports. Study Design: Difference-in-difference model with hospital fixed effects to compare CA with all other states before and after the ASP mandate.
Outcomes: standardized infection ratio (SIR) for MRSA and C. diff. Time-variant covariates: medical school affiliation, bed count, quality accreditation, number of changes in ownership, compliance with CMS requirements, % intensive care unit beds, average length of stay, patient safety index, and 30-day readmissions rate. Principal Findings: In 2013, CA hospitals had an average MRSA SIR of 0.79 versus 0.94 in other states, and an average C. diff SIR of 1.01 versus 0.77 in other states. CA hospitals had increases (p<0.05) of 23%, 30%, and 20% in their MRSA SIR in 2015, 2016 and 2017, respectively. CA hospitals were associated with a 20% (p<0.001) decrease in their C. diff SIR only in 2017 compared to other states. Conclusions: The mandate was associated with a decrease in C. diff infections and an increase in MRSA SIR in California versus all other states.
17 Introduction
While antibiotics were considered life-savers in the 1940s, the widespread misuse of antimicrobials has diminished their effectiveness, representing a rapidly-growing threat to public health29. Each year, as many as 2 million Americans will acquire serious infections caused by bacteria resistant to one or more antibiotics resulting in 23,000 deaths, $20 billion in direct healthcare costs, and $35 billion in overall societal costs1.
The problem is not confined to the United States. The World Health Organization considers antimicrobial resistance (AMR) an emerging global threat30,31. The United Nations General Assembly launched a global effort to tackle AMR in 2016, and the European
Commission, World Health Organization, G-7 and G-20 countries recently launched an antimicrobial stewardship action plan to address this issue of “extraordinary gravity”32,33.The problem has gained unprecedented political attention because antimicrobial consumption and the number of AMR infections are rapidly increasing in both developed and developing countries, where consumption increased 75% from 2000-201529,34.
Antibiotic prescribing and utilization practices are major modifiable drivers of AMR2, with up to 50% of US antibiotic prescriptions being neither necessary nor appropriate in outpatient and inpatient settings1,3. AMR is a multifactorial issue that must be addressed on multiple fronts35. Some suggest a two-pronged approach: developing new antimicrobials to fight resistant strains while limiting use of current drugs to reduce rising resistance rates36. Our study will focus on the stewardship of current antimicrobials in hospitals.
In 2014, the CDC started recommending the adoption of ASPs by hospitals, and they have published a checklist to assist with implementing the seven core components of
ASPs38, which the CDC considers a minimum standard in hospitals. Those seven elements are related to the hospital’s infrastructure and implementation of activities related to
antimicrobial stewardship26. Veteran’s Affairs (VA) Medical Centers have required ASPs since 2014. Moreover, through CDC’s National Healthcare Safety Network (NHSN), acute care hospitals are currently required by the Centers for Medicare and Medicaid Services (CMS) to report five types of healthcare-associated infections (HAIs): central line-associated bloodstream infections (CLABSI), catheter-associated urinary tract infections (CAUTI), select surgical site infections (SSI), Clostridioides difficile (C.diff) infections, and
methicillin-resistant Staphylococcus aureus (MRSA) infections39.
Other initiatives also include the US Government’s AMR Challenge, which started at the end of 201840, and the Antibiotic Use and Resistance module within NHSN reporting system41. The latter is currently optional, but some states have moved towards mandating its use42. Additionally, the CDC has recently increased funding for public health departments to work on and implement stewardship activities at the state and local levels43.
While MRSA results from the development of resistant strains,C. diff is not
technically a resistant bacteria; instead, C. diff is a bacteria with innate resistance to many antibiotics. It causes diarrheal disease after exposure to antibiotics which deplete the native microbiome and allow for its overpopulation. For that reason, C. diff infection is considered an antibiotic adverse event and indicator of antimicrobial use, which is also why it is used as an outcome in several studies addressing antimicrobial stewardship44,45 and prescribing practices46,47. ASPs are universally recognized as essential tools in healthcare system infection control efforts4; In hospitals, ASPs are associated with shorter hospitalizations and decreased antimicrobial consumption5.
At the state level, California has pioneered efforts to address AMR. In 2008,
19
required that, by July 1 2015, all California acute care hospitals: (1) adopt and implement an ASP in accordance with federal and professional guidelines (e.g., monitoring and evaluation of the judicious use of antimicrobials); (2) form a physician-led multidisciplinary antimicrobial stewardship committee; (3) appoint to that committee a physician or pharmacist with
expertise in antimicrobial stewardship through prior training or continued education; and (4) report ASP activities to appropriate hospital committees leading quality improvement activities25.
After the passage of the SB 1311, the percentage of hospitals in California which met CDC’s 7 core elements for ASPs26 increased from 59.3% in 2014 to 69.2% in 201514 and 81% in 201627; however the effect of the CA law on AMR-related outcomes is still unknown. Although many studies examine ASPs at the hospital level, most analyze its impact on prescribing practices and antibiotics use11,12,15–17 rather than directly on AMR rates. One of the major reasons for the lack of more assertive investigation is that information on ASPs and AMR rates are not generally available in publicly available datasets.
The present study estimates the impact of passing an ASP mandate in California (SB 1311) on MRSA and C. diff rates in acute care hospitals. Our hypothesis is that after 2015, MRSA and C. diff rates in acute care hospitals dropped significantly in California compared to other states. This study provides a novel approach to estimating the effect of such a mandate and can assist policymakers and healthcare administrators to make informed decisions on the implementation of ASPs.
Methods Data sources
Subjects
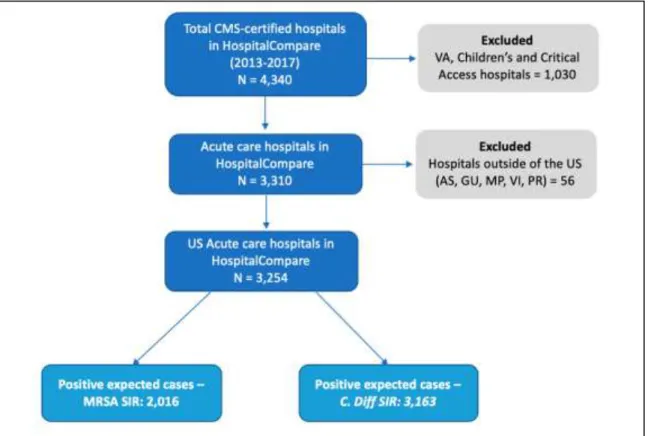
We identified all CMS-certified acute care hospitals in the US for which MRSA/C. diff standardized infection ratio (SIR) data were available from 2013 through 2017. We excluded VA hospitals (different data collection period), children’s hospitals (different case mix/hospital epidemiology), and critical access hospitals. The latter are required to report infection data only in some states, and most do not have the minimum number of infections required to calculate SIR.
Measures
We had two primary outcomes: MRSA SIR and C. diff SIR. The Hospital Compare system uses infection data from the CDC’s NHSN, which calculates each hospital’s MRSA SIR (ratio of MRSA bacteremia laboratory-identified events to the predicted number of MRSA bacteremia events) and C. diff SIR (ratio of C. diff laboratory-identified events to the predicted number of C. diff events).
MRSA predicted events are calculated by the NHSN based on admission prevalence rate of MRSA infections, average length of stay, medical school affiliation, type of hospital, number of ICU beds, and amount of MRSA infections identified in the emergency
department and/or observation units. C. diff predicted events are calculated using the type of laboratory test used to identify C. diff infection, whether the hospital has emergency
departments and/or observation units that collect stool specimens for C. diff testing, facility bed size, number of ICU beds, medical school affiliation, admission prevalence rate of C. diff infections, and type of hospital. The MRSA/C. diff SIR is calculated only for hospitals with at least one predicted event39.
21 Analysis
We estimated a difference-in-difference (DID) model with hospital fixed effects (FE) for each outcome (MRSA SIR and C. diff SIR). We chose hospital FE because it controls for both unobserved as well as observed time-invariant hospital-specific characteristics, such as location (state, rural vs urban), hospital ownership, teaching status, specialty hospital,
patient case mix, and structural factors, for example, infection control team, number/distance of sinks around hospital rooms, ability to track lab results electronically, safe surgery check lists, etc. Those characteristics are likely related to both our key variable of interest (being in California) and our outcomes (MRSA/C. diff SIR) and could confound the relationship
estimated. Since several of these variables are not observed and mostly time-invariant, Hospital FE was chosen over other estimation methods.
We confirmed our model specification by using Hausman tests between a FE vs ordinary least squares model, and a FE vs random effects model. In both cases, coefficients in the FE model were significantly different from the other estimation methods, therefore, we selected the FE estimation to obtain consistent parameter estimates.
For the DID approach to provide unbiased estimates, two assumptions should hold. First, California is the only state being impacted by the policy change and there is no other shock happening at the same time; this assumption is reasonable as California was the only state to pass such legislation in the study period (2013-2017)49. Second, California and the other states should have parallel trends for MRSA and C. diff SIR in the pre-treatment
period. This assumption was tested by the inclusion of an interaction between each year and our key explanatory variable. Robust standard errors were used to address
heteroscedasticity among hospitals with varying sizes.
with higher compliance could be a better counterfactual for hospitals California in this analysis.
Results
We included data for 2,016 and 3,163 acute care hospitals in the US in the MRSA and C. diff models respectively, which corresponds to 51.9% and 81.5% of the total acute care hospitals in the country. For MRSA, the SIR peaked in 2015 and then started
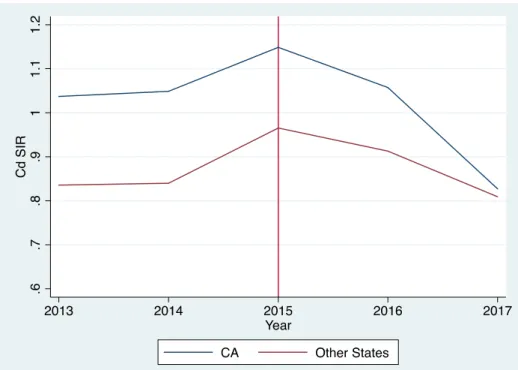
decreasing in CA hospitals; other states had a less steep upward trend for MRSA in 2015 (Figure 3.1). For C. diff, trends were very similar between CA and other states before the mandate with a steeper decrease in CA after the mandate (Figure 3.2).
Table 3.1 provides descriptive statistics for California hospitals versus hospitals in other states before the mandate. In 2013, the average SIR in CA hospitals was 0.79 for MRSA (versus 0.94 in other states) and 1.01 for C. diff (versus 0.77 in other states). In terms of hospital characteristics, CA hospitals were larger, had a higher percentage of ICU beds and quality accredited hospitals, and a lower percentage of hospitals that were teaching, rural, had changed ownership, and were compliant with CMS requirements, compared to other states (Table 3.1). The sample size in both Tables 3.1 and 3.2 is larger for the C. diff model because there were more hospitals for which C. diff SIR was available, since that is a more common infection.
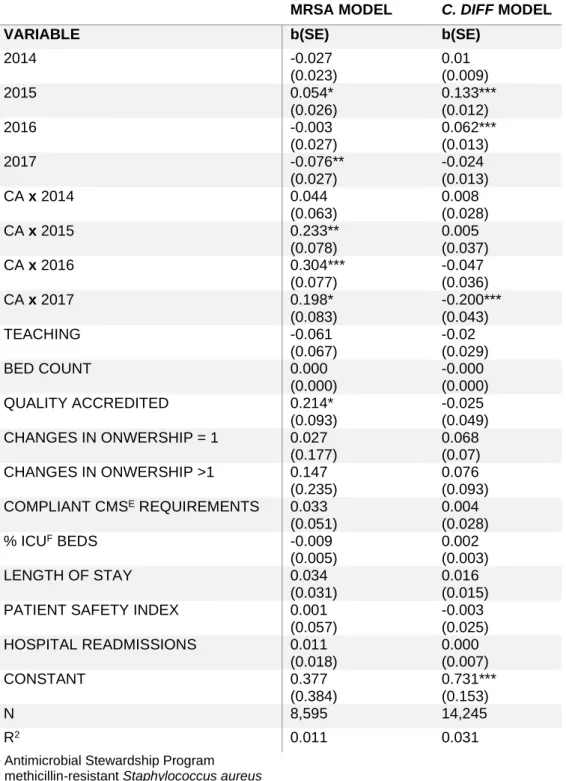
Table 3.2 provides adjusted estimates from the fixed effects regressions. Compared to hospitals in other states, CA hospitals had increases (p<0.05) of 23%, 30%, and 20% in their MRSA SIR in 2015, 2016 and 2017, respectively, although there was a downward trend after 2016 relative to other states. CA hospitals were associated with a 20% (p<0.001) decrease in their C. diff SIR only in 2017 (Table 3.2). Time trends were significant in 2015 and 2017 in the MRSA model and in 2015 and 2016 in the C. diff model. Quality
accreditation was associated with an increased MRSA SIR.
23 Discussion
We analyzed whether California’s SB 1311 supporting ASPs reduced MRSA and C. diff infections in acute care hospitals. Our results show that the CA mandate had significant associations with MRSA/C. diff SIRs; surprisingly, that association was in the opposite direction for MRSA.
C. diff SIR decreased after the mandate
Our findings support our hypothesis that the mandate in California would be associated with a reduction in the SIR for C. diff. The mandate introduced in SB 1311 was associated with a significant decrease in C. diff SIR in 2017, but a sharper downward trend can be observed in 2015 compared to other states (Figure 3.2). Other studies have also shown a decrease in C. diff rates after restricting antimicrobial use50,51. One study showed a 19% decrease in C. diff SIR after implementing antibiotic preauthorization combined with clinician education52. Another one detected a decrease as large as 66% in incidence of C. diff infections (incidence rate ratio = 0.34) after implementing revised antibiotic guidelines50.
Moreover, it is estimated that hospital antibiotic prescribing could be improved in 37% of the cases, and a 30% reduction in broad-spectrum antibiotic use could result in a 26% decrease in C. diff infections53. In the outpatient setting a 10% reduction in antibiotic prescribing was associated with a 17% decrease in C. diff rates47.
In a systematic literature review, ASP interventions in several different countries were associated with a decrease in C. diff incidence in 62.5% of the studies analyzed - especially in those implementing antimicrobial use restrictions, despite heterogeneity of interventions and ways in which outcomes were reported44. These findings are consistent with the fact that antibiotic use is the main driver for C. diff; therefore, C. diff rates should respond quicker to changes in ASPs compared to MRSA54.
MRSA SIR increased after the mandate
had a lower MRSA SIR before the enactment of SB 1311, which may also contribute to our findings.
One possible reason for the increased MRSA is because the timeframe of this study coincided with the recent increased attention to the opioid epidemic, which has led to an increased incidence of MRSA bacteremia55,56. Furthermore, the impact of ASPs is likely stronger for gram-negative microorganisms since most of the restricted antibiotics are primarily for gram-negative bacteria, which is not the case of MRSA.
Another explanation is that resistant strains will likely not immediately respond to improved stewardship efforts, in part, because MRSA control is also dependent on improving infection prevention (i.e., increased hand hygiene, improved environmental disinfection, and reducing risk of CLABSI) and MRSA is very prevalent in the community (not only in
healthcare settings). A 3-year ASP intervention, for example, has also been associated with increased MRSA incidence, although results should be interpreted with caution because of the small sample and single/international hospital setting57. However, a study that analyzed data from 6 post-intervention years found a large significant reduction in MRSA incidence in the last two years of the study58.
MRSA and C. diff SIR increased in 2015
25 Other ASP initiatives
California has been the only state to pass a mandate with specific ASP requirements as of 201749; however, several factors may have increased ASP in hospitals in other states. One factor includes a voluntary adoption of hospital ASPs nationwide after the CDC
launched the 7 core components for ASP6,45 and the Joint Commission announced their new antimicrobial stewardship requirements that went into effect in 201760. Both programs affect all CMS-certified hospitals nationwide, so our estimates should still be unbiased.
Regional and local initiatives may also increase ASPs. For example, Missouri Senate Bill 579, passed in 2016, requires strict reporting of HAIs and implementation of ASPs statewide by the end of 2017, although it does not provide specific ASP standards to be implemented61. Moreover, the largest healthcare system in Utah has been actively promoting ASP implementation in small community hospitals in the past few years62. Despite those scattered initiatives, we can still observe a significant impact of the CA mandate in acute care hospitals.
Limitations
We identified several limitations of our study. First, we could only assess 2 years of post-intervention data; to the extent that MRSA and C. diff rates would continue to fall, we would underestimate the impact of the legislation. Second, although CA hospitals’ adoption of the CDC 7 core components for ASP increased from 58% in 2014 to 81% in 201627, we are not able to estimate the differential impact of specific antimicrobial policies or ASP components, only the overall impact of the mandate. Since ASP adoption did not reach 100% by 2017, that overall impact may have been attenuated by the few hospitals that did not adopt the minimum standard ASP proposed in the mandate. We are also not able to directly assess antimicrobial use as a mediating factor between ASP and AMR.
to the NHSN. Results may differ for other microorganisms; we restricted our study to MRSA and C. diff because data are publicly available through Hospital Compare. Finally, even though our data support the parallel trends assumption, we only have two years of pre-treatment data and are not able to verify time trends before that period.
Conclusion & Policy Implications
The CA mandate was associated with a decrease in C. diff rates in 2017. A sharper decrease in C. diff after 2015 is consistent with the fact that C. diff rates are driven largely by use of antibiotics. Contrary to our hypothesis, the CA ASP mandate was not associated with an immediate decrease in MRSA SIR. In response to the CA mandate, hospitals may have proactively identified AMR cases, which peaked in 2015, and then started decreasing as an expected lagged response to the mandate.
The effect of the mandate may have been diluted by the Joint Commission’s 2016 nationwide ASP requirements, but we were still able to identify a significant impact in both outcome measures. More data on post-intervention years are needed to assess the long-term impact of the mandate.
This study has several policy implications. It is the first to shed light on a major and persistent healthcare problem by measuring the impact of a statewide ASP mandate. By doing so, it provides evidence on the effectiveness of antimicrobial stewardship at the hospital level for decision-makers at various levels of the healthcare system.
Evidence generated in this study can be used by healthcare administrators to
understand the impact of antibiotic prescribing practices on patient and financial outcomes in their institution, to spur action towards adopting or improving their ASP according to federal guidelines, and to bring awareness of a possible under-identification of AMR cases. This study’s results can also contribute to continued education of healthcare providers, improving their awareness of a broader picture of AMR and how compliance with stewardship actions can make an impact towards better healthcare.
27
Figures & Tables
Figure 3.1 SIRa for MRSAb in California versus other states, 2013-2017
a Standardized infection ratio
29
Figure 3.2 SIRa for C. diffb in California versus other states, 2013-2017
a Standardized infection ratio
Table 3.1 Descriptive statistics for MRSAa and C. diffb model by California versus other states in 2013
MRSA Model C. diff Model
Variable Other States
(1,652)
CA (215) p-value Other States
(2,754)
CA (281) p-value
MRSA SIRc 0.935 0.789 0.012
C. diff SIR 0.765 1.012 0.000
Public 13.1% 16.7% 0.146 16.7% 17.8% 0.630
Private For
Profit 17.7% 20.5% 0.328 20.7% 23.5% 0.280
Private Not For
Profit 69.1% 62.8% 0.060 62.6% 58.7% 0.201
Teaching 47.2% 35.3% 0.001 33.9% 28.5% 0.067
Rural 11.7% 0.9% 0.000 29.5% 2.8% 0.000
Bed Count 358.4 312.6 0.009 251.2 265.2 0.335
Quality
Accredited 97.2% 98.1% 0.430 90.8% 97.9% 0.000
Changes in
ownership = 0 27.8% 47.0%
0.000
30.9% 47.3%
0.000 Changes in
ownership = 1 32.6% 31.2% 31.1% 29.9%
Changes in
ownership >1 39.6% 21.9% 38.0% 22.8%
Compliant CMSd
requirements
76.3% 65.6% 0.001 77.7% 66.9% 0.000
Emergency
Services 98.7% 97.7% 0.251 96.7% 94.7% 0.084
% ICUe beds 8.1% 9.6% 0.000 7.7% 9.2% 0.000
Length of Stay
(days) 3.6 3.5 0.038 3.4 3.4 0.462
ICU Services 94.2% 96.7% 0.123 86.9% 95.4% 0.000
Patient Safety
Index 0.875 0.887 0.475 0.858 0.879 0.096
% Hospital
Readmissions 15.7% 15.6% 0.088 15.6% 15.5% 0.049
a methicillin-resistant Staphylococcus aureus bClostridioides difficile
c Standardized infection ratio
31
Table 3.2 Regression-adjusted estimates for the effect of the ASPa mandate in California on MRSAb and C. diffc SIRsd, 2013-2017
MRSA MODEL C. DIFF MODEL
VARIABLE b(SE) b(SE)
2014 -0.027
(0.023)
0.01 (0.009)
2015 0.054*
(0.026)
0.133*** (0.012)
2016 -0.003
(0.027)
0.062*** (0.013)
2017 -0.076**
(0.027)
-0.024 (0.013)
CA x 2014 0.044
(0.063)
0.008 (0.028)
CA x 2015 0.233**
(0.078)
0.005 (0.037)
CA x 2016 0.304***
(0.077)
-0.047 (0.036)
CA x 2017 0.198*
(0.083)
-0.200*** (0.043)
TEACHING -0.061
(0.067)
-0.02 (0.029)
BED COUNT 0.000
(0.000)
-0.000 (0.000)
QUALITY ACCREDITED 0.214*
(0.093)
-0.025 (0.049) CHANGES IN ONWERSHIP = 1 0.027
(0.177)
0.068 (0.07) CHANGES IN ONWERSHIP >1 0.147
(0.235)
0.076 (0.093) COMPLIANT CMSE REQUIREMENTS 0.033
(0.051)
0.004 (0.028)
% ICUF BEDS -0.009
(0.005)
0.002 (0.003)
LENGTH OF STAY 0.034
(0.031)
0.016 (0.015)
PATIENT SAFETY INDEX 0.001
(0.057)
-0.003 (0.025) HOSPITAL READMISSIONS 0.011
(0.018)
0.000 (0.007)
CONSTANT 0.377
(0.384)
0.731*** (0.153)
N 8,595 14,245
R2 0.011 0.031
a Antimicrobial Stewardship Program b methicillin-resistant Staphylococcus aureus
c Clostridioides difficile
d Standardized infection ratios
e Centers for Medicare and Medicaid Services f Intensive Care Unit
CHAPTER 4. ASSOCIATION BETWEEN STATEWIDE ADOPTION OF THE CDC’S 7 CORE ELEMENTS OF ANTIMICROBIAL STEWARDSHIP PROGRAMS AND RATES OF
METHICILLIN-RESISTANT STAPHYLOCOCCUS AUREUS AND CLOSTRIDIOIDES DIFFICILE IN US STATES
Overview
Objective: Measure the association between statewide adoption of the Centers for Disease Control and Prevention’s (CDC) antimicrobial stewardship program (ASP) 7 core components and hospital methicillin-resistant Staphylococcus aureus (MRSA) and
Clostridioides difficile (C. diff) rates in US states. Hypothesis: States with a higher
percentage of compliance to CDC’s 7 core components for ASPs will have significantly lower MRSA and C. diff rates. Participants: all US states. Design: Observational longitudinal study. Methods: Data: We used 2014-2016 data from HospitalCompare, Provider of Service File, Medicare Cost Reports, and the Patient Safety Atlas website. Outcomes: Methicillin-resistant staphylococcus aureus (MRSA) standardized infection ratio (SIR) and
33 Introduction
Antimicrobial resistance (AMR) is a major public health threat lying at the intersection of healthcare quality and global health security1,21. In the US in 2013, AMR resulted in 23,000 deaths, $20 billion in direct healthcare costs and $35 billion in overall societal costs1.
Resistance to the first antimicrobial, penicillin, was reported in 1942, soon after its discovery63. AMR is not a novel problem, but it has recently gained great attention because of a rapid increase in resistance rates and the small number of new antimicrobial agents22. It takes several years for a new antibiotic to be developed and much shorter time for bacteria to become resistant to it.
Misuse and overuse of antimicrobials are major causes of AMR, such as methicillin-resistant Staphylococcus aureus (MRSA) infections. There is an important opportunity for reducing the incidence and impact of AMR because up to 50% of all antimicrobials prescribed in US acute care hospitals are unnecessary or inappropriate64–67. Beyond resistance, incorrect antibiotic prescribing can also lead to adverse events (sometimes severe) and ~250,000 Clostridioides difficile (C. diff) infections in hospitalized patients every year1, with no therapeutic benefit53,68,69. C. diff is not technically a resistant bacteria but it has an innate resistance to many antibiotics and is vastly used as a marker for antimicrobial use because it thrives when the normal human microbiome is killed by the use of antimicrobials. As a management tool for hospitals, antimicrobial stewardship programs (ASPs) can help ensure that antimicrobials are only prescribed when needed and that the right
antimicrobial, dose and duration of treatment are being prescribed26. Although ASPs can take different approaches (e.g., antibiotic time outs, prior authorization, prospective audit and feedback), all involve stricter assessment and monitoring of antimicrobial use and
sometimes restricting the use of broad spectrum agents5,26.
or antimicrobial use5,71,74 rather than resistance rates. Moreover, most studies that assessed the impact of ASP on infection rates were done in a single and/or international setting, so external generalizability is compromised44.
Controlling the emergence and spread of resistant microorganisms is a national priority. The Centers for Disease Control and Prevention (CDC) has launched a series of initiatives and guidelines to address the problem. In 2006, the CDC published guidelines on managing multi-drug resistant organisms in healthcare settings75; in 2009, it launched the “Get Smart for Healthcare Campaign”, to promote improved antibiotic use; and in 2013, it published a thorough report on the epidemiology and morbidity of resistant bacteria and C. diff 1, and listed the “loss of antibiotic protection” as one of the top public health concerns in the country76.
Finally, in 2014, the CDC launched specific guidelines for ASPs in acute care
hospitals as well as other healthcare settings26. Those guidelines add to the previous work of the Society for Healthcare Epidemiology of America, Infectious Disease Society of America, and The Joint Commission26,77. It sets a minimum standard, with 7 core elements for
hospitals’ ASPs: leadership commitment, accountability, drug expertise, action, tracking, reporting and education26.
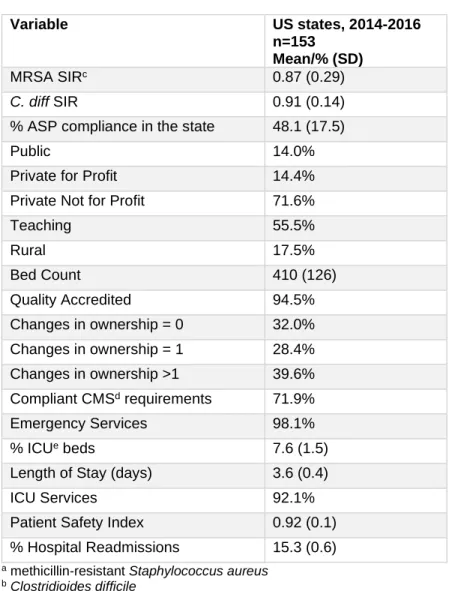
Despite these efforts, a national survey found that only 64% of hospitals in the country had some type of ASP policy in place in 2011. Larger, urban and teaching hospitals were more likely to have such policies; antibiograms and antimicrobial restriction policies were the most common78. Another nationwide survey conducted in 2014 found that 39% of acute care hospitals had implemented CDC’s 7 core elements for ASPs. At the state level, uptake ranged from 7-58%6. In 2015, that increased to 48.1%, with the highest increase in the leadership commitment component79. Larger hospitals and leadership support were associated with a comprehensive ASP in 2014 and 201579,80, teaching status was also significantly associated with the presence of ASP in 201579.
35
and C. diff infections is still unclear. Furthermore, the impact of ASPs on actual AMR rates in hospitals is uncertain or not explored.
The objective of this study was to examine compliance with CDC’s ASP 7 core
components between 2014 and 2016, as well as the association between statewide adoption of the CDC’s ASP 7 core components and hospital MRSA and C. diff rates in all US states. We hypothesized that: (1) compliance with the CDC’s ASP 7 core components would increase between 2014 and 2016; and (2) states with a higher percentage of compliance to CDC’s 7 core components for ASPs will have significantly lower MRSA and C. diff rates. Methods
Data sources
We merged 2014-2017 hospital-level data from the Centers for Medicare & Medicaid Services’ (CMS) HospitalCompare, Provider of Service File, Medicare Cost Reports, and 2014-2016 state-level data from CDC’s Patient Safety Atlas website. HospitalCompare compiles quality of care information from over 4,000 Medicare-certified hospitals, Provider of Service Files contain data on hospital characteristics and type of services provided, and Medicare Cost Reports includes utilization and cost data besides facility characteristics regarding all Medicare-certified providers. The CDC’s Patient Safety Atlas website has state-level data on hospital-acquired infections, antimicrobial resistance and ASPs from acute care hospitals nationwide, collected through the CDC National Healthcare Safety Network’s (NHSN) Patient Safety Component Annual Hospital Survey, which assesses compliance with the 7 core components of ASP.
Subjects
different data collection period, different case mix/hospital epidemiology and lack of reporting requirements for infection data, respectively.
Measures
Table 4.1 contains operational definitions for each variable. Our two outcomes are defined as follows: MRSA SIR is the ratio of MRSA bacteremia laboratory-identified events to the predicted number of MRSA bacteremia events; C. diff SIR is the ratio of C. diff
laboratory-identified events to the predicted number of C. diff events. SIRs are calculated for each hospital by the CDC’s NHSN and made available through HospitalCompare’s data system.
MRSA and C. diff predicted events are calculated by the NHSN based on several predictors. For MRSA, they take into account admission prevalence rate of MRSA infections, average length of stay, medical school affiliation, type of hospital, number of ICU beds, and amount of MRSA infections identified in the emergency department and/or observation units. C. diff predicted events are calculated using type of laboratory test used to identify infection, whether the hospital has emergency departments and/or observation units that collect stool specimens for testing, facility bed size, number of ICU beds, medical school affiliation, admission prevalence rate of C. diff infections, and type of hospital. The MRSA and C. diff SIRs are calculated only for hospitals with at least one predicted event39.
Our main regressor is the percentage of hospitals that meet the CDC’s 7 core
components for ASP in a given state over time (2014-2016). The CDC’s Patient Safety Atlas website shows a substantial increase in the percentage of compliance in every state
37 Analysis
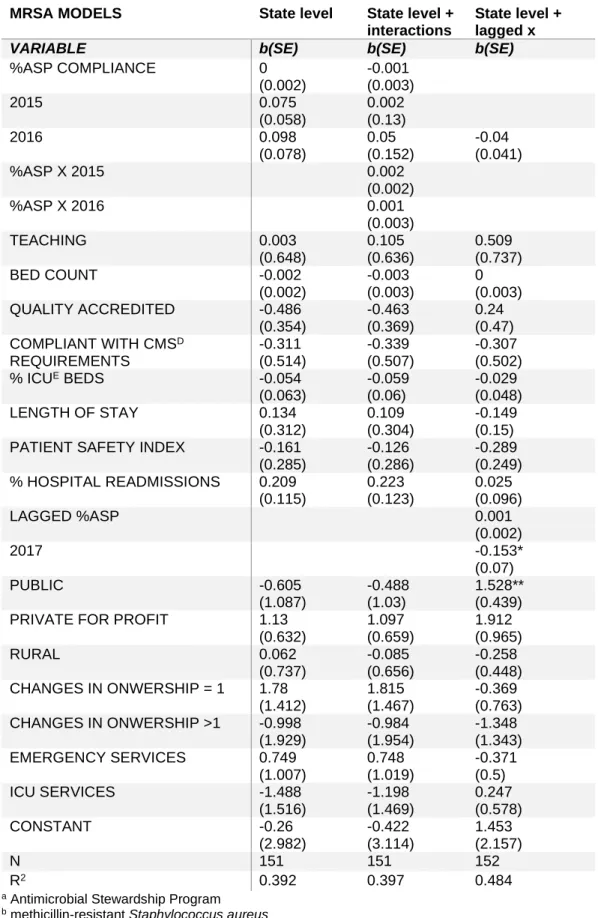
First, we used descriptive statistics to measure state-level variation in the percentage of hospitals meeting the CDC’s 7 core components for ASP between 2014-2016. Then, for each outcome, we estimated a set of different models using state fixed effects (FE).
We chose state FE because there are a number of time-invariant unmeasured confounders to the relationship between ASP and resistance/C. diff rates. These include location (state, rural vs urban), hospital ownership, teaching status, specialty hospital, patient case mix and structural factors. Since some of these variables are unobserved, we are not able to verify whether they are truly time-invariant, but we assume they have very little variation, if any variation at all.
As we used state-level analyses due to the availability of ASP data only at the state level, hospital data were aggregated at the state level using hospital size weights. The analyses were weighted by number of hospitals in each state, and we controlled for the time-varying characteristics listed in Table 4.1. In terms of model specification, we ran a Hausman test to assess whether the FE model was preferred to a random effects model.
We also tested using a lagged explanatory variable (2014-2016 ASP data and 2015-2017 outcomes) to address a possible reverse causation, and an interaction between ASP and time (years) to test whether there could be differential treatment effects in each specific year. Moreover, we re-estimated the models using hospital-level data, even though there was ASP variation only at the state level (Appendices A.1-A.3).
Results
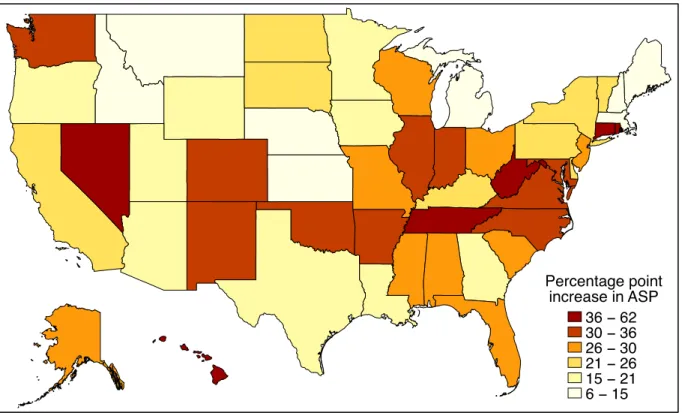
Increases in the percentage of hospitals meeting the CDC’s 7 core components for ASP between 2014 and 2016 ranged from 6-62% points (Figure 4.1). States with a smaller absolute increase usually had a higher percentage in 2014. For example, states with ≥50% compliance in 2014, such as AZ, CA, ID, MA, ME, NY and UT, had only 6-26% point